Development of Soil Consumption Driven by Urbanization
and Pattern of Built-up Areas in Prague Periphery
since the 19
thCentury
Jan STACHURA
1, Tomáš CHUMAN
1,2and Luděk ŠEFRNA
11Department of Physical Geography and Geoecology, Faculty of Science, Charles University in Prague, Prague, Czech Republic; 2Czech Geological Survey, Prague, Czech Republic
Abstract
Stachura J., Chuman T., Šefrna L. (2015): Development of soil consumption driven by urbanization and pattern of
built-up areas in Prague periphery since the 19th century. Soil & Water Res., 10: 252–261.
Soil consumption has become a very rapid and intensive process in many European countries, especially around large cities and important highways. The Prague periphery is not an exception. This paper analyses the extent and quality of consumed agricultural land and pattern of built-up areas in selected 22 cadastres in Prague
pe-riphery, by using historical maps and orthophotomaps, over four time horizons since the 19th century till 2010.
The results show an extensive soil consumption. The average extent of built-up area increased from less than 1% to more than 13% per cadastre. This extensive development caused consumption of high quality soils and changed the pattern of built-up areas from more compact to less compact built-up areas. The average nearest neighbour distance between built-up patches has increased by more than 38%.
Keywords: Czech Republic; land take; quality of soil; soil sealing; urban sprawl
Land use changes due to urbanization are one of the most serious environmental issues that Europe is facing today because the speed of the changes caused by urbanization, their frequency and magnitude increased unprecedentedly in the second half of the 20th century (Antrop 2000). Urban sprawl, a specific form of urbanization, is the most significant driver of land use changes. Urban sprawl is a phenomenon of spreading extensive forms of built-up areas into city agricultural surroundings (Torrens & Alberti 2000; Gayda et al. 2005) leading to soil consumption (conversion of agricultural land to developed areas) and soil sealing (covering soil with impermeable material e.g. asphalt, concrete).
Many studies (Sýkora 2002; Pauleit et al. 2005; Haase 2009; Scalenghe & Marsan 2009; Chuman & Romportl 2011) have shown that urban sprawl has significant negative impacts on the environment since it affects many ecosystem functions and services, e.g. water infiltration, water retention, habitat suitability, and food production. Many of these functions are
affected due to soil sealing. About 4% of soils have been sealed in the EU, and fertile soils near large agglomerations are often endangered (EEA 2010). In the EU’s “Thematic strategy for soil protection” (CEC 2006), soil sealing is considered to be a threat, and national authorities should adopt strategies to limit this phenomenon.
and the spatial structure of urban development over longer time scales are scarce. Therefore, the main objective of this research was to perform a qualita-tive and quantitaqualita-tive analysis of soil consumption and of the pattern of built-up areas in the Prague periphery since the 19th century.
An overview of the extent and intensity of urban sprawl in Europe and the Czech Republic. The primary source of data on urban sprawl for many EU countries is the CORINE land cover database. According to this database, land take is most in-tensive in highly inhabited regions like Benelux or some regions in Germany. Developed areas (artificial surfaces according to CORINE LC nomenclature) covered more than 8% in some NUTS 3 regions in these countries in 2006. The highest increase, of more than 5% of artificial surfaces, was found in southern Europe (Spain, Portugal, and Cyprus) between 2000 and 2006. The increase was much higher (above 20%) at the NUTS 3 region level. By using the “Land take per capita indicator”, Ireland, Spain, Portugal, and the Netherlands had the highest values in the year 2006. However, a comparison of the intensity of land take in these countries from 1990 to 2000 and from 2000 to 2006 showed a declining trend in the EU27 except for Spain. In opposite to that trend, there was an increase in land take intensity in the countries newly associated to the EU such as Romania, Latvia, and Bulgaria.
Land take mainly occurs at the expense of agricul-tural land. In the Czech Republic, detailed land use and land cover data also show an annual decline of arable land since 1990 (Bičík etal. 2010; Chuman & Romportl 2011; Kupková 2011). Data from the period 2000–2010 showed that Czech Republic was losing about 4000 ha of arable land annually (Czech Statistical Office 2013). However, a significant pro-portion of this arable land loss was not caused by the land take but by the conversion of arable land to grassland and forest land. Built-up areas increased by 80 ha annually from 2000–2010, but when including other artificial surfaces, the annual increase was up to 2000 ha. The proportion of all artificial surfaces was about 12% for periphery districts of Prague in 2011 and about 10.5% for the whole Czech Republic (Czech Statistical Office 2013).
Soil consumption significantly affects both the production and non-production functions of soils and is closely connected with food production and food self-sufficiency (Uhel 2006). High quality soil should be protected for food production, as rapid
soil consumption may endanger the food security and food production for the next generation (Chen 2007; Kibblewaithe et al. 2012). Therefore, not only the quantity, but also the quality of consumed soils should be of primary concern. Surprisingly, on the outskirts of large cities such as Prague there are many examples where soil consumption occurs even on the most fertile soils, despite the fact that this most fertile soil has been protected for centuries to support the food production (Spilková & Šefrna 2010). The cost of soil is a crucial factor in soil pro-tection (Roakes 1996), and the low cost of fertile soils in the Czech Republic has been criticized in materials of the EU (Prokop et al. 2011).
MATERIAL AND METHODS
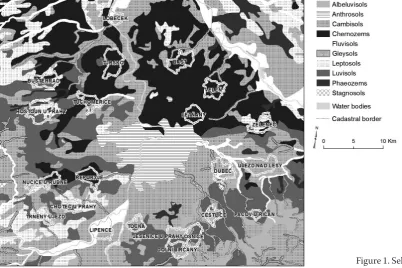
Cadastre selection. Twenty-two model cadastres were selected on the Prague periphery to analyze the extent and the pattern of built-up areas and quality of built-up soils in the long term. The 22 cadastres set was chosen to cover a maximum soil quality di-versity of dominant soil types at a driving distance of up to 20 min from Prague (Figure 1).
Soil cover, soil quality, and built-up areas data acquisition. Soil cover and soil quality were derived from the Evaluated Soil Ecological Unit – ESEU (“BPEJ” in original) database (Research Institute for Soil and Water Conservation, Prague, Czech Repub-lic). Each ESEU represents soils of homogeneous physical and chemical characteristics and productivity (Němeček et al. 1985). Based on physical and chemi-cal properties of soil (mainly pH, cation exchange capacity, basic saturation, soil organic matter content, soil texture, soil water regime) weighted by climate region the quality (productivity) of each ESEU is expressed on a 100 point scale index (Němeček et al. 1985). The area weighted average soil quality index of all ESEU was computed for each selected cadastre and for built-up area in each cadastre. These indexes of the built-up area and of the whole cadastre were put in ratio (times 100) to show whether lower (< 100) or higher (> 100) than average quality soils were consumed.
refer to this time horizon as the 1830s). These maps provide a precise source of information about the landscape, showing the state before industrialization and urbanization (Brůna et al. 2005; Skokanová et al. 2012). The maps were georeferenced in ArcGIS software (Esri 2012).
For the second time horizon, built-up areas were derived from maps of the so-called Third Military Mapping at a scale of 1:25 000 produced in the 1870s. In the third and fourth time horizons the extents of built-up areas were derived from orthophotos from the 1950s at scales of 1:18 000–1:26 000 and current orthophotos (year 2010) with a 1 m resolution. We applied on screen vectorization of built-up areas at a view scale of 1:200 with a minimum mapping unit of 15 m2. Because of various spatial resolutions of the used datasets we did not do spatial overlays of vector data and used the acquired data only to
evalu-ate the extent and pattern (see Table 1) of built-up areas in selected cadastres.
Data analysis. We used column standardization (Meloun & Militký 2004) of the pattern indicators (Table 1) by dividing them by the standard deviation (1).
yij = xij/sj (1)
where:
y – standardized data x – original data
sj – standard deviation
j – column i – row
To reveal similarities in urban development among the cadastres, we used Euclidean distance and par-titioning around medoids (PAM) cluster methods (Antoniadis & Gentleman 2003), a robust type of K-mean clustering (Ng & Han 2002). Spearman’s correlation coefficients were computed to reveal the relationships among the variables prior to cluster analysis, and highly correlated variables were omitted from the clustering – e.g. the length of the borders of the built-up areas which strongly correlated with the proportion of the built-up areas.
[image:3.595.65.291.112.219.2]Data processing and analysis were done using R soft-ware (The R foundation for statistical computing, 2011; R Studio, 2009–2012) with package "Clue" (Hornik & Böhm 2014).
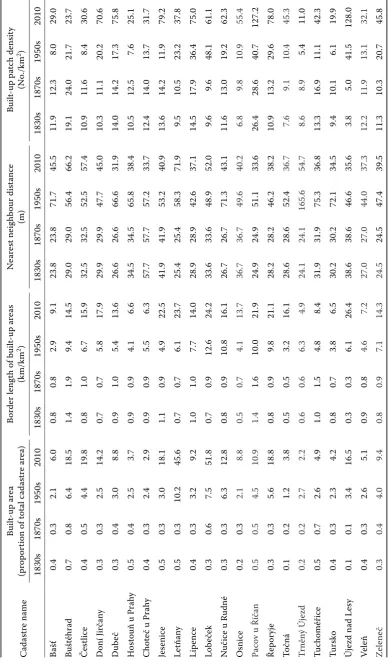
[image:3.595.67.470.491.759.2]Figure 1. Selected cadastres Table 1. Pattern indicators
Variable Units
Built-up patch density
(number of patches per km2) No./km2
Border length of built-up areas per km2 km/km2
Built-up area
(proportion within a cadastre) %
Nearest neighbour distance
ClValid R package (Brock et al. 2008) was used to select the optimal number of clusters. Almost 60% of variance among cadastres was explained with 5 clusters using PAM method.
RESULTS
The extent of built-up areas. The average extent of a built-up area increased from less than 1% to more than 13% per cadastre. The extent of built-up areas was very low in the 1830s, reaching only 0.5% of the total cadastre area for all cadastres. The Buštěhrad cadastre was the only exception, with a built up area proportion reaching 0.7% because it was a historical town with a castle. The differences among clusters were negligible (Table 2).
In the 1870s the extent of built-up areas was very similar and no significant expansion occurred. Be-cause of a low spatial resolution of the primary source of data this time horizon gives us only general infor-mation, however a significant built-up area expansion should have been recorded. The number of cadastres with a higher proportion of built-up areas increased slightly, but only in the Tuchoměřice and Lobeček cadastres the proportion exceeded 0.5%. In some cadastres a decrease of built-up areas was recorded, presumably due to a lower data resolution.
The cadastres started to diversify in the 1950s. The Buštěhrad cadastre still has had one of the highest proportions of built-up areas, but maximum values have been recorded in cadastres with industrial de-velopment such as Letňany and Lobeček. A mixture of residential and commercial development increased the proportions of built-up areas in the Řeporyje and Nučice cadastres. In contrast, the lowest proportion of built-up areas occurred in the Točná cadastre.
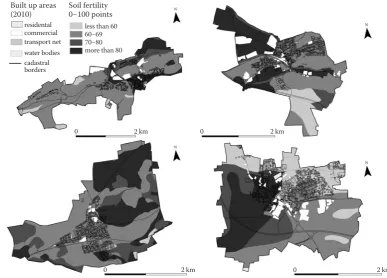
The extent of built-up areas continued to increase till 2010. Maximum values were recorded in the industri-alized cadastres Letňany and Lobeček (proportion of built-up area > 40%). Other cadastres with proportions between 15 to 20% differed in the form of development. Based on visual orthophotomaps interpretation, enor-mous commercial urban development was recorded for example in the Čestlice cadastre, while Jesenice cadastre showed mainly residential urban development. In the Řeporyje and Buštěhrad cadastres a mixture of both residential and commercial urban development has continued from the 1950s. The built-up area signifi-cantly increased in most cadastres, however, several cadastres, e.g. Točná, Trněný Újezd, and Choteč, did not show intensive development. There the proportion of built-up area remained below 4%.
[image:4.595.97.485.462.740.2]Pattern of built-up areas. The spatial structure of the built-up areas was described by the length of
Figure 2. Examples of the development of built-up areas in cadastres Nučice, Řeporyje, Jesenice and Zeleneč
Built up areas
(2010) Soil fertility 0−100 points
residental commercial transport net water bodies cadastral borders
less than 60 60−69 70−80 more than 80
0 2 km 0 2 km
Ta
ble 2. P
at ter n indic at or v alue s f or s ele ct ed c ad astr
es in c
ho
sen time hor
izons C ad astr e name Built -up ar ea (pr op or
tion of t
ot al c ad astr e ar ea) Bor der leng
th of built
-up ar ea s (k m/k m 2) Ne ar est neig hb our di st anc e (m) Built -up p at ch density (No./k m 2) 1830s 1870s 1950s 2010 1830s 1870s 1950s 2010 1830s 1870s 1950s 2010 1830s 1870s 1950s 2010 Ba šť 0.4 0.3 2.1 6.0 0.8 0.8 2.9 9.1 23.8 23.8 71.7 45.5 11.9 12.3 8.0 29.0 Bu št ěhrad 0.7 0.8 6.4 18.5 1.4 1.9 9.4 14.5 29.0 29.0 56.4 66.2 19.1 24.0 21.7 23.7 Čestlice 0.4 0.5 4.4 19.8 0.8 1.0 6.7 15.9 32.5 32.5 52.5 57.4 10.9 11.6 8.4 30.6 D oní J irč an y 0.3 0.3 2.5 14.2 0.7 0.7 5.8 17.9 29.9 29.9 47.7 45.0 10.3 11.1 20.2 70.6 D ub eč 0.3 0.4 3.0 8.8 0.9 1.0 5.4 13.6 26.6 26.6 66.6 31.9 14.0 14.2 17.3 75.8 H ost
ouň u Prah
y 0.5 0.4 2.5 3.7 0.9 0.9 4.1 6.6 34.5 34.5 65.8 38.4 10.5 12.5 7.6 25.1 C hot
eč u Prah
y 0.4 0.3 2.4 2.9 0.9 0.9 5.5 6.3 57.7 57.7 57.2 33.7 12.4 14.0 13.7 31.7 Je senic e 0.5 0.3 3.0 18.1 1.1 0.9 4.9 22.5 41.9 41.9 53.2 40.9 13.6 14.2 11.9 79.2 Le tňan y 0.5 0.3 10.2 45.6 0.7 0.7 6.1 23.7 25.4 25.4 58.3 71.9 9.5 10.5 23.2 37.8 Lip enc e 0.4 0.3 3.2 9.2 1.0 1.0 7.7 14.0 28.9 28.9 42.6 37.1 14.5 17.9 36.4 75.0 Lo be če k 0.3 0.6 7.5 51.8 0.7 0.9 12.6 24.2 33.6 33.6 48.9 52.0 9.6 9.6 48.1 61.1 N uč ic
e u R
borders, density of patches, and the nearest neigh-bour distances (Table 2). This extensive development changed the pattern of built-up areas from more compact to less compact built-up areas. An average nearest neighbour distance between built-up patches was increased by more than 38%.
The nearest neighbour distances and density of built-up patches were very variable over all analyzed time horizons. In some cadastres the nearest neigh-bour distance increased between the 1830s and 1950s but decreased till 2010, reflecting the sprawl of urban development in the first phase and infilling in the second phase. The continuously increasing value of the nearest neighbour distances in other cadastres, e.g. Letňany, Lobeček, Buštěhrad, and Čestlice (Table 3), show a continuous sprawl of the built-up areas.
In general, the length of the borders strongly cor-related with the extent of built-up areas (Table 2). However, some cadastres, e.g. Újezd nad Lesy and
Lipence, showed very high values of border length in 2010 despite the proportion of built-up areas being relatively low. This was mainly due to the presence of dispersed recreational properties. Edge length density (Table 2) showed significant changes over the whole study period, increasing from values less than 1 km/km2 up to an average of almost 15 km/km2.
[image:6.595.63.292.395.760.2]There were also significant changes in the den-sity of patches (Table 2). This indicator increased from 11 patches per km2 per cadastre on average in the 1830s up to 54 patches on average per km2 per cadastre in 2010; however, the variability among cadastres was high, ranging from 10 to more than 100 patches per 1 km2 per cadastre in 2010. This variable differentiated the set of cadastres mainly in the two last time periods (the 1950s and 2010). The highest values of patch density reflected the development of dispersed recreational properties (e.g. Újezd nad Lesy, Pacov u Říčan, Lipence), high
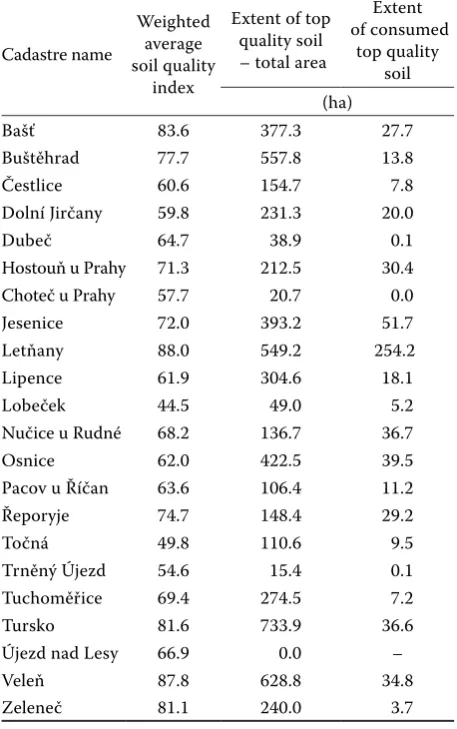
Table 3. Extent of top quality soil and area weighted average soil quality in the set of 22 cadastres
Cadastre name
Weighted average soil quality
index
Extent of top quality soil – total area
Extent of consumed
top quality soil (ha)
Bašť 83.6 377.3 27.7
Buštěhrad 77.7 557.8 13.8
Čestlice 60.6 154.7 7.8
Dolní Jirčany 59.8 231.3 20.0
Dubeč 64.7 38.9 0.1
Hostouň u Prahy 71.3 212.5 30.4
Choteč u Prahy 57.7 20.7 0.0
Jesenice 72.0 393.2 51.7
Letňany 88.0 549.2 254.2
Lipence 61.9 304.6 18.1
Lobeček 44.5 49.0 5.2
Nučice u Rudné 68.2 136.7 36.7
Osnice 62.0 422.5 39.5
Pacov u Říčan 63.6 106.4 11.2
Řeporyje 74.7 148.4 29.2
Točná 49.8 110.6 9.5
Trněný Újezd 54.6 15.4 0.1
Tuchoměřice 69.4 274.5 7.2
Tursko 81.6 733.9 36.6
Újezd nad Lesy 66.9 0.0 –
Veleň 87.8 628.8 34.8
Zeleneč 81.1 240.0 3.7
Table 4. Soil quality index ratio; the ratio of area weighted average soil quality index for built-up area and area weigh-ted average soil quality index of the whole cadastre times 100 to show whether lower (< 100) or higher (> 100) than average quality soils were consumed
Cadastre name 1830s 1870s 1950s 2010
Bašť 105 106 105 101
Buštěhrad 107 109 101 103
Čestlice 93 89 100 93
Doní Jirčany 98 91 96 89
Dubeč 95 92 99 98
Hostouň u Prahy 91 97 96 98
Choteč u Prahy 71 76 82 82
Jesenice 101 103 104 99
Letňany 100 100 100 100
Lipence 114 95 92 93
Lobeček 128 135 103 92
Nučice u Rudné 121 122 108 108
Osnice 98 93 96 100
Pacov u Říčan 98 102 100 102
Řeporyje 99 96 99 102
Točná 121 120 119 118
Trněný Újezd 119 118 107 107
Tuchoměřice 81 90 90 92
Tursko 103 103 102 103
Újezd nad Lesy 92 93 99 98
Veleň 101 101 101 101
[image:6.595.299.531.431.757.2]values were found in areas with massive residential developments (e.g. cadastres Jesenice, Řeporyje), and low values were typical for cadastres with large commercial areas (e.g. cadastres Letňany, Čestlice).
Quality of soils in built up areas. The extensive development caused a consumption of high quality soils. The top quality, most fertile soils of the Czech Republic occur in the north and north-east parts of the Prague periphery in the cadastres Letňany, Veleň, Bašť, and Tursko on loess Quaternary substrates, however, over 11% (637 ha) of them have been con-verted to built-up area (Table 3).
The ratio of the area weighted average soil quality index of the built-up area in each cadastre and the area weighted average soil quality index of the whole cadastre showed that soils of predominantly better than average quality within each cadastre were taken (Table 4, Figure 2). This happened even in the past. Generally, in more than one third of the cadastres urban expansion into agricultural surroundings has led to the consumption of above-average quality soils. A different development of built up areas, presumably reflecting different territorial planning attitudes, is
shown in Figure 2. In the Zeleneč cadastre, the most fertile soils were protected. Opposite to that, top quality soils were extensively taken near the Prague ring road in cadastres in the southern part of Prague (Figure 2, Tables 3 and 4).
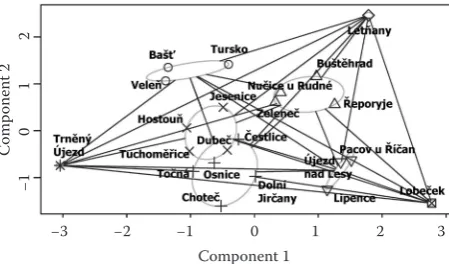
Similarities and differences in urban development among cadastres. Clustering was based on param-eters listed in Table 1 and the cadastral area weighted average soil quality index. The analysis showed the increasing role of pattern of built-up areas in cluster-ing. In the first and second time horizons the clusters were defined mainly by soil quality, because the extent of built-up area was quite similar among cadastres (Figures 3 and 4). Some cadastres were separated due to their slightly higher proportion of built-up areas, less compact built-up areas, and the high density of patches (Figure 3). The compactness of built-up area was influenced for example by the presence of mills and sawmills in some cadastres (e.g. Choteč and Újezd nad Lesy). Since 1950s the similarities among clusters have predominantly been based on the extent of the built-up area and its pattern (Figures 5 and 6), however the clustering has remained sensitive to soil quality.
Component 1
Com
ponen
t 2
−3 −2 −1 0 1 2
[image:7.595.64.294.92.226.2]−1 0 1 2 3
Figure 3. Cluster plot from the 1830s (two components explain 81.5% of the object variability)
Figure 6. The current orphotomap (2010) cluster plot (two components explain 75.2% of the object variability)
Component 1
−3 −2 −1 0 1 2 3
Com
ponen
t 2
[image:7.595.301.534.94.224.2]−2 −1 0 1
Figure 4. Cluster plot from the 1870s (two components explain 72.5% of the object variability)
Figure 5. The 1950s cluster plot (two components explain 72.6% of the object variability)
Component 1
−3 −2 −1 0 1 2 3
Com
ponen
t 2
−1 0 1 2
Component 1
−4 −3 −2 −1 0 1
Com
ponen
t 2
[image:7.595.65.290.594.726.2] [image:7.595.294.530.596.726.2]DISCUSSION
Our research into the soil consumption and pattern of built-up areas in the Prague periphery since the 19th century driven by urban development in selected cadastres has resulted in a new empirical knowledge. The average extent of built-up areas increased from less than 0.5% in the 1830s to more than 13% in 2010. In some cadastres the proportion of built-up area reached 50% in 2010. The intensive development of urban areas has been studied elsewhere in Europe and other countries in the USA or Asia (Imhoff et al. 1997; Uhel 2006; Zhang etal. 2007; Salvati 2013; Xiao et al. 2013) and it was proved that sprawling urban areas tend to consume the best agricultural lands (Nizeyimana et al. 2001; Imhoff et al. 2003; Uhel 2006; Salvati et al. 2013), forcing agriculture to move to less productive areas. Results of this study are in line with published research. In nearly half of the selected cadastres the built-up areas consumed high quality soils (more than 70 points). The qual-ity of the consumed soils was increasing in nearly half of the cadastres between time horizons. Only in 9 out of 22 cadastres the built-up areas expansion avoided the above-average quality soils. In most of the cadastres, sprawling consumed the best quality soils within the cadastre and even some best qual-ity soils nationwide. This was the case of e.g. the Letňany cadastre, where there was no soil of lower quality available for development. Generally, the cadastres along the newly built Prague ring road (Jesenice, Osnice) experienced the most intensive development on protected soils. This implies that favourable logistics positions put high pressure on fertile and even protected soils. In such a case lo-cal territorial planning should play a crucial role in effective soil protection. Conway and Lathrop (2005) and Pichler-Milanović (2007) suggested that fertile soil needs to be distinguish at the local level and then it can be effectively protected at higher administrative levels. The building up of high quality soils should be avoided, as these soils perform several crucial functions which make them environmentally, economically, and socially important.
An example of a strong protection of the best quality soils is in Slovakia, where they are protected by very high compensation payments for withdrawal of land from the agricultural land resources. For comparison, compensation payments for withdrawal of one hectare of the best quality soil is about 52 000 € in the Czech Republic whereas 200 000 € in Slovakia (Act No. 220
2004 Coll.). On the other hand, only about one fifth of the agricultural soil resources is protected by such high compensation payments in Slovakia (Prokop et al. 2011). Lower payments make soil protection in the Czech Republic very difficult, but the most effective tool for soil protection is territory planning. Territory planning should be an integrative process of natural resource and landscape protection and urban development (Schetke et al. 2012).
CONCLUSION
The results point to the extensive development of built-up areas that caused consumption of high quality soils and changed the pattern of built-up areas from more to less compact. The process of spreading urban areas into agriculture landscape is an inherent process of town/city development and Prague periphery belongs to the most exposed regions in the Czech Republic, however the building up of high quality soil should be avoided to maintain its crucial functions and services.
Acknowledgements. This research was supported by the Grant No. SVV-244-267-202 (Department of Physical Geography and Geoecology, Faculty of Science, Charles University in Prague) and by the institutional resources of the Ministry of Education, Youth and Sports of the Czech Republic for the support of science and research. We also greatly thank all the institutions providing us with data, na-mely the National Archives, the Research Institute for Soil and Water Conservation, and the Research Institute of Sylva Tarouca for Landscape and Ornamental Gardening.
References
Antoniadis A., Gentleman R. (2003): Lab 5: Cluster Analysis using R and Bioconductor. Milano. Available at https:// www.bioconductor.org/help/course-materials/2003/Mi-lan/PDF/Lab5.pdf
Antrop M. (2000): Background concepts for integrated landscape analysis. Agriculture, Ecosystems and Environ-ment, 77: 17–28.
Bičík I. et al. (2010): Development of land-use in Czechia. Prague, Czech Geographical Society: 47–54. (in Czech) Brock G., Pihur V., Datta S., Datta S. (2008): clValid: an R package for cluster validation. Journal of Statistical Software, 25: 1–22.
CEC (2006): Thematic Strategy for Soil Protection. Brusel. Available at http://eur-lex.europa.eu/legal-content/EN/ TXT/PDF/?uri=CELEX:52006DC0231&from=EN Chen J. (2007): Rapid urbanization in China: A real
chal-lenge to soil protection and food security. Catena, 69: 1–15.
Chuman T., Romportl D. (2011): Commercial suburbani-zation. In: Ouředníček M., Temelová J., Pospíšilová L. (eds): Atlas of Socio-spatial Differentiation of the Czech Republic. Prague, Karolinum.
Conway T.M., Lathrop R.G. (2005): Alternative land use regulations and environmental impacts: assessing future land use in an urbanizing watershed. Landscape and Urban Planning, 71: 1–15.
Czech Statistical Office (2013): Public Municipality Da-tabase. Available at https://vdb.czso.cz/mos/ (accessed June 12, 2013).
EEA (2010): The European Environment State and Outlook: Soil. Available at www.eea.europa.eu/soer/europe/soil/ download (accessed June 12, 2013).
Esri (2012): ArcGIS Ver. 10.1. Redwood, Esri. Retrieved from CD-ROM
Gayda S. et al. (2005): SCATTER: Sprawling Cities and Transport: from Evalutation to Recommendations [Final Report.] Centre for Advanced Spatial Analysis, University College London, London.
Haase D. (2009): Effects of urbanisation on the water bal-ance – A long-term trajectory. Environmental Impact Assessment Review, 29: 211–219.
Hornik K., Böhm W. (2014): Package “Clue”. Available at https://cran.r-project.org/web/packages/clue/clue.pdf (accessed Dec 4, 2014).
Imhoff M. et al. (1997): Using nighttime DMSP/OLS images of city lights to estimate the impact of urban land use on soil resources in the United States. Remote Sensing of Environment, 59: 105–117.
Imhoff M.L., Lawrence W.T., Stutzer D., Elvidge C. (2003): Assessing the Impact of Urban Sprawl on Soil Resources in the United States Using Nighttime “City Lights” Satellite Images and Digital Soils Maps. Available at http://land-cover.usgs.gov/luhna/chap3.php (accessed Feb 2, 2014). Institute for Ecology of Urban Areas (2010): CircUse.
Avail-able at http://www.circuse.eu (accessed Mar 2, 2012). Kasanko M., Barredo J.I., Lavalle C., McCormick N.,
Demi-cheli L., Sagris V., Brezger A. (2006): Are European cities becoming dispersed? Landscape and Urban Planning, 77: 111–130.
Kibblewhite M.G., Miko L., Montanarella L. (2012): Legal frameworks for soil protection: current development and technical information requirements. Current Opinion in Environmental Sustainability, 4: 573–577.
Koželouh J. (2010): Environmental Impacts of Spatial Ex-pansion of Large Scale Retail in the Czech Republic in 2003–2009, Research Results. Brno, Nezávislé sociálně ekologické hnutí – Nesehnutí. Available at http://hyper. cz/soubory/vyzkum%202003-2009.pdf (in Czech) Kupková L. (2011): Land-use. In: Ouředníček M.,
Te-melová J., Pospíšilová L. (eds): Atlas of Socio-spatial Differentiation of the Czech Republic. Prague, Karolinum. Meloun M., Militký J. (2004): Statistical Analysis of
Experi-mental Data. Praha, Academia. (in Czech)
Němeček J., Mašát K., Džatko M. (1985): System of Point Valuation of Productivity of BPEJ. Prague, RISWC. (in Czech)
Ng R.T., Han J. (2002): CLARANS: a method for clustering objects for spatial data mining. IEEE Transactions on Knowledge and Data Engineering, 14: 1003–1016. Nizeyimana E.L., Petersen G.W., Imhoff M.L., Sinclair H.R.,
Waltman S.W., Reed-Margetan D.S., Russo J.M. (2001): Assessing the impact of land conversion to urban use on soils with different productivity levels in the USA. Soil Science Society of America Journal, 65: 391.
Ouředníček M. et al. (2008–2014): Suburbanization – Czech Republic. Available at http://www.suburbanizace.cz (ac-cessed Feb 10, 2013). (in Czech)
Ouředníček M., Temelová J., Pospíšilová L. (eds) (2011): Atlas of Socio-spatial Differentiation of the Czech Re-public. Prague, Karolinum.
Pauleit S., Ennos R., Golding Y. (2005): Modelling the en-vironmental impacts of urban land use and land cover change—a study in Merseyside, UK. Landscape and Ur-ban Planning, 71: 295–310.
Pauleit S., Bell S., Aalbers C., Nielsen T.A.S. (eds) (2013): Peri-urban Features: Scenarios and Models for Land Use Change in Europe. Heidelberg, Springer.
Pichler-Milanović N. (2007): European urban sprawl: sus-tainability, cultures of (anti) urbanism and “hybrid city-scapes”. Dela, 27: 101–133.
Plurel (2010): Rural – Urban Regions and Peri-urbanisation in Europe: Towards a European Policy to Sustain Urban-Rural Futures. Copenhagen. Available at http://www. plurel.net/images/Peri_Urbanisation_in_Europe_print-version.pdf
Prokop G., Jobstmann H., Schönbauer A. (2011): Overview of best practices for limiting soil sealing and mitigating its effects in EU-27. European Communities, 227. Lux-embourg, Publications Office.
R foundation for statistical computing (2011): R version 2.13.2. Available at http://mirrors.nic.cz/R/ (accessed July 30, 2013).
Roakes S.L. (1996): Reconsidering land value taxation. Land Use Policy, 13: 261–272.
Roose A., Kull A., Gauk M., Tali T. (2013): Land use policy shocks in the post-communist urban fringe: A case study of Estonia. Land Use Policy, 30: 76–83.
Salvati L. (2013): Monitoring high-quality soil consumption driven by urban pressure in a growing city (Rome, Italy). Cities, 31: 349–356.
Salvati L., Sateriano A., Bajocco S. (2013): To grow or to sprawl? Land cover relationships in a Mediterranean city region and implications for land use management. Cities, 30: 113–121.
Scalenghe R., Marsan F.A. (2009): The anthropogenic seal-ing of soils in urban areas. Landscape and Urban Plan-ning, 90: 1–10.
Schetke S., Haase D., Kötter T. (2012): Towards sustainable settlement growth: A new multi-criteria assessment for implementing environmental targets into strategic urban planning. Environmental Impact Assessment Review, 32: 195–210.
Skokanová H., Havlíček M., Borovec R., Demek J., Eremiášová R., Chrudina Z., Svoboda J. (2012): Develop-ment of land use and main land use change processes in
the period 1836–2006: case study in the Czech Republic. Journal of Maps, 8: 88–96.
Spilková J., Šefrna L. (2010): Uncoordinated new retail de-velopment and its impact on land use and soils: A pilot study on the urban fringe of Prague, Czech Republic. Landscape and Urban Planning, 94: 141–148.
Sýkora L. (ed.) (2002): Suburbanization and its Consequen-ses. Prague, Ústav pro ekopolitiku. (in Czech)
Torrens P.M., Alberti M. (2000): Measuring Sprawl. CASA Working Paper 27. Centre for Advanced Spatial Analysis, University College London, London.
Uhel R. (ed.) (2006): Urban Sprawl in Europe: the Ignored Challenge. EAA Report No.10/2006, Copenhagen, Euro-pean Environment Agency.
Xiao R., Su S., Zhang Z., Qi J., Jiang D., Wu J. (2013): Dy-namics of soil sealing and soil landscape patterns under rapid urbanization. Catena, 109: 1–12.
Zhang X., Chen J., Tan M., Sun Y. (2007): Assessing the impact of urban sprawl on soil resources of Nanjing city using satellite images and digital soil databases. Catena, 69: 16–30.
Received for publication September 9, 2014 Accepted after corrections April 21, 2015
Corresponding author: