© Department of Mechanical Engineering, Forli. All rights reserved FME Transactions (2018) 46, 230-237 230
Received: March 2017, Accepted: December 2017 Correspondence to: Navid Zarif Karimi, Department of Industrial Engineering, Alma Mater Studiorum University of Bologna, Italy
E-mail: navid.zarif@unibo.it
doi:10.5937/fmet1802230S
S. Sadeghi Research Assistant Amirkabir University of Technology Department of Mechanical Engineering Iran
N. Zarif Karimi Research Assistant University of Bologna Department of Industrial Engineering Italy
M. Fotouhi Research Assistant University of Bristol Department of Aerospace Engineering UK
M. Hasani Research Assistant Amirkabir University of Technology Department of Mechanical Engineering Iran
M. Ahmadi Najafabadi Associate Professor Amirkabir University of Technology Department of Mechanical Engineering Iran
A. Pavlovic Adjunct Professor University of Bologna Department of Mechanical Engineering Italy
Residual Stress Evaluation in Friction
Stir Welding of Aluminum Plates by
Means of Acoustic Emission and
Ultrasonic Waves
The residual stress assessment in structures is essential for optimization of the structures’ design. The attention of this paper is focused on how acoustic emission signals caused by tensile loading of the friction stir welded aluminum plates are expected to vary depending upon the residual stress. To this aim, the distribution of residual stresses in two friction stir welded aluminum specimens was firstly evaluated by ultrasonic stress measurement. AE signals were then produced during tensile tests and captured using AE sensors. The obtained AE signals were analyzed using statistical features including crest factor, cumulative crest factor and sentry function. It was found that the crest factor could be used to identify the presence of the residual stresses and that the trends of sentry function are in good agreement with the results of crest factor and cumulative crest factor.
Keywords: Residual stress, Acoustic emission, Ultrasonic Stress Measurement, Sentry function, Crest factor, friction stir welding.
1. INTRODUCTION
Residual stresses are described as the self-balanced stresses inside the material after a manufacturing process, in the absence of any thermal gradients or external loads [1]. Friction stir welding (FSW) is a solid state welding process introduced in 1991 at TWI, in which a pin serves as a rotating tool and is embedded into the adjoining edges of the plates to be welded with a pre-defined tilt angle [2-4]. This manufacturing procedure is considered in many advanced engineering fields, ranging from aerospace [5] to railway and shipbuilding industry, where the strength and plastic properties of FSW welded specimens might be signifi– cantly higher than MIG and TIG welded [6].
Over the years, different methods have been suggested to measure residual stress for both fusion and solid state welding processes in order to obtain rea– sonable assessments of its value. These methods can be divided into three main categories: destructive, semi-destructive and non-semi-destructive methods.
The destructive and semi-destructive techniques are founded on measuring the deformations produced by releasing residual stresses upon material removal from the workpiece. The hole-drilling method is one of the
most effective methods providing good reliability and accuracy for stress measurement. Primarily applied by Mathar in 1934 [7], this technique is standardized by ASTM: E837 [8-10] and the majority of studies have extensively employed it to validate other stress measurement methods [11,12].
Non-destructive evaluation of residual stresses is an essential step in the design of structures as well as estimation of their reliability under real service con– ditions. Non-destructive methods involving X-ray dif– fraction, neutron diffraction and ultrasonic technique often measure some parameter that is associated with the stress. The development of such techniques accom– panied by semi-destructive methods like incremental hole-drilling technique is appropriate for stress measu– rement and health monitoring of the instruments.
1.1 Acoustic Emission Method
FME Transactions VOL. 46, No 2, 2018 ▪ 231
yield strength, AE is largely occurred by rapid surmount of dislocation density [14-17].
Studies conducted on acoustic emission have shown that AE has a high potential in the investigation of the material behavior. Kaiser [15] evidently demonstrated that internal stress wave generation is a widely occurring phenomenon and acoustic emission is basi– cally related to deformation. Tatro [18] and Schofield [19] developed the work of Kaiser through compre– hensive studies of the relation between AE and defor– mation in distinct materials.
Moreover, in the past decades, several studies have been carried out on the signal analysis of acoustic emission in the material subjected to stress. Sedek et al. made use of AE signals for monitoring the reduction of residual stresses in a pressure vessel using RMS value confirming that this parameter can be used for eva– luating the variation of the stresses inside the material [20]. Venkitakrishnan et al. utilized the acoustic emis– sion technique for analysis of residual stress change due to secondary processes [21]. By using acoustic sensors and feature extraction, Shao et al. could identify laser-induced thermal damage in metallic materials. In order to de-noise the acoustic signals, they exploited the en– semble empirical mode decomposition (EEMD) method [22]. Newman used AE to predict fatigue crack growth of friction stir welded joints of aluminum, validating a research scope similar to the present work [23]. Additionally, there are some studies which employed AE as an online method to investigate the crack beha–vior and the fracture toughness of the specimens [24,25].
1.2 Ultrasonic Stress Measurement
There is a linear relationship between the velocity of the ultrasonic wave and the stresses inside the material in the ultrasonic stress measurement. This correlation in the elastic limit is called acoustoelastic effect and shows that flight time of the ultrasonic wave changes linearly with the stress inside the material. The applicability of acoustoelastic effect for measurement of stress was indicated by Crecraft [26]. The longitudinal waves propagated parallel to the surface are called longitudinal critically refracted (LCR) waves and Egle and Bray demonstrated that the LCR waves have the highest sensitivity to the material stress [27]. Furthermore, Sadeghi et al. [28] investigated longitudinal residual stress distribution through the thickness of 5086 alu– minum plates welded by friction stir welding. In their study, four different frequencies of ultrasonic trans– ducers were employed so as to analyze the stresses within different depths of the material.
Although there have been many researches in the residual stress analysis in friction stir welding emp– loying FEM, there has been no attempt so far to investigate the aforementioned issue using acoustic emission technique. The main goal of this study is a feasibility study for evaluation of the residual stresses produced by friction stir welding by AE and ultrasonic stress measurement. Therefore, the ultrasonic method was firstly employed to measure the longitudinal residual stress in the FSW joint using the LCR waves. The results obtained by the ultrasonic stress measu–
rement were then verified by employing the hole-drilling standard technique. Additionally, acoustic emi– ssion technique was employed to investigate the validated residual stress obtained by ultrasonic method. The methods of sentry function, crest factor and cumulative crest factor were applied in order to analyze the longitudinal residual stress in FSW.
It was concluded that the AE investigation and LCR can be used as nondestructive methods for evaluation of longitudinal residual stresses of aluminum plates joined by friction stir welding and a good agreement was achieved between the results. It was also found that the AE features including crest factor, cumulative crest factor and sentry function can identify the stress severity of the friction stir welded specimens.
2. THEORETICAL BACKGROUND
2.1 LCR method
The residual stresses measurements using LCR waves could be conducted with various ultrasonic setups. As it is usual in experimental configurations, transmitter transducer supplies longitudinal waves at the first critical angle parallel to surface of a material, then two transducers detect the waves. According to (1), Egle and Bray [27] presented the relationship between the relevant uniaxial stress and the change in the measured time-of-flight of the wave to be:
0 0
( )
E t t t L σ
Δ = − (1)
In (1), Δσ is variations of stress, L is the acous– toelastic coefficient for LCR wave propagated parallel to the stress considered and E is the elastic modulus. Furthermore, t is the time-of-flight measured experi– mentally on the tested sample; t0 is time-of-flight for stress-free and isotropic sample at the environment temperature. Further details about LCR can be found in some literatures [29-31]. The acoustoelastic coefficient is measured by uniaxial tensile test carried out on the specimens cut from the examined workpiece. In a fixed distance between transducers, the time-of-flight of the
LCR wave rises in presence of tensile stress and decreases due to compressive stress. Finally, by mea– surement of the acoustoelastic constant and the variation in the time-of-flight induced by the welding, the welding residual stresses can be determined.
2.2 Sentry function
232 ▪ VOL. 46, No 2, 2018 FME Transactions
that integrates both the mechanical and acoustic energy information [32,33] is utilized. This function is called sentry function and is indicated in terms of the logarithm of the ratio between the strain energy (E) and the acoustic energy (Eas), as shown in (2), where x is the test driving variable in the form of strain or displacement.
( ) ( )
( ) as E x f x Ln
E x
⎡ ⎤
= ⎢ ⎥
⎣ ⎦ (2)
2.3. Crest Factor
Most of the previous researches focused on the stati– stical features extracted from the AE signals involving energy, standard deviation, duration and counts [34-36], but higher order statistical features such as kurtosis and crest factor have been recently applied for condition monitoring in rotating machinery [37-38]. These features are good indicators to detect structural damage and engi– neering faults [39].One of statistical features employed in this work is crest factor using RMS and energy.
The crest factor is known as the ratio of peak amplitude of the signal over the RMS in which RMS is the second statistical moment used as a measure of the energy of a signal. It should be noticed that the RMS has a direct proportionality to the amount of energy of the signal, meaning that to signals with higher peak amplitude a higher crest factor is attributed.
In this work, AE technique using two methods of sentry function and crest factor are employed to inves– tigate the residual stress behavior of two friction stir welded specimens with dissimilar welding conditions.
3. EXPERIMENTAL DETAILS
The process parameters of FSW include feed rate, rotational speed, pin diameter and shoulder diameter. The samples S1 and S2 are manufactured by FSW process joining two 150×100×8 mm plates made from 5086 aluminum. The selected welding parameters for the samples are listed in Table 1.
The FSW tool is made from H13 tool steel while the FSW process is accomplished by using a vertical milling machine.
[image:3.595.314.540.273.326.2]During the FSW process, steel fixture is used to clamp the specimens at its sides and a back plate is employed to support bottom of the specimens (as shown in Figure 1).
Figure 1. Friction stir welding of aluminum plates.
The measurement devices, shown in Figure 2, includes ultrasonic software, ultrasonic box with sample
[image:3.595.314.541.510.601.2]rate of 100 MHz and equipments for time-of-flight measuring. The automatic table is assisted by 3 step motors to be able to move the transducers in 3 axes with resolution of 1 μm. The laser cutting and CNC milling are utilized to create the wedge from poly methyl methacrylate (PMMA) material, under the trademark Plexiglas which helps the distance between the mentioned probes to be kept constant. A simple setup based on three transducers is employed for the residual stress measurement and the frequency of 5 MHz is exploited for the probes in order to generate waves at surface of the material. Moreover, the plastic screws exert a constant pressure on the transducers and a couplant layer between the transducer and the wedge help measurement of the longitudinal residual stress to be more accurate.
Table 1. Selected parameters for friction stir welding of two specimens.
Sample #
Rotation (rpm)
Feed rate (mm/min)
Pin diameter
(mm)
Shoulder diameter (mm) S1 400 100 8 20 S2 800 12 6 24 3.1 Measurement devices for ultrasonic stress
measurement
The standard uniaxial tensile test is used to investigate the acoustoelastic coefficient based on the other form of (1) as follows:
0 0
( )
E
L t t
t σ
= −
× Δ (3)
Locating the TOF measurement devices on the tensile test specimens (which are cut from the work– piece in accordance with the Sheet type sample in ASTM: E8 standard), makes possible the measurement of the time-of-flight (t) of the LCR wave.
Figure 2. LCR Measurement devices.
[image:3.595.58.284.630.733.2]FME Transactions VOL. 46, No 2, 2018 ▪ 233
Table 2. Acoustoelastic coefficient in weld metal and PM in the specimens.
Sample
# Material Parent (PM)
Weld Zone (FSW)
1 3.2 4.17 2 3.2 4.01 3.2 Hole-drilling measurement to validate ultrasonic
stress measurement
[image:4.595.313.537.133.311.2]Since using LCR waves for stress measurement is still regarded as a method under development, another stress measurement technique such as the hole-drilling method (according to the ASTM: E837) can be taken on to verify the ultrasonic stress measurement results. In this paper, 3 points are considered for this semi-destructive technique. The first strain gauge is located in the weld centerline and the two others are attached on the distance of 15 and 30 mm from the weld centerline (as shown in Figure 3). The hole-drilling method is based on measuring the strains released by the incremental drilling of a hole with 1.78 mm diameter and 2 mm depth using strain gauge rosette and the biaxial stress field is then computed employing equations established by ASTM: E837 [40-41].
Figure 3. Hole-drilling setup for friction stir welding of aluminum plates.
3.3 AE devices
AE events were achieved by using Acoustic emission software (AEWin) along with a data acquisition system Physical Acoustics Corporation (PAC) PCI-2 with a maximum sampling rate of 40 MHz. PICO which is a broadband, resonant-type and single-crystal piezoelectric transducer from PAC was employed as the AE sensor. The sensor contains a resonance frequency of 453.12 kHz with the optimum operating range of 100–750 kHz. In order to provide good acoustic coupling between the sensor and specimen, grease was employed as a cover for the surface of the sensor. The signal was detected by the sensor and enhanced by a 2/4/6-AST preamplifier. The gain selector of the preamplifier was set to 40 dB while the test sampling rate was 1 MHz with 16 bits of resolution between 10 and 100 dB. Prior to starting experiments, the data acquisition system was calibrated in accordance with pencil lead break procedure. This procedure enables the generation of waves at the specimen surface that are used for the device calibration. At the same time, the velocity and attenuation of the AE waves were measured several times at different locations between
the sensors. Afterward, AE signals were captured during tensile test while signal descriptors such as amplitude, rise time, duration, counts, and energy were computed by the AE software (AEWin). Figure 4 shows the AE equipment needed for recording AE events during tensile test.
Figure 4. AE devices in tensile test.
[image:4.595.57.283.359.460.2]4. RESULTS AND DISCUSSION
Figure 5 shows the longitudinal residual stress measured by the ultrasonic method in samples S1 and S2. It can be clearly seen that the sample S1 has higher longitudinal residual stress compared to the sample S2. In fact, the maximum residual stress value is 64.7 MPa in the sample S1 while this value is 45.3 MPa in the sample S2. In addition, the residual stress peak has occurred at the advancing side (AS) of the welding zone for both samples due to the non-symmetric temperature distribution and also more material flow occurring at the AS compared to retreating side (RS) which lead to higher residual stress at AS.
Figure 5. Longitudinal residual stress measured by ultrasonic method on samples S1-S2.
[image:4.595.313.539.508.671.2]234 ▪ VOL. 46, No 2, 2018 FME Transactions
[image:5.595.61.284.98.234.2]in the distance of 0, 15 and 30 mm from the weld centerline, respectively which indicates the agreement between the achieved results.
Figure 6. Verification of the ultrasonic stress measurement by the hole-drilling method on sample S1.
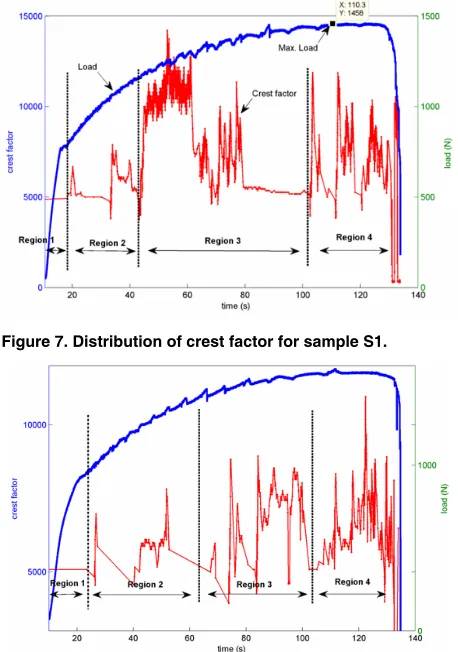
[image:5.595.56.285.364.690.2]In order to introduce an online method for evaluation of the residual stress, the specimens were analysed by AE features. In fact, the effect of residual stress intensity on AE behavior of the welded com– ponents is investigated when subjected to tensile load. Figure 7 and Figure 8 show the crest factor distribution of the resultant AE signals captured by the AE trans– ducers during the tests for the samples S1 and S2.
Figure 7. Distribution of crest factor for sample S1.
Figure 8. Distribution of crest factor for sample S2.
It can be observed from Figure 7 and Figure 8 that the crest factor distribution could be divided into 4 regions. These regions are as follows:
Region 1 (Elastic deformation): This region is associated with the elastic portion of the load-time diagram where the exerted stress is lower than the yield
stress. At this step, when the applied stress is removed, the material will deform elastically and will return to its actual shape. As a consequence, it is clear that only some weak AE signals exist in this region. The AE behavior indicates that there are no substantial active microstructural defects in the specimens as the result of the applied load.
Region 2 (uniform plastic deformation): When the yield point is passed, some fraction of the deformation will be non-reversible. The physical mechanisms that lead to plastic deformation in the specimens are commonly consequence of dislocations. The tensile loading applied to the sample will cause it to behave in an elastic form. However, once the load exceeds thres– hold (the yield strength), the deformation rises more rapidly in uniform plastic deformation region compared to the elastic region. During tensile deformation, the material shows strain hardening in which the amount of hardening varies with extension of deformation. At the start of the first region, the strain hardening effect is negligible. This fact can be identified by the uniform appearance of the AE signals with lower crest factor in comparison with the AE signals in region 3.
Region 3 (strain hardening): In this region, the plastic deformation causes the specimens to strengthen. This strengthening occurs mostly due to the dislocation movements and dislocation generation within the crystal structure of the sample. At region 3, where the loading takes place, a significant increase of crest factor value is noticed for the specimens.
Region 4 (non-uniform plastic deformation, necking): Necking event arises in this region while there are comparatively large amounts of strain localized in a small zone of the specimens. It should be noted that before deformation, the specimens have heterogeneities such as local variations or flaws in dimensions or com– position that result in local fluctuations in stresses and strains. Furthermore, a considerable increase in crest factor is discerned in region 4 while these peaks in the crest factor could be a signal for existence of different events in this region.
The maximum load values of the specimens can be observed in Figures 7 and 8. It is noticeable that maximum load in sample S2 is higher than peak load in sample S1 which could be justified by the presence of different level of the residual stress in the specimens.
According to the results of ultrasonic stress measurement, the sample S2 has lower residual stress than sample S1 due to the dissimilar welding parameters. As can be seen from Figures 7 and 8, distribution of the crest factor is different in the mentioned regions of the specimens. In the case of sample S2, the value of the crest factor increases uniformly during region 3, but there is a burst type appearance of the crest factor for sample S1 in this region. In region 4, there is a uniform increasing trend in the crest factor value for sample S2, whereas in sample S1 this trend is not uniform. Other interesting differences between the AE behaviors of the specimens could be noted by illustrating the cumulative crest factor plot.
FME Transactions VOL. 46, No 2, 2018 ▪ 235
[image:6.595.58.284.228.392.2]trends of the crest factor plots, but the slope changes are varying significantly for the specimens. In fact, for the sample S2, the first slope gradually increases and this trend does not change until the final failure. In addition, the slope of the second line is greater than the slope of the first line. The slope variation in sample S1 has completely opposed trend, meaning that there is an abrupt increase in the slope of the first line while there is a decreasing trend in the slope of the second line. Therefore, the cumulative crest factor behavior for the specimens with high and low residual stress varies significantly: this could therefore be employed as an appropriate indicator for representing the residual stress intensity.
[image:6.595.315.537.316.475.2]Figure 9. Cumulative crest factor Distribution for sample S1
Figure 10. Distribution of cumulative crest factor for sample S2.
Another method for investigation of the residual stress using AE is plotting the sentry function trends for the specimens. As previously discussed, the sentry fun– ction combines the strain energy i.e., the mechanical energy determined by using the load-displacement diag– ram, and the cumulative AE energy which is considered as the summation of the AE event energy. The results of the sentry function trends obtained for the samples S1 and S2 are shown in Figure 11 and 12, respectively.
It could be seen from Figure 11 and Figure 12 that the sentry function diagram shows some drops, but one of them is dominant compared to the other ones. In fact, the major drop of the sentry function in sample S2 is lower than sample S1. In addition, there is decreasing
trend in the sentry function diagram of sample S1 after the major drop, while an increasing trend is observed in sample S2 after the sudden drop. This means that the sentry function trend is a practical technique to predict the severity of the residual stress as its results are in good agreement with the results obtained by ultrasonic method. This is due to the fact that the variation in the amount of residual stress leads to releasing of the strain energy, different defects and also dislocation in the microstructure of the specimens that generates an AE event with energy content. Therefore, different AE behavior would be possible depending upon magnitude of welding residual stress. Additionally, it should be noted that the sentry function trend is in a good agreement with the trends of crest factor and cumulative crest factor diagrams. Since it is possible to employ the crest factor and sentry function trends online during loading, it would be very helpful for investigation of structures under their designed loading in order to prevent undesired failures. Hence, all mentioned AE methods can be a good tool for evaluation of different levels of residual stress in friction stir welding.
Figure 11. Sentry function trend for sample S1.
Figure 12. Sentry function trend for sample S2.
5. CONCLUSIONS
[image:6.595.315.535.318.647.2] [image:6.595.61.282.411.584.2]236 ▪ VOL. 46, No 2, 2018 FME Transactions
specimens were then exposed to the tensile stress test while the AE signals were stored simultaneously and then analyzed. Based on the obtained results, it can be concluded that:
1- The crest factor of the AE signals could be employed to identify the presence of the different levels of residual stress in the specimens during the loading. Since it is possible to see the crest factor trends online, it would be obviously helpful to use their variations as an alarm to prevent undesired failures caused by residual stress.
2- The ultrasonic stress measurement can be an effective nondestructive testing method for measu– rement of residual stress in friction stir welding, but AE has some benefits in comparison with this method, such as ability of evaluating the structures during loading. The comparison between the ultra– sonic and AE results showed an acceptable agree– ment; hence, the different levels of residual stress can be determined from the measured AE signals. Finally, it can be concluded that the AE investi– gation could be used as an online nondestructive method for in-situ monitoring of residual stresses intensity in real structures which are produced by friction stir welding.
REFERENCES
[1] Xu, S. and Zhao, Y.: Using FEM to determine the thermo-mechanical stress in tube to tube–sheet joint for the SCC failure analysis, Eng Fail Anal, Vol. 20, No. 5, pp. 24-34, 2013.
[2] Guerra, M., Schmidt, C., McClure, J.C., Murr, L.E. and Nunes, A.C.: Flow patterns during friction stir welding, Mater Charact, Vol. 49, pp. 95–101, 2002. [3] Liu, H.J., Fujii, H., Maeda, M. and Nogi, K.:
Tensile properties and fracture locations of friction-stir-wel–ded joints of 2017-T351 aluminium alloy, J Mater Process Technol, Vol. 142, pp. 692–696, 2003.
[4] Rhodes, C.G., Mahoney, M.W., Bingel, W.H., Spurling, R.A. and Bampton., C.C.: Effects of friction stir welding on microstructure of 7075 aluminum, Scr Mater, Vol. 31, pp. 69–75, 1997. [5] Boldsaikhan E. et al.: Refill Friction Stir Spot
Joining for Aerospace Aluminum Alloys. In: Hovanski Y., Mishra R., Sato Y., Upadhyay P., Yan D. (eds) Friction Stir Welding and Processing IX. The Minerals, Metals & Materials Series. Springer, 2017.
[6] Gesella, G. and Czechowski, M.: The application of friction stir welding (FSW) of alluminum alloys in shipbuilding and railway industry, J of KONES Powertrain and Transp, Vol. 24, No.2, pp.85-90, 2017.
[7] Mathar, J.: Determination of initial stresses by measuring the deformationaround drilled holes, Transactions ASME, Vol.56, No.4, pp.249-254, 1934.
[8] Olabi, A.G. et al.: Minimization of the residual stress in the heat affected zone by means of numerical methods, Mater Des, Vol. 28, pp. 2295–2302, 2007.
[9] Kohandehghan, A.R. and Serajzadeh, S.: Arc welding induced residual stress in butt-joints of thin plates under constraints, J Manuf Processes, Vol. 13, No. 2, pp. 96-103, 2011.
[10] Olabi, A.G. and Hashmi, M.S.J.: The effect of post-weld heat-treatment on mechanical-properties and residual-stresses mapping in welded structural steel, J Mater Process Technol, Vol. 55, pp. 117-122, 1995.
[11] Fratini, L. and Zuccarello, B.: An analysis of through-thickness residual stresses in aluminium FSW butt joints, Int J Mach Tools Manuf, Vol. 46, pp. 611-619, 2006.
[12] Mohamed, M.A., Manurung, Y.H.P. and Laakkonen, M.: Analysis of Residual Stress on FSW AA 6061 Using Hole-drilling with ESPI for HFMI Treated Condition. Materials Science Forum, Vol. 890, pp. 344-347, 2017.
[13] Ronnie, K.M.: Handbook of nondestructive testing, Vol. 5, Columbus, 1987.
[14] Blanchettea, Y., Dicksona, J.I. and Bassim, M.N.: Detection of general yielding in A516 Steel by acoustic emission, J Eng Fract Mech, Vol. 17, pp. 227–234, 1983.
[15] Kaiser, J.: untersuchungenuber das auf tretenger auschenbeimzugversuch, Dissertation, Technisch Hochschule Munich, Munich, 1950.
[16] Heidary, H., Zarif Karimi, N., Ahmadi Najafabadi, M., Rahimi, A. and Zucchelli, A.: Clustering of acoustic emission signals collected during drilling process of composite materials using unsupervised classifiers, Journal of Composite Materials, Vol. 49, pp. 559-571, 2014.
[17] Zarif Karimi, N., Minak, G. and Kianfar, P.: Analysis of damage mechanisms in drilling of composite materials by acoustic emission, Composite Structures, Vol. 131, pp. 107-114, 2015. [18] Tatro, C.A.: Sonic techniques in the detection of
crystal slip in metals, PhD thesis, College of Engineering, Michigan State university, East Lansing, 1959.
[19] Schofield, B.H., Bareiss, R.A. and Kyrala, A.A.: Acoustic emission under applied stress, ASTIA Document AD 155674, WADC Technical Report, pp. 58-194, 1958.
[20] Sedak, P. et al.: Application of acoustic emission to monitor the course of plastic strain in mechanical stress relieved welded joints, Arch Metal Mater, Vol. 55, No. 2, pp. 553-562, 2010.
[21] Venkitakrishnana, P.V. et al.: Study and analysis of residual stresses due to various secondary processes in AA 2219 annealed sheet using acoustic emission and hole drilling methods, NDT & E Int, Vol. 38, No. 8, pp. 615–622, 2005.
[22] Shao, J. and Yan, Y.: Review of techniques for on-line monitoring and inspection of laser welding, J Phys Conf Ser, Vol. 15, 2005.
FME Transactions VOL. 46, No 2, 2018 ▪ 237
Effects on Fatigue Crack Growth of a Friction Stir Welded Aluminum Alloy, NASA Report NASA/ TM–2015-218685, 2015.
[24] Mostafavi, S., Fotouhi, M., Motasemi, A., Ahmadi, A. and Sindi, C.T.: Acoustic Emission Metho– dology to Evaluate the Fracture Toughness in Heat Treated AISI D2 Tool Steel, J Mater Eng Perform, Vol. 21, No. 10, pp. 2106-2116, 2012.
[25] Sindi, C.T., Najafabadi, M.A. and Ebrahimian, S.A.: Fracture toughness determination of heat treated AISI, D2 tool steel using AE technique, ISIJ Int, Vol. 51, pp. 305–312, 2011.
[26] Crecraft, D.I.: The measurement of applied and residual stresses in metals using ultrasonic waves, J Sound Vib, Vol. 5, pp. 173-192, 1967.
[27] Egle, D.M. and Bray, D.E.: Measurement of Acoustoelastic and Third-Order Elastic Constants for Rail Steel, J Acoust Soc Am, Vol. 60, pp. 741-744, 1976.
[28] Sadeghi, S., Najafabadi, M.A., Javadi, Y. and Mohammadisefat, M.: Using ultrasonic waves and finite element method to evaluate through-thickness residual stresses distribution in the friction stir welding of aluminum plates, Mater Des, Vol. 52, pp. 870-880, 2013.
[29] Javadi, Y. and Najafabadi, M.A.: Comparison between contact and immersion ultrasonic method to evaluate welding residual stresses of dissimilar joints, Mater Des, Vol. 47, pp. 473–482, 2013. [30] Javadi, Y., Sadeghi, S. and Ahmadi, M.: Taguchi
optimization and ultrasonic measurement of residual stresses in the friction stir welding, Mater Des, Vol. 55, pp. 27-34, 2014.
[31] Javadi, Y., Najafabadi, M.A. and Akhlaghi, M.: Residual stress evaluation in dissimilar welded joints using finite element simulation and the LCR ultrasonic wave, Russ J Nondestr Test, Vol. 48, pp. 541–552, 2012.
[32] Minak, G. and Zucchelli, A.: Damage evaluation and residual strength prediction of CFRP laminates by means of acoustic emission techniques, in:
Durand LP Composite materials research progress, 2008, New York, pp. 165–207.
[33] Bakhtiari, A.A. et al.: Acoustic emission based on sentry function to monitor the initiation of delami– nation in composite materials, Mater Des, Vol. 32, No. 5, pp. 3059-3065, 2011.
[34] Ukpai, J.I. et al.: Exploring the erosive wear of X65 carbon steel by acoustic emission method, Wear, Vol. 301, No. 1, pp. 370-382, 2013.
[35] Philippidis, T.P. and Assimakopoulou, T.T.: Using acoustic emission to assess shearstrength degra– dation in FRP composites due to constant and variable amplitude fatigue loading, Compos Sci Technol, Vol. 68, No. 3, pp. 840–847, 2008.
[36] Siron, O., Chollon, G., Tsuda, H., Yamauchi, H., Maeda, K. and Kosaka, K.: Microstructural and mechanical properties of filler-added coal-tar pitch-based C/C composites: the damage and fracture process in correlation with AE waveform parameters, Carbon, Vol. 38, pp. 1369-1389, 2000. [37] Al-Ghamd, A.M. and Mba, D.: A comparative
expe–rimental study on the use of acoustic emission and vibration analysis for bearing defect identi– fication and estimation of defect size, Mech Syst Signal Process, Vol. 20, No. 7, pp. 1537–1571, 2006.
[38] Eftekharnejad, B., Carrasco, M.R., Charnley, B. and Mba, D.: The application of spectral kurtosis on Acoustic Emission and vibrations from a defective bearing, Mech Syst Signal Process, Vol. 25, No. 1, pp. 266–284, 2011.
[39] Kastratović, G., Vidanović, N., Grbović, A., Rašuo, B.: Approximate determination of stress intensity factor for multiple surface cracks, FME Transactions, Vol. 46, No. 1, pp. 41-47, 2018. [40] Gupta, B.P.: Hole-drilling Technique: Modification
in the analysis of residual stress, Exp Mech, Vol. 13, No. 1, pp. 23–27, 1973.
[41] Wang, J.Y.: Measurement of residual stress by the hole-drilling method: On the direction of maximum residual stress, Exp Mech, Vol. 28, No. 1, pp. 24-26, 1988.
ПРОЦЕНАЗАОСТАЛОГНАПОНАПРИЛИ–
КОМЗАВАРИВАЊАТРЕЊЕМАЛУМИНИ–
ЈУМСКИХПЛОЧАПОМОЋУАКУСТИЧНЕ
ЕМИСИЈЕИУЛТРАЗВУЧНИХТАЛАСА
С. Садеги, Н.З. Карими, М. Фотоухи, М. Хасани,
М.А. Најафабади, А. Павловић
Процена заосталог напона у структурама је од суштинског значаја за оптимизацију дизајна структура. Пажња овог рада је фокусирана на то како акустична емисија сигнала узрокована затежућим напоном улсед заваривања трењем алуминиумскихплоча, утиче напромену заосталих напона. Утомциљу, дистрибуцијазаосталихнапона удва трењемзаваренаалуминијумскаслојапрвосу оцењенаултразвучниммерењемнапона. АЕсигнали сутадапроизведенитокомиспитивањазатезањеми снимљенипомоћуАЕсензора. ДобијениАЕсигнали анализирани су коришћењем статистичких карак