Journal of Sustainable Development; Vol. 6, No. 6; 2013 ISSN 1913-9063 E-ISSN 1913-9071 Published by Canadian Center of Science and Education
Residential-Source Emission Inventory for the Niger Delta - A
Methodological Approach
Fagbeja Mofoluso Ayodele1, Hill Jennifer2, Chatterton Tim3, Longhurst James3 & Akinyede Joseph4 1 Strategic Space Applications Department, National Space Research and Development Agency (NASRDA), Abuja, Nigeria
2 Department of Geography and Environmental Management, University of the West of England, Bristol, UK 3 Air Quality Management Resource Centre, University of the West of England, Bristol, UK
4 Centre for Space Science and Technology Education (CSSTE), Obafemi Awolowo University, Ile-Ife, Nigeria
Correspondence: Fagbeja, Mofoluso Ayodele, Strategic Space Applications, National Space Research and Development Agency, Obasanjo Space Centre, Airport Road, PMB 437 Garki, Abuja, Nigeria. Tel: 234-815-756-4775. E-mail: [email protected]; [email protected]
Received: March 7, 2013 Accepted: May 15, 2013 Online Published: May 27, 2013 doi:10.5539/jsd.v6n6p98 URL: http://dx.doi.org/10.5539/jsd.v6n6p98
Abstract
This paper describes the methods applied to construct a GIS-based emission inventory infrastructure for specific air pollutants and greenhouse gases released from domestic cooking and lighting in the Niger Delta using publicly accessible data. The purpose is to identify and enhance knowledge of existing data gaps in order to progress the development of appropriate mechanisms to collect data in formats required for more accurate emission estimation. The major data gaps identified, which are demographic, activity-based, emission factors and spatial distribution of sources, are consistent across the majority of developing countries. Consequently, the methodological approach focuses on the use of a series of assumptions, emission factors from regions similar to the Niger Delta, and population estimation techniques to generate input data to support the limited publicly available government and research-based data. Developing countries with similar data limitations will benefit from the transferrable methodology. The infrastructure, which is constructed at 10 km-grid resolutions, produced total emission estimates of 70 kt/yr CO, 50 kt/yr NOx, 3 kt/yr PM10, 2.4 kt/yr SO2, 60 t/yr VOC, 5.7 mt/yr CO2 and 2 kt/yr CH4. Domestic lighting using generators and domestic cooking using firewood and kerosene constitute sources of significant emissions of air pollutants in the region. Due to the limited accuracy and completeness of currently available data, the estimates generated have high uncertainties.
Keywords: emission inventory, domestic activities, air pollution, data, GIS, developing countries, Niger Delta
1. Introduction
This paper presents a residential-source emission inventory infrastructure, which relies on a bottom-up approach to estimate emissions from specific domestic activities within the Niger Delta region using publicly available local data, assumptions and emission factors (Lindley et al., 1996; MacCarthy et al., 2010). The specific domestic activities considered in the inventory are cooking and lighting using generators. The burning of fossil fuels in lanterns and the use of candles for domestic lighting are not considered in this study due to a lack of adequate information on their usage. This paper also describes the methodological approach to estimate emissions of the most frequently and routinely monitored air pollutants - nitrogen dioxide (NO2), sulphur dioxide (SO2), particulate matter (PM10), volatile organic compounds (VOC) and carbon monoxide (CO) as well as the important GHGs - carbon dioxide (CO2) and methane (CH4) from these domestic activities in the Niger Delta. The emission estimation process used hourly profiles to generate annual estimates of emissions. The Niger Delta region exemplifies developing regions and countries with considerable limitations in publicly available government and research-based data. The majority of developing countries are faced with challenges of inadequate, inappropriate and lack of high quality data required for the accurate estimation of emissions from various anthropogenic activities (Duduta & Bishins, 2010). Publicly available data in these countries are not usually reliable and sufficient to develop a verifiable emissions inventory. As a result, the majority of developing countries in Africa, Asia and South America lack verifiable emissions inventories. The developing countries with inventories are faced with issues of quality assurance and inventory comparisons arising from the reliability of emission factors, inconsistent input activity data, methodologies, algorithms and a lack of capacity to undertake direct emissions measurements (Lim et al., 1999). For instance, the South African Department for Environmental Affairs and Tourism (DEAT) has the only verifiable emission inventory in sub-Saharan Africa (DEAT, 2007; DEAT, 2008). In view of data limitations, this paper presents the assumptions and methods applied to generate data in an appropriate format (MacCarthy et al., 2010). The process identified currently existing gaps in the data required for the generation of accurate emission estimates from domestic activities in the region. The methods presented in this paper are transferrable to other developing countries with similar limitations in demographic, activity-based and spatial data required for accurate emission estimation. The estimates generated from the process are presented in the form of maps and charts. Although the infrastructure is designed to provide GIS-based mapping and visualisation outputs for emission estimates at high- (1 km x 1 km), medium- (10 km x 10 km) and low- (20 km x 20 km) grid resolutions, the results presented in this paper are those generated at the medium-grid resolution.
1.1 Emissions from Domestic Activities in the Niger Delta
www.ccsen
[image:3.595.82.510.76.363.2]Oil and ga due to hig for domes According industriali results in u industrial estimated region, 66 infrastruct for cookin majority o for air po Nigerians coal, gas a This suppo Environme (EDGAR) greenhous are major of inorgan available f emission uncertainti emission combustio assumed th inaccurate net.org/jsd
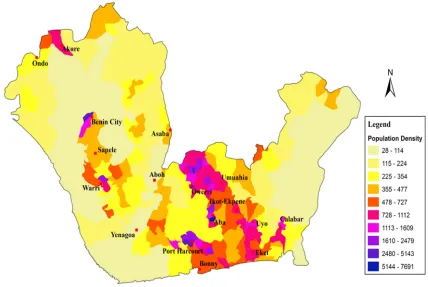
Figure 1. M
as exploration i gh rates of urb
stic cooking, d g to Hicks (19 sation, which urban and rura
use. Accordin 92% of Niger 6% of the pop ture, many urb ng and domest of homes burn llution in the rely on firewo and electricity r
orts the observ ental Assessm database (EC e gases and ai sources of air nic CO2; 43% o
from EC-JRC/ factors selec ies (EC-JRC/P estimates in A on of fossil fu
hat the majorit , as they are n
Map showing po
in the Niger D anisation, indu domestic light 998), the majo
are usually no al poverty, lack ng to the Uni
ians lived belo pulation self-c ban and rural d tic lighting. D fossil fuels to region. Acco ood for cooking
respectively (N vation of the Eu ment Agency ( C-JRC/PBL, 20 ir pollutants at pollutants in N of organic CO
/PBL (2010) a ted from pu PBL, 2010), e Appendix). T uel and bio-fue
ty of the estim not the result o
Journal of Su
opulation dens
Delta has result ustrialisation, g ting, and indu
ority of devel t accompanied k of access to ited Nations H ow the income classify as poo dwellers in the Due to the lack o generate elec ording to the N
g, 27% depend NBS, 2005).
uropean Comm (PBL) through 010). The EDG
t national leve Nigeria, contrib
2; and 4% of C are derived fr ublications, wh especially in d The predicted els range from mates obtained
of detailed sur
ustainable Devel
sity by local go
ted in a high ra gas flaring, an strial electricit loping countri d by commensu
infrastructure Human Develo e poverty line or (NBS, 200 Niger Delta re k of adequate ctricity. These
National Bure d on the use of
mission Joint R h the Emission GAR database els. According
buting 43% of CH4 emissions rom activity d hich could p developing cou uncertainties m 10% to 100
from EC-JRC/ rveys of the sp
lopment
overnment area
ate of pollution nd burning of
ty (NBS, 200 ies experience urate economi such as power opment Repor of $2 a day (U 6b). Due to p ely on burning electricity su are some of th eau of Statistic f kerosene or o
Research Centr n Database fo
is an inventor to the databa f CO; 9% of N s (EC-JRC/PBL data taken from produce natio untries with lim
in these emi 0% (EC-JRC/P
/PBL (2010) f pecific activitie
as in the Niger
n-related anthr bio-fuel (Note 6b; Ukoli, 20 e high rates o ic and infrastru
r and clean fue rt (UNHDR) UNDP, 2007).
poverty and a g of kerosene, upply from the he underlying cs (NBS), an oil, while 1.5%
re (EC-JRC) a or Global Atm ry of anthropo se, residential NOx; 18% of SO
L, 2010). The m internationa onal estimates mited data suc ission estimate PBL, 2010). C for Nigeria are
es, timescales
Vol. 6, No. 6;
r Delta
ropogenic activ e 1) and liquid
01; UNDP, 2 of urbanisation
ucture growth. el for domestic
for 2007-2008 In the Niger D a lack of acce
charcoal and w e national grid
factors respon estimated 70% %, 1% and 0.5%
and the Netherl mospheric Rese ogenic emissio
activities (No O2; 22% of VO
emission estim al data sources
s with substa ch as Nigeria es generated Consequently, e likely to be h
release em Emissions through th informatio regulation The invent Delta for functionali emission s 2. Materia The const lighting in Niger Delt (ArcView infrastruct results are 10 km x 1 the data c referenced geographic
Fi
missions in Nig Inventory (N he developmen on derived fro and reporting tory presented the purpose o ity of this pla sources and da
als and Metho
truction of the n the Niger D ta is designed Desktop) sof ture where deta e then linked to 0 km grids co contained in th d to Nigerian T c coordinate sy
gure 2. Flow d
geria. An asses NAEI) shows t nt of a national om appropriate g frameworks a d in this paper i of estimating e atform and pre ta collection in
ods
e GIS-based e elta followed and constructe ftware. The sp ails of the sour o the GIS usin vering the Nig he spreadsheet Transverse Me ystem, WGS 8
diagram repres reside
ssment of the u that uncertaint l or regional em e environment are currently u is the first spa emissions from esents a frame n the region an
emission inven the process s ed using a com preadsheet is u rces are entere ng the spatial a ger Delta. The ts are updated ercator - Mid 84 datum (Ony
senting the pro ential-source in
uncertainties in ties in emissio mission invent tal reporting a unavailable in atially-resolved m residential a
ework which nd other develo
ntory of pollu hown in Figu mbination of M
used to design ed and the proc attributes of da GIS also serv d. All the GIS Belt, Minna D yeka, 2006).
ocesses followe nventory for th
n the United K on estimates o tory using site and regulation
most develop d inventory des
activities. The can be used a oping countrie
utants and GH ure 2. The resi Microsoft Exce n and constru cess of estimat ata and the un ves as the repo S data (ArcVi Datum. The da
ed in the desig he Niger Delta
Kingdom’s Nat of less than 5 e-specific data ns (Murrells e ping countries, signed for the e paper furthe as a focus for es.
HGs from dom idential-source el spreadsheets uct the basic e
ting emissions ique identifier ository of spati ew shapefiles) ata are also av
gn and construc a
tional Atmosp 0% are achiev and relevant p et al., 2011). including Nig whole of the N r demonstrate r future survey
mestic cooking e inventory fo s and ESRI Ar emission inven s is carried out rs generated fo ial data from w ) are captured vailable in stan
www.ccsen
The key o identified allocate em the settlem area and g the area of of settlem settlement inventory, emission f emission d to the grid
2.1 Settlem
The reside Delta. A G settlement use and la National S database, w sensor ima Multispect JERS-1 Ra Resolution database f for 2000-0 obtain clou identificati of the Surv Agricultur databases extents of database a FORMEC settlement established urban settl net.org/jsd operations carr sources and th missions from ments that fell generating uniq
f the settlemen ments to the sp t segments and
the estimates factors data. B densities gener ds were used to
ment Data
ential sources GIS settlemen ts contained in and cover map Space Researc which contain ages. The sate tral Scanner f adar for 1995; n Radiometer from NASRDA 04 and Nigeria
ud-free image ion of the settl veyor General ral Developme
were overlaid f settlements e available from U database, a ts database, w d. The new da lements in the
Fig
ried out in dev he emission es
settlements th within the grid que identifiers nts estimated. pecific grids t d the areas of t of emissions Based on this rated for each o produce the e
used for the s nts database fo n the 1996 For p of Nigeria (A ch and Develo
ed only major ellite sensor d for 1993-95; ; and National (AVHRR) for A was develop aSat-1 for 200 es of Nigeria ( lements in the l of the Federa ent Programm to update the estimated at 5 m NASRDA w and also to in with the limits
atabase (or Ni Niger Delta. In
gure 3. Map sh
Journal of Su
veloping the s stimates with th hat cut across
ds. The proces for these grid Area segment they fell into. the segments w
from each set s, emission es settlement and emission distrib
study are repre or the Niger D restry Manage Ademiluyi et a opment Agenc r and minor urb data used were
Landsat Them l Oceanic and
r 1978, 1986, ped using a co 4-05. The sate (Agbaje & Fag e NASRDA da
ation in 1964 a me (ADP) as
sizes, names .8% over 3 d as used to upd corporate rura
of the areas c iger Delta inve n all, the new
howing 6,715 s
ustainable Devel
spatially enabl he appropriate more than one ss required the ds. Maps of the
ts of settlemen . The unique were calculated ttlement were
timates for th d the area of e bution maps fo
esented by the Delta was con
ement and Eva al., 2008) and y (NASRDA) ban settlement e Landsat Mul matic Mapper
Atmospheric , 1990 and 19 ombination of
ellite sensor da gbeja, 2006). atabase relied o
and the Federa well as an ex and classes of decades (Alkal date the size o al settlements.
covered by ur entory settlem database conta
settlements ide lopment
led emission i e grids. Specifi
e grid to speci e creation of th e extents of th nts were gener identifiers of d. From the Ex generated bas he settlement ach segment. T or the entire re
e area covered structed based aluation Coord d 2005 Nigeria
) (Agbaje & F ts, was created ltispectral Sca (TM) for 19 Administration 995 (Ademilu
Landsat Enha ata were acqui According to on place name al Ministry of xtensive field f settlements, c
li, 2005). Con of urban and
This produce rban, semi-urb ment database) ains 6,715 sett
entified in the N
inventory focu fic GIS process ific grids based he grids coveri he settlements w
rated in order t f the grids we xcel spreadshe sed on activity segments wer The emission egion.
d by the settlem d on the mino
dinating Unit an settlements Fagbeja, 2006) d using a comb anner (MSS) f 993; ERS-1 R n (NOAA) Ad uyi et al., 200
anced Themati ired on differe Agbaje and F datasets gene Agriculture th d verification considering gr nsequently, the semi-urban se ed a more det ban and rural
contains all t tlements (Figur
Niger Delta
Vol. 6, No. 6;
used on linking ses were appli d on the portio ing the entire s were produced to allocate por ere attached to eet designed fo y, demographic re calculated u estimates alloc
ments in the N or and major u
(FORMECU) database from ). The FORM bination of sat for 1976-78; S Radar for 1994
dvanced Very 8). The settle ic Mapper (ET ent days in ord Fagbeja (2006) erated by the O hrough the nat
exercise. The rowth in the sp e more recent ettlements from
2.2 Population Estimation
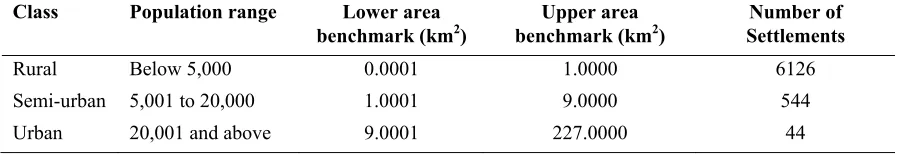
[image:6.595.70.521.232.309.2]The settlements in the new database were classified into urban (population above 20,000), semi-urban (population between 5,000 and 20,000) and rural (population below 5,000) based on the population classification of the Niger Delta Regional Development Plan (NDDC, 2006). The area benchmarks for the settlements were set based on the area limits of the minor and major urban settlements estimated from the FORMECU land use and land cover data (Ademiluyi et al., 2008). Based on personal knowledge of Abak (a semi-urban settlement covering an area approximately 9 km2) and Ore (an urban settlement covering an area estimated at 9 km2), a more rigorous classification process was carried out in order to refine the upper and lower benchmarks for the semi-urban and urban settlement categories respectively (Table 1).
Table 1. Classification of settlements in the Niger Delta into rural, semi-urban and urban classes based on population range (NDDC, 2006) and settlement area benchmarks
Class Population range Lower area
benchmark (km2) benchmark (kmUpper area 2) Settlements Number of
Rural Below 5,000 0.0001 1.0000 6126
Semi-urban 5,001 to 20,000 1.0001 9.0000 544
Urban 20,001 and above 9.0001 227.0000 44
Population estimates for settlements in the Niger Delta are not available from the Nigerian National Population Commission (NPC). Therefore, population estimates were derived based on assumptions and the most reliable population estimates available for some of the identified settlements within the region. The projected 2010 population estimates for 275 settlements were obtained from World Gazetteer (2010). Population estimates for the remaining settlements in the Niger Delta were derived based on the relationship that exists between settlement built-up (or dwelling) area and the population of settlements, assuming the entire settlement area constitutes dwelling area. The allometric relationship (that between a size of settlement and its population) is considered universal (Narrol, 1962; Tobler, 1969; Wiessner, 1974) and is represented by the equation:
A = a * Pb Where
A = Area of built-up area within a settlement
a = Coefficient of proportionality, which depends on the units of area measurements and the building and living culture within a settlement (Tobler, 1969).
P = Population within a settlement
b = Positive exponent, estimated to be 0.88 (Narrol, 1962; Tobler, 1969).
www.ccsenet.org/jsd Journal of Sustainable Development Vol. 6, No. 6; 2013
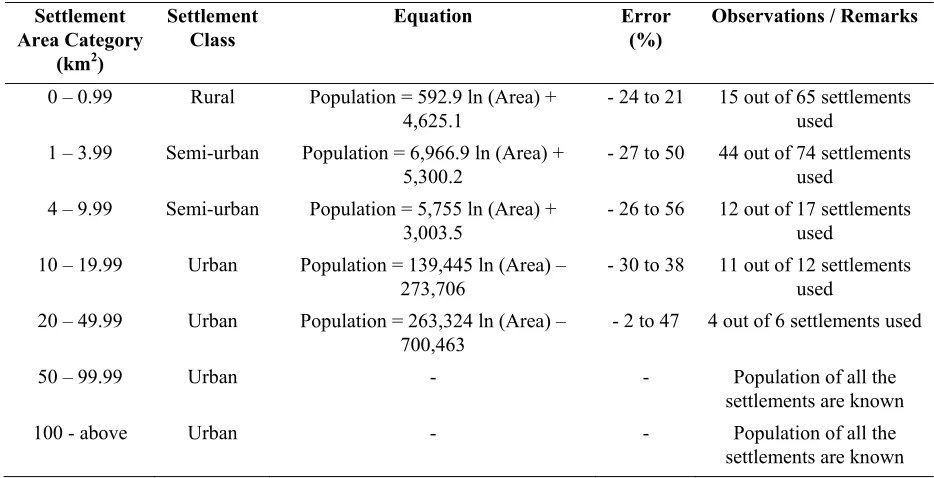
Table 2. Settlement size categories, population estimation equations and mean errors derived from the process of establishing a settlement size-population relationship
Settlement Area Category
(km2)
Settlement Class
Equation Error
(%)
Observations / Remarks
0 – 0.99 Rural Population = 592.9 ln (Area) + 4,625.1
- 24 to 21 15 out of 65 settlements used
1 – 3.99 Semi-urban Population = 6,966.9 ln (Area) + 5,300.2
- 27 to 50 44 out of 74 settlements used
4 – 9.99 Semi-urban Population = 5,755 ln (Area) + 3,003.5
- 26 to 56 12 out of 17 settlements used
10 – 19.99 Urban Population = 139,445 ln (Area) – 273,706
- 30 to 38 11 out of 12 settlements used
20 – 49.99 Urban Population = 263,324 ln (Area) – 700,463
- 2 to 47 4 out of 6 settlements used
50 – 99.99 Urban - - Population of all the
settlements are known
100 - above Urban - - Population of all the
settlements are known
Settlements were excluded from the assessment if their population estimates did not correspond with the area banding indicated in Table 1. Additional criteria were applied to select the settlements used for the generation of logarithmic relationships in order to reduce the error in the population estimation process. Population densities were generated for each settlement category. From this, the average population density was calculated. Furthermore, the percentage difference between the population density of the settlements and the average population density for each category was computed. All the settlements with a percentage difference greater than 50% were excluded from the estimation process. The scatter plots of population and settlement area for each areal category were used to generate logarithmic relationships for each category. The population of all the other settlements in the database were estimated by applying the appropriate logarithmic equation. However, the settlements with known populations retained their known populations in the final database.
2.3 Emission Factors
Table 3. Compilation of emission factors adopted for domestic cooking and lighting activities in the Niger Delta
Activity Pollutant Emission Factors Data source
Cooking – Fuel wood CO
CO2 CH4 NOx PM10
30 g C/kg dry fuel 400 g C/kg dry fuel 1.5 g C/kg dry fuel 0.7 g N/kg dry fuel 3.82 g/kg dry fuel
Brocard et al., 1998 Brocard et al., 1998 Brocard et al., 1998 Brocard et al., 1998 Zhang and Morawska, 2002
Cooking - Charcoal CO
CO2 CH4 NOx PM10
25 g C/kg dry fuel 170 g C/kg dry fuel 0.5 g C/kg dry fuel 0.29 g N/kg dry fuel 0.829 g/kg dry fuel
Brocard et al., 1998 Brocard et al., 1998 Brocard et al., 1998 Brocard et al., 1998 Zhang & Morawska, 2002
Cooking – Kerosene CO
CO2 CH4 NOx PM10 SO2 VOC
8.7 g C/kg fuel 3120 g C/kg fuel 0.0436 g C/kg fuel 0.618 g N/kg fuel 0.134 g/kg fuel 0.0331 g S/kg fuel 0.295 g C/kg fuel
Zhang et al., 2000 Zhang et al., 2000 Zhang et al., 2000 Zhang et al., 2000 Zhang et al., 2000 Zhang et al., 2000 Zhang et al., 2000 Cooking – Gas/Electricity CO
CO2 NOx PM10 SO2
0.236 g C/kg fuel 3440 g C/kg fuel 2.89 g N/kg fuel 0.113 g/kg fuel 0.0014 g S/kg fuel
Zhang et al., 2000 Zhang et al., 2000 Zhang et al., 2000 Zhang et al., 2000 Zhang et al., 2000 Lighting - Petrol Generator
Exhaust
CO CO2 NOx PM10 SO2 TOC
0.99 lb/MMBtu 154 lb/MMBtu 1.63 lb/MMBtu 0.1 lb/MMBtu 0.84 lb/MMBtu 2.1 lb/MMBtu
USEPA (1996) USEPA (1996) USEPA (1996) USEPA (1996) USEPA (1996) USEPA (1996) Lighting – Petrol Generator
Evaporation
TOC 0.09 lb/MMBtu USEPA (1996)
Lighting – Petrol Generator Crankcase
TOC 0.69 lb/MMBtu USEPA (1996)
Lighting – Petrol Generator Refuelling
TOC 0.15 lb/MMBtu USEPA (1996)
2.4 Assumptions
The series of assumptions used to support the construction of the residential-source inventory and the generation of input data were:
www.ccsenet.org/jsd Journal of Sustainable Development Vol. 6, No. 6; 2013
(2) Using population figures as a proxy for estimating emissions assumed that energy use is uniform over a political unit (Marland et al., 1985);
(3) Fuel mix is constant throughout the entire Niger Delta region (Marland et al., 1985). For example, households that use generators for electricity generation use petrol-fuelled generators for an average of four hours a day (from 6pm to 10pm);
(4) Domestic cooking is carried out two times a day on weekdays and three times a day on weekends in both the rural and urban areas based on the assumption that during the weekday, people are generally at work and they do not prepare lunch at home. The duration of cooking was assumed to be 1 hour for every cooking session. In a week, it was assumed that cooking activities take place for 16 hours in each household. This assumption was made arbitrarily;
[image:9.595.82.512.312.401.2](5) Anozie et al. (2007) estimated the daily energy consumption for cooking in Nigeria per household by combining an estimated daily household energy demand with an assumption of the percentage of this demand expended on cooking. Based on this, the estimated energy consumption for cooking was divided by the average number of hours expended on cooking daily in order to estimate the hourly activity rates (Table 4).
Table 4. Daily cooking energy consumption in Nigeria and average hourly consumption rate assumed for the construction of emissions inventory infrastructure for the Niger Delta
Cooking fuel Estimated daily consumption
per household (kg)
Estimated hourly consumption per household (kg) a
Fuel wood 0.8344 0.3651
Charcoal 0.8344 0.3651
Kerosene 0.3981 0.1742
Cooking gas / Electricity 0.0600 0.0263
a Hourly consumption estimate was based on the assumption that cooking is carried out for 16 hours in a 7-day week.
Source of National estimate: Anozie et al. (2007); hourly consumption estimate assumed by Fagbeja Mofoluso.
(6) The average household size in the Niger Delta was assumed to be 8 persons for households in rural settlements and 6 persons for households in semi-urban and urban settlements. This assumption was based on the average household size specified by NDDC (2006) in the Niger Delta Regional Development Plan. (7) The number of households in each settlement was calculated by dividing the estimated population of each
settlement with the corresponding household size. This calculation produced estimates of the total number of households in each State (Table 5). Although estimated total number of households for each State of the Niger Delta is available from NBS (2009), the estimates have not been disaggregated based on settlements. Therefore, the number of households generated by the research process was used in the construction of the emissions inventory.
Table 5. Percentage distribution of households by type of fuel for cooking in the nine States of the Niger Delta in 2007
State Estimated no. of households
from emission inventory
Fuel wood (%)
Charcoal (%)
Kerosene (%)
Electricity and gas (%)
Abia 1,850,476 73.6 0.0 25.8 0.7
Akwa-Ibom 324,465 81.0 0.4 18.3 0.2
Bayelsa 151,394 57.6 0.2 41.3 0.9
Cross-River 247,927 79.8 0.3 19.6 0.2
Delta 238,558 76.6 0.5 21.3 1.6
Edo 146,943 78.7 0.5 18.6 2.2
Imo 416,509 85.1 0.4 13.6 0.9
Ondo 346,924 66.7 0.3 32.6 0.4
Rivers 511,787 65.2 0.7 31.3 2.8
Total / Average 4,234,983 73.9 0.4 24.4 1.2
Source: NBS (2009).
(9) In order to estimate the number of households that rely on generators for electricity generation, an estimated percentage distribution of households by the type of electricity supply in 2007 available from NBS (2009) was assumed (Table 6). The percentages of households that have access to electricity using personal generators were applied to the estimated number of households derived from the emission inventory for each State to estimate emissions from the use of personal generators for domestic lighting.
Table 6. Percentage distribution of households by the type of electricity supply+ in the nine States of the Niger Delta for 2007
State PHCN
Only (%) RE Only (%) PG Only (%) PHCN & PG (%) PG (%)RE & Solar (%) (%) NA PG (%)Total
Abia 44.5 0.1 5.9 15.2 0.5 0.0 33.8 21.6
Akwa-Ibom 46.3 2.7 3.3 7.6 1.9 0.0 38.3 12.8
Bayelsa 10.3 10.1 13.3 5.8 37.8 0.5 22.2 56.9
Cross-River 54.1 0.5 3.2 1.7 3.4 0.0 37.1 8.3
Delta 62.7 0.0 2.5 3.0 1.6 0.0 30.2 7.1
Edo 80.7 0.0 1.5 0.9 0.0 0.1 16.9 2.4
Imo 68.5 1.4 5.2 4.1 0.1 0.0 20.8 9.4
Ondo 58 0.0 4.3 3.4 5.3 0.0 29.0 13.0
Rivers 24.6 7.4 16.3 4.7 10.4 0.0 36.6 31.4
Total / Average 50.7 2.4 6.4 5.2 5.6 0.04 29.7 18.1
a The types of electricity supply identified in Table 5 are PHCN – Power Holding Company of Nigeria (National Grid); RE – Rural Electrification; PG – Personal Generators; Solar – Solar Power; and NA – No Access to Electricity.
Source: NBS (2009).
[image:10.595.67.533.431.622.2]www.ccsen
(11) The ove
3. Results
The result presented CO, CO2, of emissio sources oc areas also part of the the Niger D 60 t yr-1 V
net.org/jsd
e entire area c erestimation in
ts generated fr as maps resolv CH4, NOx, PM ons over the N
ccur over the u record high em Niger Delta. T Delta, the ann VOC, 5.7 mt yr
-overed by a s some (probab
rom the estima ved at 10 km x M10, SO2 and V iger Delta sho urban areas of mission estima The results fro nual estimates g
-1 CO
2 and 2 k
Journal of Su
ettlement is bu bly much locali
ation of emiss x 10 km grid r VOCs released ows that highes
f Aba, Akure, ates. The majo om the invento generated are kt yr-1 CH
4.
ustainable Devel
uilt-up. This i ised) areas and
sions from the resolutions. Fi d from settleme st rates of emi
Benin City an rity of these ar ry show that fr 70 kt yr-1 CO,
lopment
is unlikely to b d underestimat
e identified se igures 4 (a - g ents in the Nig ission of pollu nd Port Harco reas are locate from domestic 50 kt yr-1 NO
be the case an tion in others.
ettlements in th g) show the spa ger Delta. The utants and GHG ourt. Other urb ed in the centra cooking and li Ox, 3 kt yr-1 PM
Vol. 6, No. 6;
nd will give ri
he Niger Delt atial distributio
spatial distrib Gs from reside ban and semi-u al and northwe ighting activiti M10, 2.4 kt yr-1
2013
ise to
www.ccsen
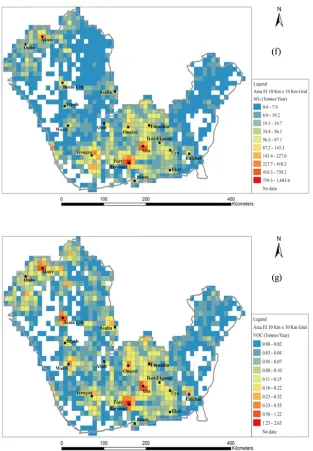
Figure Nigeria. (a
Figure 5 (a emissions generators approxima firewood p
net.org/jsd
4. 10 km grid a) CO, (b) CO2
a - g) shows th of the trace s constitute the ately 35,000 an produced an es
-based emissio 2, (c) CH4, (d)
he contribution gases. Domes e significant so nd 25,000 tonn stimated 558,0
Journal of Su
on estimates ge NOx, (e) PM10
per
n of the variou stic cooking u ources of air po nes of CO. Lig 000 and 465,00
ustainable Devel
enerated from 0, (f) SO2, (g) V r year (t yr-1)
us cooking an using firewood
ollutants in the ghting produce 00 tonnes of CO
lopment
the settlement VOC. The unit
d lighting acti d and kerosen e Niger Delta. ed 4 million to O2 respectively
ts in the Niger t shown on ma
ivities consider ne, and dome
Firewood and onnes of CO2, w
y.
Vol. 6, No. 6;
Delta region o aps is metric to
red in this stu estic lighting u
d lighting prod while kerosene
2013
of onnes
www.ccsen
Figure 5
Based on derived fro 2010 based urban settl proportion rural popu the total em the popula constitutes
net.org/jsd
. Contribution
the populatio om the invento d on the 2006 lement categor nal relationship ulation, which
missions from ation, contribu s 14% of the po
n of domestic c CO2, (c
on estimation ory methodolo
census estima ries are approx p between the constitutes 52 m domestic acti utes 33% to 3
opulation, pro
Journal of Su
cooking and lig c) CH4, (d) NO
process used ogy is estimate ates). The disa ximately 18.8 emission estim 2% of the entir
ivities in the N 36% of the e duce 13% to 1
ustainable Devel
ghting practice Ox, (e) PM10, (f
for the constr ed at 36,163,7 aggregated pop million, 4.9 m mates generate re population o Niger Delta. Th emission estim 14% of the emi
lopment
es to emissions f) SO2, (g) VO
ruction of the 712 (as compa pulation estima million and 12.5
ed from the in of the Niger D he urban popu mates. Finally, ission estimate
s in the Niger D OC
e inventory, th ared to 35.3 m
ates for the rur 5 million respe nventory and th Delta, contribu ulation, which , semi-urban es generated in
Vol. 6, No. 6;
Delta. (a) CO,
he total popul million projecte ral, semi-urban
ectively. There he population. utes 51% to 54 constitutes 34 settlements, w n the Niger Del
2013
(b)
ation d for n and e is a . The % of % of which
4. Discussion
4.1 Population Estimation
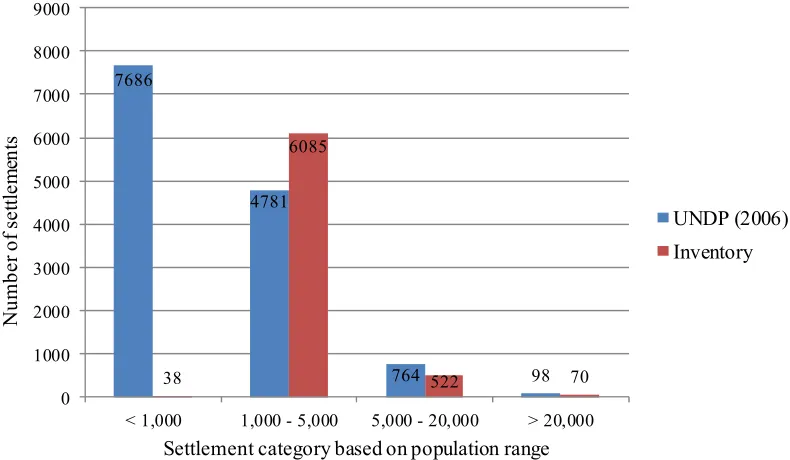
[image:16.595.101.496.477.707.2]According to NDDC (2006), there are an estimated 13,329 settlements in the Niger Delta region. However, the input settlement data in the Niger Delta inventory contains 6,715 settlements. NDDC (2006) states that the majority of settlements in the Niger Delta are very small and scattered rural hamlets, fishing or farming settlements, which are located along the riverbanks. The population of these settlements ranges from 50 to 500 persons (NDDC, 2006). The Niger Delta Human Development Report, produced by the United Nations Development Programme in 2006, supports the observation of NDDC (2006) on the number of settlements in the region. According to UNDP (2006), an estimated 7,686 settlements in the Niger Delta have populations that are lower than 1,000. In addition to low population, this class of settlements are small in size (UNDP, 2006). Due to the small size of these settlements, it was difficult to identify them from the medium spatial resolution satellite images used to identify the settlements contained in the emission inventory database (Ademiluyi et al., 2008; Agbaje & Fagbeja, 2006). Consequently, this study relies on approximately 50% of the settlements in the Niger Delta. Despite this shortfall in the total number of settlements available for the inventory, it is assumed that all the urban and semi-urban settlements in the Niger Delta are contained in the inventory settlement database (See section 2.1). This assumption is based on the methods and base data available from Agbaje and Fagbeja (2006), which were used to develop the database. Considering the size of the settlements in these categories, it is expected that they would have been captured in the processes of settlement identification. However, it is important to note that there are variations in the settlement category, which some of these urban and semi-urban settlements fall into due to the potential overestimations and underestimations in the method used in this study, as noted in Assumption 11 in Section 2.4. Figure 6 shows a graphical comparison of the number of settlements that fall into a specific population-based category as observed by UNDP (2006) as against those derived from the inventory. According to the comparison in Figure 6, the Niger Delta inventory settlement database records shortfalls of 242 and 28 in the number of settlements in the semi-urban and urban categories respectively. However, the inventory has 1,304 settlements more than number of settlements recorded by UNDP (2006) in the rural category with population range of 1,000 to 5,000 persons. The shortfall of 28 settlements recorded in the urban settlement category (population > 20,000) is assumed to have been accounted for in the semi-urban category (population range of 5,000 to 20,000). Similarly, the shortfall of 270 settlements recorded in the semi-urban category has been accounted for in the rural category (population range of 1,000 to 5,000). At this stage, it is difficult to verify this due to a lack of access to the settlement / population data used for the categorisation documented by UNDP (2006).
Figure 6. Comparison of the number of settlements within each settlement category as observed by UNDP (2006) against those derived from the Niger Delta inventory
7686
4781
764 98
38
6085
522 70
0 1000 2000 3000 4000 5000 6000 7000 8000 9000
< 1,000 1,000 - 5,000 5,000 - 20,000 > 20,000
N
um
be
r of
s
et
tle
m
ent
s
Settlement category based on population range
www.ccsenet.org/jsd Journal of Sustainable Development Vol. 6, No. 6; 2013
Following the process of estimating population for the settlements using logarithmic relationships between settlement area and population (Kvamme, 1997) as described in Section 2.2, the derived total population from the settlements contained in the Niger Delta inventory is estimated at 36,163,712. The derived population is based on the projected 2010 population of some of the settlements within the region (World Gazetteer, 2010). According to the 2006 population census, the total population of the Niger Delta is estimated at 31,224,177 (NBS, 2006a). Considering an estimated annual population growth rate of 3.1% for the Niger Delta (NDDC, 2006), the estimated 2010 population of the Niger Delta is 35,279,763. Therefore, the derived population from the inventory is overestimated above the projected 2010 population estimate for the Niger Delta by approximately 3%. Based on the information contained in Figure 7, the category of settlements that are not included in the Niger Delta inventory database are those with populations considerably less than 1,000. Assuming that each of these 6,614 settlements have populations ranging from 50 to 500 would suggest that a total population range of approximately 330,700 to 3,307,000 is unaccounted for by the inventory. In addition, knowing the range of population that is unaccounted for, and adding it to the derived population of the Niger Delta, the population estimation method used for this study would have potentially overestimated the population of the Niger Delta by 3% to 11%. In view of this margin of error likely falling within 10%, the population estimation process used for this study is considered reliable. It may be important to verify the locations and aerial extents of the settlements that are not included in the inventory database in order to improve the population estimation process and the estimates of emissions generated from the region. High spatial resolution satellite images, such as NigeriaSat-2, would assist in achieving this. The identification of these populations may be advantageous not just in terms of estimating emissions but also in assessing exposure to air pollution.
4.2 Estimates and Spatial Distribution of Emissions from Residential Sources in the Niger Delta
This sub-section discusses the uncertainties in the spatial distribution of emissions over the Niger Delta and the emission estimates generated from the inventory. In addition, the challenges of verifying the Niger Delta emissions inventory are discussed, considering the source categorisation of emissions and uncertainties in the emission estimates.
a. Uncertainties in spatial distribution of emissions
The total population estimate for urban and semi-urban settlements in the inventory with known populations from World Gazetteer (2010) is 12,192,311. This constitutes approximately 34% of the total derived population of the Niger Delta. In addition, approximately 372,240 are distributed amongst the rural settlements with known populations according to World Gazetteer (2010). This constitutes approximately 1% of the total derived population. Considering the spatial location of 35% of the population is known, and based on the generalisations involved in this study, it can be inferred that the spatial distribution of approximately 35% of the emission estimates is likely to be fairly accurate. However, much greater uncertainty is introduced by the assumption that the entire area covered by a settlement is built up. Consequently, there is likely to be a large, though unquantifiable, uncertainty in the spatial distribution of emissions generated from settlements in the Niger Delta. The uncertainty is large due to the level of generalisation in the input data and it is unquantifiable due to lack of comparable data. Consequently, the spatial distribution of the emissions generated from settlements is only accurate to the extent of the accuracy of the distribution of population within settlements, which is currently unquantifiable.
The uncertainties involved in this inventory may reduce and become quantifiable as and when potentially accurate and appropriately disaggregated data are available. However, the methodology used in this study verifies the functionality of the inventory to produce accurate results as and when appropriate data are available. It is worth noting that the results generated from the inventory (Figure 5) appear to have a correlation with the spatial distribution of the population density of the Niger Delta (Figure 2). The spatial distribution of emissions of pollutants and GHGs considered in this study shows considerable emissions generated over areas with population densities greater than 225 persons per km2. Such areas include the urban and semi-urban areas and some coastal rural settlements. This further underscores the strength of the methodology and its transferability. b. Uncertainties in the emission estimates generated from the inventory
of assumptions, and available proxy information are aggregates based on estimates generated at national, regional and individual States level. For example, the value used for daily energy consumption through cooking is based on national estimates. In addition, the rural and urban household sizes applied to all the States are the average regional estimates available for the entire region. There may be some, but not considerable, variations in the national, regional and local criteria applied. Therefore, these may further introduce some uncertainties in the estimates generated, which are based on the number of households.
According to Gordon (2005), there are an estimated 146 languages or ethnic groups in the Niger Delta. This may be an indication of variations in cultural and socio-economic practices, which may also have a bearing on domestic activities among the various ethnic groups in the region. In view of this, the use of input data aggregated at the State level introduces uncertainties into the emission estimates generated from the inventory. A further disaggregation based on Local Government Areas or settlements is expected to produce estimates that give better representations of the local rates of emission from residential sources within individual settlements. Additional uncertainties are introduced through the assumptions on daily fuel use, which did not take into consideration variations in domestic behaviours and fuel consumption between urban and rural dwellers. The availability of such disaggregated data may also enhance the robustness of the inventory infrastructure. In view of the unavailability of location-specific information of household distributions, it may be desirable, as data become available, to verify the effect on emission estimates of location-specific information concerning household distributions as against the assumption that entire settlement area is built-up and households are evenly distributed across settlement area.
4.3 Relevance of Infrastructure to Policy Development of an Air Quality Management Framework in Nigeria
As a critical component of an air quality management framework, an emission inventory must generate accurate emission estimates to provide the input data for modelling the dispersion of pollutants, which help in assessing exposures of humans and environment to the risks resulting from the pollution. The main purpose of focusing on publicly available data for the construction of the inventory presented in this paper is to identify existing gaps in data required to generate accurate estimates of emissions air pollutants and GHGs from domestic cooking and lighting activities in a developing country, Nigeria, as exemplified by the Niger Delta. The strength of an air quality management framework depends on environmental regulations and reporting (Murrells et al., 2009), which is currently unavailable in the majority of developing countries, including Nigeria. The absence of the regulations and reporting mechanisms in most developing countries informs their lack of effective air quality management frameworks. It further underscores the limitations encountered by this study in the availability and access to the required data for the Niger Delta. In addition to the identification of existing data gaps, the relevance of this study to aid the development of an air quality management framework lies in the availability and functionality of the infrastructure. The infrastructure is the first spatially-enabled inventory infrastructure developed in sub-Saharan Africa. The techniques presented in this paper could be replicated for other parts of Nigeria in order to extend the scope of the inventory to the entire country. The scope and methodology are also relevant to other developing countries currently without functional and verifiable inventories. The areas that require priority attention in further development of the infrastructure and improving its relevance towards the development of a national air quality management framework are:
(1) Verification of the number of settlements within the Niger Delta by acquiring high-resolution satellite images to identify and map all the settlements currently not available on the inventory database. The availability of high-resolution NigeriaSat-2 satellite from NASRDA shall be invaluable in achieving this.
(2) Provision of population and other demographic estimates for each settlement within the region by the National Population.
(3) Further disaggregated statistical data on rates of fuel consumption for domestic cooking and lighting to settlements and / or local government area levels.
(4) Collaboration with universities and research institutions to develop localised emission factors for fuel consumption.
www.ccsenet.org/jsd Journal of Sustainable Development Vol. 6, No. 6; 2013
5. Conclusion and Recommendations
This residential-source emission inventory infrastructure for the Niger Delta is a critical development that will assist air quality and carbon emission specialists in Nigeria to generate reliable emission estimates and produce maps of the spatial distribution of emissions of air pollutants and GHGs from residential activities. The inventory relies on the capabilities and inter-operability of GIS and spreadsheet applications. Its visual display will assist policy makers to appreciate the air quality scenario in the region, thereby enabling them to develop and test appropriate policies and legislation to improve the quality of air and reduce carbon dioxide emissions in the Niger Delta. The inventory also constitutes a component of the GIS-based Niger Delta Emission Inventory (NDEI) infrastructure, which has been designed and constructed to estimate emissions from a much wider range of point, line and area sources identified in the Niger Delta. The process undertaken in this study has identified the gaps in data requirements that currently exist in the Niger Delta.
The results generated from the inventory currently indicate varying degrees of accuracy and uncertainty arising from generalisation, incomplete spatial data and input data with limited accuracy. Although the inventory provides emission estimates on an annual basis, the activities that release emissions are assessed based on hourly rates of emission release. However, the best available input data make gross generalisations about the hourly rates of activities. Consequently, a further refinement of the input data will be required to reduce the level of generalisation by establishing the more specific hourly rates of activities and energy consumption during cooking and lighting. This can then form the basis for daily energy consumption rates from which annual emission estimates could be generated. In order to improve on the accuracy of emission estimates, this study recommends the conduct of a pilot survey in order to gather site-specific information, which will serve as input data into the inventory. This may be conducted in collaboration with the Nigerian National Environmental Standards Regulations and Enforcement Agency (NESREA). In addition, an investigation into the spatial distribution of households within settlements will further enhance the accuracy that might result from better spatially resolved data. The availability of high-resolution satellite sensor observations at the National Space Research and Development Agency (NASRDA) may be invaluable in achieving this. This paper further recommends that the Nigerian National Population Commission should collate and make available population and demographic estimates for all settlements in the country.
Accurate estimates of emissions released from residential sources are important for health-risk assessment, which stands to enhance knowledge-based decision-making. This study provides an indicator to NESREA of the areas of data acquisition required to enhance their development of an air quality management framework for Nigeria.
The methodology for the construction of the inventory is relevant and transferrable to other developing regions to produce spatially-enabled inventories. The use of assumptions to support publicly available data can be applied to other developing regions with data limitations similar to the Niger Delta. The relevant agencies in these countries may adopt the recommendations of this study in order to improve on their emission estimation processes.
Acknowledgement
The authors acknowledge the financial support of the National Space Research and Development Agency (NASRDA) and the University of the West of England, Bristol.
References
Ademiluyi, A. I., Okude, A. S., & Akanni, C. O. (2008). An appraisal of land use and land cover mapping in Nigeria. African Journal of Agricultural Research, 3, 581-586.
Agbaje, G. I., & Fagbeja, M. (2006). Creation of the national geo-spatial data infrastructure (NGDI) fundamental datasets from medium-resolution satellite imagery - NigeriaSat-1 for sustainable national development. AARSE 6th International Conference, Cairo 2006.
Alkali, J. L. S. (2005). Planning sustainable urban growth in Nigeria: challenges and strategies, in: Anon., Planning and Urban Growth and Sustainable Architecture. ECOSOC Chambers, United Nations
Headquarters, New York. Retrieved June 6, 2005, from http://www.un.org/docs/ecosoc/meetings/2005/docs/Alkali.pdf
Anozie, A. N., Bakare, A. R., Sonibare, J. A., & Oyebisi, T. O. (2007). Evaluation of cooking energy cost, efficiency, impact on air pollution and policy in Nigeria. Energy, 32, 1283-1290. http://dx.doi.org/10.1016/j.energy.2006.07.004
Banerjee, T., Barman, S. C., & Srivastava, R. K. (2011). Application of air pollution dispersion modelling for source- contribution assessment and model performance evaluation at integrated industrial estate-Pantnagar. Environmental Pollution, 159, 865-875. http://dx.doi.org/10.1016/j.envpol.2010.12.026 Behera, S. N., Sharma, M., Dikshit, O., & Shukla, S. P. (2011). GIS-based emission inventory, dispersion
modelling, and assessment for source contributions of particulate matter in an urban environment. Water Air Soil Pollution, 218, 423-436. http://dx.doi.org/10.1007/s11270-010-0656-x
Brocard, D., Lacaux, J., & Eva, H. (1998). Domestic biomass combustion and associated atmospheric emissions in West Africa. Global Biochemical Cycles, 12, 127-139. http://dx.doi.org/10.1029/97GB02269
Department for Environmental Affairs and Tourism (DEAT). (2007). The 2007 national framework for air quality management in the Republic of South Africa. DEAT, South Africa.
Department for Environmental Affairs and Tourism (DEAT). (2008). Manual for air quality management planning in South Africa. Zanokuhle Environmental Services, Overport, South Africa.
De Kluizenaar, Y., Aherne, J., & Farrell, E. P. (2001). Modelling the spatial distribution of SO2 and NOx
emissions in Ireland. Environmental Pollution, 112, 171-182.
http://dx.doi.org/10.1016/S0269-7491(00)00120-2
Duduta, N., & Bishins, A. (2010). Citywide transportation greenhouse gas emissions inventories: a review of selected methodologies. WRI Working Paper. World Resource Institute, Washington, DC.
European Commission, Joint Research Centre (JRC) / Netherlands Environmental Assessment Agency (PBL). (2010). Emission database for global atmospheric research (EDGAR). Release version 4.1. Retrieved from http://edgar.jrc.ec.europa.eu
Gordon, R. G. (2005). Ethnologue: Languages of the World. Fifteenth Edition. SIL International.
Hicks, F. J. (1998). Enhancing the productivity of urban Africa. International Conference on Research Community for the Habitat Agenda Forum of Researchers on Human Settlements. Geneva., July 6-8, 1998.
Kvamme, K. L. (1997). A wider view of the relationship between settlement size and population in the Peruvian Andes. American Antiquity, 62, 719-722. http://dx.doi.org/10.2307/281890
Lim, B., Boileau, P., Bonduki, Y., van Amstel, A. R., Janssen, L. H. J. M., Olivier, J. G. J., & Kroeze, C. (1999). Improving the quality of national greenhouse gas inventories. Environmental Science and Policy, 2, 335-346. http://dx.doi.org/10.1016/S1462-9011(99)00023-4
Lindley, S. J., Longhurst, J. W. S., Watson, A. F. R., & Conlan, D. E. (1996). Procedures for the estimation of regional scale atmospheric emissions - An example from the North West Region of England. Atmospheric Environment, 30, 3079-3091. http://dx.doi.org/10.1016/1352-2310(95)00304-5
MacCarthy, J., Li, Y., Murrells, T. P., Okamura, S., Passant, N., Sneddon, S., Martinez, C., … Misselbrook, T. (2010). Air Quality Pollutant Inventories for England, Scotland, Wales and Northern Ireland: 1990 - 2008. National Atmospheric Emissions Inventory, AEA Group, Oxfordshire, UK.
Marland, G., Rotty, R. M., & Treat, N. L. (1985). CO2 from fossil fuel burning: global distribution of emissions. Tellus, B(37B), 243-258. http://dx.doi.org/10.1111/j.1600-0889.1985.tb00073.x
Murrells, T. P., Passant, N. R., Thistlewaite, G., Wagner, A., Li, Y., Bush, T., … Brophy, N. (2011). UK emissions of air pollutants 1970-2009. AEA, Harwell, Oxfordshire, UK.
Naroll, R. (1962). Floor area and settlement population. American Antiquity, 27, 587-588. http://dx.doi.org/10.2307/277689
National Bureau of Statistics (NBS). (2005). Poverty profile for Nigeria. National Bureau of Statistics, Abuja, Nigeria.
National Bureau of Statistics (NBS). (2006a). Federal Republic of Nigeria: 2006 Population Figures. National Bureau of Statistics, Abuja, Nigeria.
www.ccsenet.org/jsd Journal of Sustainable Development Vol. 6, No. 6; 2013
National Bureau of Statistics (NBS). (2009). Social Statistics in Nigeria. National Bureau of Statistics, Abuja, Nigeria.
Niger Delta Development Commission (NDDC). (2006). Niger Delta Development Regional Master Plan. Niger Delta Development Commission, Port Harcourt, Nigeria.
Olivier, J. G. J., Berdowski, J. J. M., Peters, J. A. H. W., Bakker, J., Visschedijk, A. J. H., & Bloos, J. J. (2001).
Applications of EDGAR including a description of EDGAR 3.2: reference database with trend data for 1970-1995. National Institute for Public Health and the Environment (RIVM), Bilthoven, Netherlands. Onyeka, E. C. (2006). Relating the Nigerian reference frame and AFREF. 5th FIG Regional Conference, Accra
Ghana, 8 - 11 March 2006.
Parra, R., Jimenez, P., & Baldasano, J. M. (2006). Development of the high spatial resolution EMICAT2000 emission model for air pollutants from the north-eastern Iberian Peninsula (Catalonia, Spain).
Environmental Pollution, 140, 200-219. http://dx.doi.org/10.1016/j.envpol.2005.07.021
Pastorello, C., Caserini, S., Galante, S., Dilara, P., & Galletti, F. (2011). Importance of activity data for improving the residential wood combustion emission inventory at regional level. Atmospheric Environment, 45, 2869-2876. http://dx.doi.org/10.1016/j.atmosenv.2011.02.070
Streets, D. G., Bond, T. C., Carmichael, G. R., Fernandes, S. D., Fu, Q., He, D., Kilmont, Z., … Yarber, K. F. (2003). An inventory of gaseous and primary aerosol emissions in Asia in the year 2000. Journal of Geophysical Research, 108(D21), 8809. http://dx.doi.org/10.1029/2002JD003093
Su, S., Li, B., Cui, S., & Tao, S. (2011). Sulphur dioxide emissions from combustion in China: from 1990 to 2007. Environmental Science and Technology, 45, 8403-8410. http://dx.doi.org/10.1021/es201656f Tobler, W. (1969). Satellite confirmation of settlement size coefficients. Area I, 30-34.
Ukoli, M. K. (2001). Environmental Factors in the Management of the Oil and Gas Industry in Nigeria. Central Bank of Nigeria, Abuja, Nigeria.
United Nations Development Programme (UNDP). (2006). Niger Delta Human Development Report. United Nations Development Programme, Abuja, Nigeria.
United Nations Development Programme (UNDP). (2007). UNDP Human Development Report 2007/2008 - Fighting Climate Change: Human Solidarity in a Divided World. United Nations Development Programme, New York.
United States Environmental Protection Agency (USEPA). (1996). Emission factor documentation for AP-42 Section 3.3 – Gasoline and diesel industrial engines, In AP42, 5th Edition, Volume I Chapter 3:
Stationary Internal Combustion Sources. Retrieved from http://www.epa.gov/ttn/chief/ap42/ch03/final/c03s03.pdf
Wang, H., Fu, L., Zhou, Y., Du, X., & Ge, W. (2010). Trends in vehicular emissions in China’s mega cities
from 1995 to 2005. Environmental Pollution, 158, 394-400.
http://dx.doi.org/10.1016/j.envpol.2009.09.002
Wiessner, P. (1974). A functional estimator of population from floor area. American Antiquity, 39, 343-350. http://dx.doi.org/10.2307/279593
World Gazetteer. (2010). Nigeria: largest cities and towns and statistics of their population. Retrieved from http://www.world-gazetteer.com/wg.php?x=&men=gcis&lng=en&des=wg&srt=npan&col=abcdefghinoq& msz=1500&ge o=-158
Zhang, J., & Marawska, L. (2002). Combustion sources of particles: 2. Emission factors and measurement methods. Chemosphere, 49, 1059-1074. http://dx.doi.org/10.1016/S0045-6535(02)00240-0
Notes
Note 1. Ba Note 2. Bi Delta (NB Note 3. Ac IPCC Cod presented Netherland http://them Note 4. A reliable sh
Appendix
Map of Source of
ased on the fol io-fuel refers to
S, 2009). ccording to the de “1A4”, enco in Table 2 c
ds E
masites.pbl.nl/e According to K howing “less sk
x
the nine State map: NASRD
lowing conver o firewood and
e Intergovernm ompass residen contain emiss Environmental en/themasites/e Kvamme (199
kewness and th
s of the Niger DA.
rsion factors: 3 d charcoal, wh
mental Panel on ntial, commerc ions from sou Ass edgar/documen
7), logarithmi
he extremity of
Delta. Inset sh
3.78541178 Li hich constitute
n Climate Cha cial and other urces other th essment ntation/definit ic relationship
f outlying data
hows the locati
itres = 138,690 a major sourc
ange (IPCC), d sources of em han domestic
Agency, tions/index.htm
s between set
points are red
ion of the Nige
0 Btu; 1MMBt ce of cooking e
domestic activi missions. There
cooking and PBL ml).
ttlement size a
duced”.
er Delta region
tu = 1,000,000 energy in the N
ities, defined b efore, the estim d lighting (So
L we
and population
n within Niger Btu. Niger
y the mates urce: ebsite
n are
www.ccsenet.org/jsd Journal of Sustainable Development Vol. 6, No. 6; 2013
Emission estimates generated from domestic activities in Nigeria in 2005 based on the percentage contribution from residential sources in the EDGAR database (EC-JRC / PBL, 2010).
Pollutant / GHG 2005 emission estimates from domestic
activities in Nigeria (million t yr-1)
CO 4.04
NOx 0.05
SO2 0.03
VOC 0.40
CO2 95.36
CH4 0.25
Copyrights
Copyright for this article is retained by the author(s), with first publication rights granted to the journal.