OPTIMIZING PATIENT COMPREHENSION OF INFORMATION VISUALIZATIONS FOR MEDICATION ADHERENCE AND BLOOD PRESSURE
Adam J. Sage
A dissertation submitted to the faculty at the University of North Carolina at Chapel Hill in partial fulfillment of the requirements for the degree of Doctor of Philosophy in
the Division of Pharmaceutical Outcomes and Policy in the Eshelman School of Pharmacy.
Chapel Hill 2018
Approved by:
Delesha M. Carpenter Susan J. Blalock Stacy Cooper Bailey Arlene E. Chung David Gotz
Ó 2018 Adam J. Sage ALL RIGHTS RESERVED
ABSTRACT
Adam J. Sage: Optimizing Patient Comprehension of Information Visualizations for Medication Adherence and Blood Pressure
(Under the direction of Delesha M. Carpenter)
Introduction: This dissertation focused on designing hypertension self- management visualizations that facilitate patient comprehension of blood pressure and medication adherence information. The objectives of this research were to: 1) assess patient preferences and understanding of visualization features; 2) assess whether condensing the display of blood pressure and medication adherence
information into a single visualization improves patient comprehension of the inferred relationship between medication adherence and blood pressure control (compared to separate visualizations); 3) assess whether health literacy moderates the effect of condensed visualizations on comprehension; and 4) assess the validity and
reliability of a newly developed hypertension-related visualization comprehension scale.
Methods: Patients with hypertension (n=6) participated in user assessments to understand preferences for visualization features. Another sample of patients with hypertension (n=6) participated in cognitive interviews that assessed understanding of visualizations that incorporated patient preferences. A survey experiment with patients with hypertension (n=137) then assessed whether condensed visualizations improved comprehension of blood pressure and medication adherence information.
Multiple regression analysis was used to assess the main effect of visualization type
(condensed versus separate display) on comprehension, and the moderating effect of health literacy on comprehension. Exploratory and confirmatory factor analysis were used to assess the validity and reliability of the comprehension scale.
Results: Patients preferred visualizations with blue/orange color-coded culturally recognizable symbols to show medication adherence, and the use of labeled blood pressure data points, horizontal reference lines, and a shaded
“normal” blood pressure zone. Patients best understood a shaded “normal” blood pressure zone with color-coded symbols to show medication adherence. Condensed visualizations did not significantly improve comprehension, and health literacy did not moderate the relationship between visualization type and comprehension.
However, greater health literacy (B=0.61, p=.0001) and hypertension knowledge (B=0.10, p<0.0001) were positively associated with comprehension. Exploratory and confirmatory factor analyses supported a unidimensional 4-item solution for the comprehension scale.
Conclusion: This study is an important step in developing useful and useable data visualizations for self-managing HTN. Condensed-display visualizations did not improve patient comprehension of BP and medication adherence information. Future research should further investigate how to design visualizations that improve
comprehension, specifically for patients with low health literacy.
To my parents, Clifford and LuAnn Sage.
To my brother and best friend, Rusty Sage.
ACKNOWLEDGEMENTS
First, I would like to acknowledge and thank my committee. Your guidance and feedback throughout the dissertation process made me grow as a researcher and helped me turn an idea into this massive dissertation. Thank you to Delesha Carpenter for being an excellent advisor the past four years. Thank you for the countless hours of reviewing my work, meeting with me, and helping to ensure my success. I owe you many, many beers. I hope I make you proud.
Thank you, Sue Blalock for your incredibly thorough comments and thoughtful questions and suggestions throughout this entire process (and my entire PhD). All of your input and guidance not only improved this dissertation but helped me grow as a researcher.
I would like thank Stacy Bailey for removing participant recruiting barriers during every phase of this study and providing your expertise in health literacy.
Thank you, Arlene Chung and David Gotz for agreeing to lend your expertise to this research, specifically related to data visualization design and the hypertensive patient population.
Several other people and organizations provided technical expertise and financial support that made this research possible. In particular, Chris Wiesen at the Odum Institute provided much appreciated statistical consulting, and the PhRMA Foundation provided financial support, which allowed me to focus on research during the last year of my PhD.
Thank you, Robert Furberg for taking the time to talk all things technology every other Wednesday over beers. Your support early in my career helped motivate me to take the leap and pursue a PhD, and your continued support and mentorship throughout my PhD pushed me to not only think big, but to think deeply about my interests, take risks in pursuing them, and let that passion guide my career choices.
Thank you to all of my friends for your support. Thank you to my fellow DPOPers for your feedback, and more importantly for your friendship. To Nirosha Mahendraratnam, it was a privilege to trudge through this process together. Thank you, Michael Hartley. Life’s adventures wouldn’t the same without your friendship and support.
Finally, I want to thank my family. Thank you to my parents, Clifford and LuAnn Sage. Your endless support and encouragement have held me up for 33.885 years and counting, and I think I’m starting to get the hang of things. I know I have had a lot of crazy ideas throughout my life, some of which I am sure you scratched your head over as I could have ended up going down a myriad of paths. I hope this path has made you proud! Thank you to all of my siblings – Rusty, Missy, Corry, and Kris. Thank you specifically to Rusty for being such a supportive big brother in so many ways. From putting up with me when I’m stressed, talking endlessly about life, sharing our frustrations, and sharing life’s happiness. To everyone, I promise I’m finished with school this time. For real.
TABLE OF CONTENTS
LIST OF TABLES ... xvi
LIST OF FIGURES ... xviii
LIST OF ABBREVIATIONS AND SYMBOLS ... xx
CHAPTER 1: INTRODUCTION ... 1
1.1 Problem Statement ... 1
1.2 Study Aims ... 4
1.3 Organization of the Dissertation ... 5
CHAPTER 2: BACKGROUND AND SIGNIFICANCE ... 7
2.1 Introduction ... 7
2.2 Hypertension ... 8
2.2.1 Hypertension Self-Management ... 9
2.2.1.1 Physicians and Hypertension Self-Management ... 10
2.2.1.2 Technology and Hypertension Self-Management... 10
2.3 Medication Adherence ... 11
2.3.1 Patient-related Factors ... 12
2.3.2 Condition-related Factors ... 12
2.3.3 Therapy-related Factors ... 12
2.3.4 Social and Economic Factors ... 13
2.3.5 Health System and Healthcare Factors ... 14
2.4 Theories of Health Behavior... 16
2.4.1 Health Belief Model ... 16
2.4.2 Social Cognitive Theory ... 18
2.5 Health Literacy ... 22
2.6 Numeracy and Graph Literacy ... 23
2.7 Hypertension Knowledge ... 23
2.8 Assessing Health Literacy ... 24
2.9 Health Literacy and Visual Short-term Memory... 25
2.10 Visual Short-term Memory ... 25
2.11 Mobile Health and Wearable Technology for Medication Adherence and Hypertension Self-monitoring ... 29
2.12 Guidelines and Best Practices for Information Visualizations ... 33
2.12.1 Visualization Perceptions and Preferences ... 35
2.12.2 Visualization Design and Task Performance ... 38
2.13 Hypertension-related Information Visualization Comprehension... 39
2.14 Developing A Conceptual Framework to Address Research Gaps ... 40
CHAPTER 3: RESEARCH AIMS AND HYPOTHESES ... 43
CHAPTER 4: METHODS ... 47
4.1 Study Overview ... 47
4.2 Development of Visualizations ... 48
4.2.1 Incorporating Best Practices and Guidelines ... 48
4.2.2 Iterative Results-driven Visualization Design ... 50
4.2.3 Information Assumptions for Visualization Designs ... 51
4.3 Aim 1 Methods ... 53
4.3.1 Aim 1 Participant Recruitment ... 53
4.3.1.1 Participant Recruitment for User Assessment
Interviews ... 53
4.3.1.2 Cognitive Interview Participant Recruitment ... 54
4.3.2 Aim 1 Eligibility Criteria ... 54
4.3.3 User Assessment Data Collection Procedures ... 55
4.3.4 User Assessment Interview Analyses ... 64
4.3.5 Cognitive Interview Data Collection Procedures ... 65
4.3.6 Cognitive Interview Analysis ... 67
4.4 Aim 2 Methods ... 68
4.4.1 Aim 2 Participant Recruitment ... 68
4.4.2 Aim 2 Eligibility Criteria ... 69
4.4.3 Sample Size and Power Calculation ... 69
4.4.4 Experimental Design ... 70
4.4.5 Measures ... 71
4.4.5.1 Hypertension Knowledge ... 71
4.4.5.2 Health Literacy ... 73
4.4.5.3 Visualization Comprehension ... 75
4.4.5.4 Participant Characteristics and Demographic Variables ... 76
4.4.6 Statistical Analysis ... 77
4.4.6.1 Data Quality and Missing Data ... 77
4.4.6.2 Descriptive Statistics ... 79
4.4.6.3 Experiment Analysis ... 79
4.5 Aim 3 Methods ... 81
4.5.1 Exploratory and Confirmatory Factor Analysis of the 6- item Comprehension Scale ... 81
4.5.1.1 Model Identification ... 83
4.5.1.2 Correlated Errors ... 86
4.5.2 Convergent Validity ... 86
4.5.3 Scale Reliability ... 86
CHAPTER 5: USER ASSESSMENTS OF HYPERTENSION- RELATED INFORMATION VISUALIZATIONS FOR SELF- MONITORING MEDICATION ADHERENCE AND BLOOD PRESSURE ... 87
5.1 Overview ... 87
5.2 Introduction ... 88
5.2.1 Technology and hypertension self-management ... 89
5.2.2 Data Visualizations for Hypertension Self- management ... 90
5.3 Methods ... 92
5.3.1 Participant Recruitment ... 92
5.3.2 Data Visualization Design ... 92
5.3.3 Data Collection Procedure and Measures ... 94
5.3.4 Data Analysis... 98
5.4 Results ... 99
5.4.1 Common Data Visualizations in Existing Apps ... 99
5.4.2 Sample Characteristics ... 100
5.4.3 Visualization Preferences ... 100
5.4.4 Label Preferences ... 102
5.4.5 Reference Line Preferences ... 102
5.4.6 Shading, Color-coding, and Symbols for Medication Adherence ... 103
5.4.7 Calendar versus List View for Medication Adherence ... 103
5.4.8 Terminology ... 104
5.4.9 Perceptually Distant Color Preferences ... 104
5.4.10 Perceptually Distant Symbol Preferences ... 105
5.4.11 Other Preferences and Suggestions ... 107
5.5 Discussion... 107
5.6 Conclusion ... 110
CHAPTER 6: PATIENT UNDERSTANDING OF HYPERTENSION- RELATED INFORMATION VISUALIZATIONS WITH A CONDENSED DISPLAY OF MEDICATION ADHERENCE AND BLOOD PRESSURE INFORMATION ... 112
6.1 Overview ... 112
6.2 Introduction ... 113
6.2.1 Technology and Hypertension Self-management ... 114
6.2.2 Visualization Comprehension ... 115
6.2.3 Data Visualizations for Hypertension Self- management ... 116
6.3 Methods ... 117
6.3.1 Participant Recruitment ... 117
6.3.2 Data Visualization Design ... 118
6.3.3 Data Collection Procedure and Measures ... 120
6.3.4 Data Analysis... 122
6.4 Results ... 122
6.4.1 Sample Characteristics and Adolescent Technology Use ... 122
6.4.2 Visualization Understanding ... 123
6.4.3 Colors, Symbols, and Labels ... 125
6.4.4 Terminology ... 126
6.4.5 Axes and Tick Marks ... 126
6.4.6 Adherence and Blood Pressure Information ... 127
6.5 Discussion... 127
6.6 Conclusion ... 131
CHAPTER 7: ASSESSING THE EFFECT OF VISUALIZATION TECHNIQUES ON PATIENT COMPREHENSION OF HYPERTENSION-RELATED INFORMATION ... 132
7.1 Overview ... 132
7.2 Introduction ... 133
7.2.1 Technology and Hypertension Self-management ... 135
7.2.2 Visualization Comprehension ... 135
7.2.3 Data Visualizations for Hypertension Self- management ... 136
7.3 Methods ... 137
7.3.1 Participant Recruitment ... 137
7.3.2. Data Visualization Design ... 138
7.3.3 Participant Randomization ... 138
7.3.4 Measures ... 141
7.3.4.1 Comprehension ... 141
7.3.4.2 Health literacy ... 142
7.3.4.3 Hypertension knowledge. ... 142
7.3.4.4 Demographic characteristics ... 142
7.3.5 Data Analysis... 143
7.4 Results ... 144
7.4.1 Sample Demographics and Characteristics ... 144
7.4.2 Regression Results ... 148
7.5 Discussion... 153
7.6 Conclusion ... 159
CHAPTER 8: COMPREHENSION SCALE VALIDATION... 160
8.1 Overview ... 160
8.2 Cognitive Interview Results ... 162
8.3 Principal Components Analysis Results ... 166
8.4 Confirmatory Factor Analysis Results ... 168
8.5 Internal Consistency Reliability Results ... 171
CHAPTER 9: SUMMARY AND DISCUSSION ... 172
9.1 Summary of Findings ... 172
9.2 Implications ... 175
9.2.1 Hypertension Management... 176
9.2.2 Medication Adherence Implications ... 178
9.2.3 Health Literacy... 181
9.2.4 Hypertension Knowledge ... 183
9.2.5 Health Behavior Theory ... 184
9.2.6 Data Visualization Design ... 186
9.2.7 Mobile Apps and Wearable Health Tracking Devices ... 189
9.2.8 Measurement and Other Possible Outcomes ... 189
9.3 Limitations ... 191
9.4 Directions for Future Research ... 195
9.5 Conclusion ... 197
APPENDIX A: USER ASSESSEMNT PROTOCOL ... 199
APPENDIX B: COGNITIVE INTERVIEW PROTOCOL... 220
APPENDIX C: SCREENING AND SURVEY INSTRUMENTS ... 232
REFERENCES ... 263
LIST OF TABLES
Table 2.1 Determinants of medication adherence among patients with
HTN ... 15
Table 2.2 Validated health literacy assessments (<5 minutes) (for English-speaking adults ages 18 to 64) ... 24
Table 2.3 Visualizations methods in medication tracking (n=20) blood pressure monitoring apps (n=20) ... 33
Table 2.4 Data visualization standards and best practices related to medication adherence and BP data visualizations ... 34
Table 4.1 Participant characteristics and demographic variables ... 76
Table 5.1 Visualizations methods in medication tracking (n=20) blood pressure monitoring apps (n=20) ... 99
Table 5.2 Sample characteristics ... 100
Table 5.3 Visualization preferences ... 101
Table 5.4 Inter-coder reliability scores for coding on patient preferences ... 102
Table 5.5 Perceptually distant color preferences and positive/negative associations ... 105
Table 5.6 Perceptually distant symbol preferences and positive/negative associations ... 106
Table 6.1 Sample characteristics ... 123
Table 6.2 Understanding of graph features for graphs 1, 2, and 3 ... 124
Table 6.3 Inter-coder reliability scores ... 125
Table 7.1 Participant demographics ... 146
Table 7.2 Participant characteristics ... 148
Table 7.3 Model effects and p-values ... 150
Table 7.4 Mean differences in comprehension for visualization type by experimental group ... 151 Table 7.5 Mean differences in comprehension for visualization type by
Table 7.6 Mean differences in comprehension for LU, HU, LC, and HC... 152
Table 8.1 Sample characteristics ... 163
Table 8.2 PCA factor loadings for LU measure ... 166
Table 8.3 PCA factor loadings for HU measure ... 167
Table 8.4 Actual and simulated eigenvalues for LU and HU measures ... 167
Table 8.5 CFA factor loadings and variance explained for LU, HU, LC, and HC models ... 169
Table 8.6 Model fit statistics for 6, 5, and 4-item LC and HC models ... 171
LIST OF FIGURES
Figure 2.1 Hypothesized influence of visualization comprehension on
concepts of the Health Belief Model ... 18
Figure 2.2 Hypothesized influence of visualization comprehension on concepts of self-regulation of hypertension management behaviors ... 20
Figure 2.3 Reordered Tableau shape and color palettes to show perceptual distance128... 37
Figure 2.4 Conceptual model ... 42
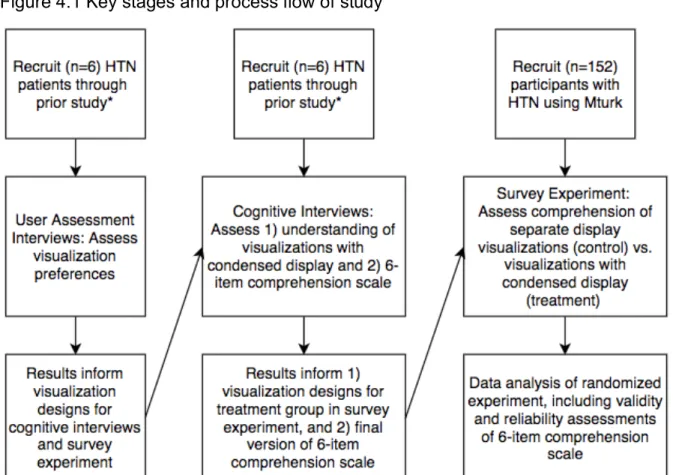
Figure 4.1 Key stages and process flow of study ... 48
Figure 4.2 Example of perceptually distant color-coding ... 50
Figure 4.3 Perceptually distant color pairs ... 57
Figure 4.4 Perceptually distant symbol pair ... 58
Figure 4.5 Graph without labeled data points ... 59
Figure 4.6 Graph with labeled data points ... 59
Figure 4.7 Graph with horizontal reference lines ... 60
Figure 4.8 Graph with vertical reference lines ... 60
Figure 4.9 Graph with reference gridlines ... 61
Figure 4.10 Graph with shaded regions indicating the range for controlled BP ... 61
Figure 4.11 Graph using color-coded lines to show medication adherence ... 62
Figure 4.12 Graph using shaded region to show medication adherence ... 63
Figure 4.13 Graph using symbols on the line to show medication adherence ... 63
Figure 4.14 Graph using symbols below the line to show medication adherence ... 64
Figure 4.15 Graph using symbols along the x-axis to show medication adherence ... 64
Figure 4.17 Path diagrams for the hypothesized unidimensional
solution for visualization comprehension ... 82
Figure 4.18 Path diagram for alternative 2-factor solution for visualization comprehension ... 82
Figure 4.19 Path diagrams and equations for Λ and Σεε for the 6-item comprehension scale ... 85
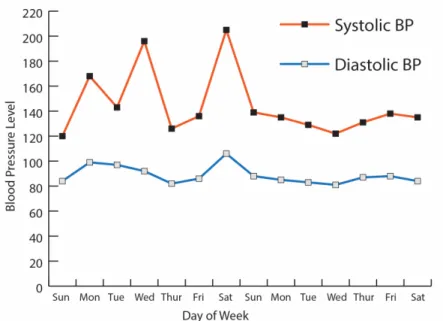
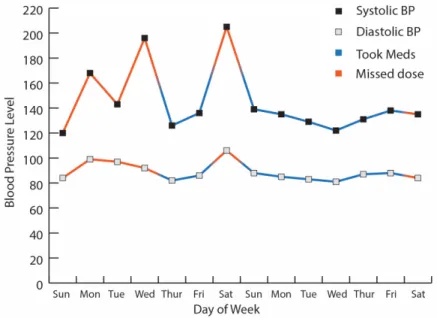
Figure 5.1 Line graph with controlled BP zone ... 96
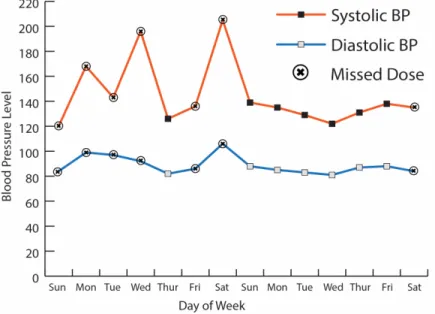
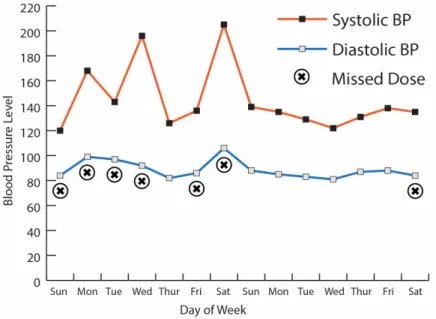
Figure 5.2 Line graph with symbols indicating medication adherence ... 96
Figure 5.3 Line graph with color-coded lines indicating medication adherence ... 97
Figure 5.4 Line graph with shaded region to show medication adherence ... 98
Figure 6.1 Graph 1 with horizontal reference lines ... 119
Figure 6.2 Graph 2 with shaded normal BP zone ... 119
Figure 6.3 Graph 3 with labeled BP data points ... 120
Figure 7.1 Condensed display for BP and medication adherence ... 139
Figure 7.2 Separate display for BP and medication adherence ... 140
Figure 7.3 Participant randomization process ... 141
Figure 8.1 Path diagrams for the hypothesized unidimensional solution for visualization comprehension ... 161
Figure 8.2 Path diagram for alternative 2-factor solution for visualization comprehension ... 162
LIST OF ABBREVIATIONS AND SYMBOLS
α Intercept
β Parameter estimate
BIC Bayesian Information Criterion BP Blood pressure
CFA Confirmatory Factor Analysis DBP Diastolic blood pressure
𝛆 Error
Σ Covariance matrix
EFA Exploratory Factor Analysis HIT Human Intelligence Task
HLSI-SF Health Literacy Survey Instrument Short Form HTN Hypertension
IFI Incremental Fit Index
Λ Factor loading
Mturk Mechanical Turk
REALM Rapid Estimate of Adult Literacy in Medicine RMSEA Root Mean Square Error of Approximation RNI Relative Non-centrality Index
SDP Systolic blood pressure TLI Tucker-Lewis Index χ2 Chi-square statistic VIF Variance inflation factor
CHAPTER 1: INTRODUCTION 1.1 Problem Statement
Hypertension (HTN) is a chronic condition characterized by elevated blood pressure (BP), which over time can cause other issues such as coronary artery disease and even potentially deadly acute conditions such as heart attack and stroke. Hypertension affects nearly half (46%) of adults in the U.S. and is associated with $46 billion in health care costs, medication costs, and missed days of work.1,2 What makes HTN particularly dangerous, and why it is referred to as a “silent killer,”
is that patients often overlook symptoms of high BP or are asymptomatic, which makes self-monitoring (personal tracking of one’s own BP levels) of BP essential to management of disease.
Medication non-adherence among patients with HTN is important because it has direct negative impacts on health outcomes, increases mortality, and contributes to $290 billion in costs to the U.S. health care system each year.3 It is estimated that approximately 45% of patients prescribed at least one anti-hypertensive medication discontinue their medication within a year of initial prescription.4 There are numerous determinants of non-adherence among patients with HTN, including age,5–7 race,6,8 health literacy,8–10 knowledge about their condition,11,12 a history of prior
prescriptions for HTN,7 knowledge about the prescribed treatment (e.g., the duration of treatment, the reason for the medication),11 and length of diagnosis.5,11
Having more HTN knowledge is significantly associated with increased medication adherence, and understanding the effects of one’s treatment is an important component of HTN knowledge.11,13,14 Knowledge about health conditions (i.e., HTN knowledge) likely influences outcome expectations (i.e., the belief that a behavior will lead to a particular outcome) as well as one’s characterization of
observations about their disease. Several existing health behavior theories can help understand the likely causal mechanism linking HTN knowledge to medication adherence. For instance, the Health Belief Model posits that both perceived severity of an illness and perceived benefits of a treatment improve medication adherence,15 and these relationships have been shown among patients with HTN.16,17 Similarly, within Social Cognitive Theory,18 self-regulation of chronic disease relies on a process where outcome expectations are influenced by the self-observations and self-judgments that one makes during the course of disease self-management.19 Information and knowledge gained by self-monitoring likely influence outcome expectations. With many current technology-based self-monitoring tools, such as mobile apps and web-based patient portals, such information allows individuals to see how outcomes are tied to behaviors (e.g., medication adherence influencing BP control), which facilitates self-observation. These visual pieces of information are often communicated using data visualizations.
Tufte defines visualizations as visual displays of “measured quantities by use of points, lines, a coordinate system, numbers, symbols, words, shading, and
color.”20 In other words, data visualizations are abstract representations of numbers, variables, and relationships between numbers and/or variables. Data visualizations
are tools we use to make better sense of complex information in ways that harness our visuospatial sense. For HTN self-monitoring, disease information can be
conveyed using data visualizations that display medication adherence and BP information. It follows that visualizations displaying medication adherence and BP information could influence HTN patients’ knowledge levels and outcomes.
Mobile applications (apps) to self-monitor HTN and medication adherence are increasingly accessible. The most recent estimates indicate that 77% of U.S. adults own a smartphone.21 Furthermore, among patients with HTN, mobile self-monitoring of BP and medication adherence have been shown to improve BP control.22–25
Several apps are now available for HTN and medication adherence self-monitoring;
approximately 18% provide visual feedback.26
Information visualizations within apps are often intended to convey data back to the patient, which is an important aspect of self-monitoring. However, patient comprehension of information visualizations may be suboptimal since over a third of adults lack sufficient health literacy to perform common tasks such as following prescription drug label directions or making simple calculations from a chart.51 In addition, visual short-term memory or one’s capacity to store visualized information then recall it seconds or minutes later, can limit patients’ ability to interpret
visualizations of health data.Evidence indicates the volume of information presented to patients affects health-related decision-making in that highlighting important information and removing less important information reduces cognitive load, resulting in improved health-related decision-making.27 However, it is currently unknown how the visual presentation of such information (e.g., types of data
visualizations) affects health behaviors, particularly HTN patients’ ability to interpret, understand, and respond to BP and medication adherence feedback.
1.2 Study Aims
This dissertation addresses an important gap in the health behavior,
medication adherence, and information visualization literature by examining how to optimally display medication adherence and BP information in data visualizations to promote patient comprehension of the information. This project has three specific aims:
Specific Aim 1: To assess: a) patient preferences for data visualizations that
display medication adherence and BP data and to document how patients would use visualizations to self-monitor their HTN, b) patient preferences for visualizations that condense the display of BP and adherence information, and c) patient
understanding of key features of visualizations that display BP and adherence information.
Specific Aim 2: To conduct a randomized experiment to assess whether visualizations that condense the display of information improve patient
comprehension of BP and adherence data and evaluate whether health literacy moderates the relationship between visualization type and patient comprehension.
Specific Aim 3: To assess the validity and reliability of a newly-developed 6-item scale to assess patient comprehension of data visualizations.
In order to achieve these aims, I first conducted user assessment interviews with HTN patients to elicit overall preferences related to visualizations for BP and medication adherence information. Results from these interviews were used to
survey experiment portions of this study. I then conducted cognitive interviews that assessed patient understanding of key features of three visualizations that
condensed the display of BP and medication adherence information. The best performing condensed visualization from the cognitive interviews was used as the treatment group visualization design for the subsequent survey experiment. As part of the cognitive interviews, I also assessed the reliability, face validity, and construct validity of a new 6-item scale I developed to assess comprehension of medication adherence and BP information visualizations. Finally, I conducted a randomized experiment to test whether information visualizations that condense the display of BP and medication adherence information improve patient comprehension in comparison to separate visualizations for displaying BP and medication adherence information. Data was analyzed using SAS Version 9.4, and R Lavaan structural equation modeling package.
1.3 Organization of the Dissertation
This dissertation comprises nine chapters. The second chapter provides a review of the literature and describes the background and significance for this study.
The third chapter presents the study’s three specific aims and the accompanying research questions and relevant hypotheses. The fourth chapter provides an overview of the methods that used to complete Aims 1 through 3, which included user assessment interviews, cognitive interviews, a randomized experiment, and factor analysis. The results of Aims 1 through 3 are summarized in three separate manuscripts (Chapters 5 through 7) and a chapter dedicated to describing the validation procedure for the comprehension scale (Chapter 8). Chapter 5
Chapter 6 (Manuscript #2) summarizes the results of cognitive interviews related to information visualizations, and Chapter 7 (Manuscript #3) reports the results of the randomized experiment. Detailed validity and reliability data for the 6-item
comprehension scale validity assessment are presented in Chapter 8. Additional data analyses not included in the manuscripts are included in Chapter 8 as well. The last chapter (Chapter 9) is a discussion of the overall results and directions for future research. Lastly, the appendices include all study materials, including user
assessment and cognitive interview protocols, the web-survey instrument, and all visualizations used in this project.
CHAPTER 2: BACKGROUND AND SIGNIFICANCE 2.1 Introduction
In this chapter, I begin by providing background information on hypertension (HTN), including its prevalence and the characteristics of people with hypertension, the risks of hypertension, and the behaviors associated with developing and
managing hypertension. I then discuss three models of health behavior (the Health Belief Model, Social Cognitive Theory and a model of self-regulation for control of chronic diseases, and the Theory of Planned Behavior), and how knowledge obtained via HTN self-management influences certain key constructs of these models. I then provide a review of medication adherence and the factors associated with medication adherence among people with hypertension. One important factor of hypertension medication adherence and self-monitoring related to the current study is health literacy and numeracy, which I review in detail.
Because this dissertation focuses on the ability of hypertension patients to comprehend information visualizations related to BP and medication adherence, I next review the literature on visual short-term memory and cognitive capacity for comprehending visual information. I then discuss mobile health and wearable technologies for self-managing BP and medication adherence, as well as best practices for designing information visualizations and whether these are adhered to in current publicly available mobile apps for BP and medication adherence
monitoring. Finally, I provide a synthesis whereby I propose a conceptual model to
demonstrate how information visualization designs can influence theoretical
pathways of self-regulation for patients using mobile and wearable technologies to self-monitor their BP and medication adherence.
2.2 Hypertension
Surveillance definitions of hypertension (HTN) or high blood pressure vary, however, prior to the release of new HTN guidelines by the American Heart
Association in November 201728 accepted standard definitions of HTN included: 1) systolic blood pressure (SBP) ≥ 140 mmHg or diastolic blood pressure (DBP) ≥ 90 mmHg,29 2) taking any antihypertensive medication, or 3) being told by a physician or other health professional that one has HTN on at least two occasions.1,30
According to accepted standard definitions for HTN prior to the release of the new guidelines, HTN affects approximately 75 million (32%) adults over 20 years of age in the U.S., and disproportionally affects older (≥ 65 years of age) women (57%) more than older men (54%),31 and Blacks (42.1%) more than non-Hispanic Whites (28%) and Hispanics (24.7%).32 According to new HTN guidelines, 46% of adults over 20 years of age in the U.S. have HTN.28
In 2011, the annual cost of HTN to the U.S. healthcare system was over $46 billion, and projections indicate these costs could climb to $274 billion by 2030.29 Hypertension also contributed to over 360,000 deaths in the U.S. in 2013, many of which are a result of a heart attack, stroke, heart failure, or kidney disease.29 Many of these deaths, however, are avoidable, as common risk factors for HTN are linked to health-related behaviors, including non-adherence to antihypertensive
medications, inadequate self-monitoring of BP, poor diet, tobacco use, and lack of
race,32 ethnicity,32 age,32 and sex are also linked to a higher risk of HTN.29 For those diagnosed with HTN, altering lifestyle behaviors makes it a manageable condition.
Unfortunately, only about half (54%) of people with HTN have their condition under control.29 Two major contributing factors to wide-spread uncontrolled HTN is lack of adherence to antihypertensive medication and insufficient monitoring of one’s condition.29 In fact, one study has shown that approximately half (45%) of patients with hypertension stop taking their medication within the first year.33
Among hypertensive adults in the U.S., 77.3% use at least one
antihypertensive drug, and 47.7% use 2 or more antihypertensive drugs (i.e., polytherapy) to treat their condition.34 Overall, 35.8% of adults with HTN use diuretics (90.8% of which are used in polytherapy), 27.6% use thiazide diuretics (90.9% of which are used in polytherapy), 31.9% use β-blockers (81.2% of which are used in polytherapy), 20.9% use calcium channel blockers (82.2% of which are used in polytherapy), 33.3% use angiotensin-converting enzyme inhibitors (67.0% of which are used in polytherapy), and 22.2% use angiotensin receptor blockers (72.5% of which are used in polytherapy).34
2.2.1 Hypertension Self-Management
Self-management of HTN, including self-monitoring of BP and medication adherence, can lead to improved BP levels.22–25 Despite the evidence, self-
monitoring is underutilized by patients with HTN.35 In a 2012 survey of 559 patients with HTN, just over half (54%) reported using a home BP monitor.36
2.2.1.1 Physicians and Hypertension Self-Management
Physicians play a key role in encouraging patients to self-monitor their BP, and reviews have found that interventions involving physicians (e.g., through physician-led patient education or recommendations to self-monitor HTN) when combined with self-management interventions lead to improved BP control.25,37 However, in a 2008 survey of 5 patients with HTN, just 35% of those patients recalled a doctor ever recommending the use of a home BP monitor.35
2.2.1.2 Technology and Hypertension Self-Management
The use of technology in self-management of HTN has also been shown to improve BP control.38 In a 2016 review of seven digital technology-based
interventions to promote HTN self-management, five studies used various self- monitoring technologies, including a website (one study), a mobile phone (three studies), and contact via telephone (one study).38 In another review of 12
technology-based HTN self-management interventions in primary care settings, four interventions used the Internet for telemonitoring, three used a telephone, one used a kiosk, and one used an online patient portal and personal health record.37 When comparing interventions incorporating self-monitoring to no self-monitoring, there was a significant effect of self-monitoring on improving diastolic BP, but not systolic BP.38 However, these results should be interpreted with caution as they are based on findings from just seven studies. Other effective patient-focused intervention techniques to improve self-management of HTN have included patient education, counseling, and appointment reminders.25 Unfortunately, many technology-based interventions are not based on theories of behavior change, which could limit their
effectiveness at causing long-term meaningful change in BP monitoring and patient clinical outcomes.
2.3 Medication Adherence
Medication non-adherence is important because it has direct negative impacts on health outcomes, increases mortality, and contributes to $290 billion in costs to the U.S. healthcare system each year.3 Although average adherence to treatments (medication and otherwise) for cardiovascular diseases averages 76.6%,39 estimates of medication adherence among patients with hypertension is still low. Among patients with HTN, 43% to 65.5% of are non-adherent to their medication.40,41 Such medication non-adherence among patients with hypertension contributes to over $46 billion in avoidable HTN-related healthcare costs annually.29 There are numerous determinants of non-adherence that span all levels of a social ecological framework, ranging from intra-personal factors to institutional and policy-level factors.42 The World Health Organization (WHO) categorizes medication non-adherence into five dimensions: 1) patient-related factors (e.g., patient health literacy, self-efficacy, treatment outcome expectations), 2) condition-related factors (e.g., severity of symptoms, priority among comorbidities), 3) therapy-related factors (e.g., previous treatment failures, side effects), 4) social and economic factors (e.g., cost of medication, lack of social support, socio-economic status), and 5) health system and healthcare team factors (e.g., patient-provider communication, lack of knowledge and training of healthcare providers).42 Studies have suggested all five of these dimensions are determinants of non-adherence among patients with
hypertension.4,8,9,11,12,33,43–48 Table 2.1 summarizes these dimensions and studies
that have shown their influence on medication adherence among patients with HTN.
I will now describe these studies in greater detail.
2.3.1 Patient-related Factors
Patient-related factors that influence medication adherence include
characteristics of the patient. Patient-related factors associated with poor medication adherence among patients with hypertension include age (being younger),5–7,48 gender (male),48 race (non-White),6,8,48 higher body mass index (BMI),6,48 having comorbities,7,48 having a mental illness,48 substance abuse,48 less perceived control over their condition,44 lower health literacy,8–10 less knowledge about their
condition,11,12 a history of previous treatments for HTN (fewer previous treatments),7 and less knowledge about the prescribed treatment (e.g., the duration of treatment, the reason for the medication),11 and more emergency room and hospital visits.48 Medication discontinuation is also associated with a patient’s ability to accurately and consistently adhere to a prescribed regimen on a daily basis.33
2.3.2 Condition-related Factors
Condition-related factors that can impact medication adherence include the severity of one’s symptoms and perceived importance of addressing such
symptoms. The duration of HTN diagnosis is associated with adherence,34 and having HTN for five or more years has been associated with greater adherence.11 2.3.3 Therapy-related Factors
Therapy-related factors associated with medication adherence include the side effects of certain medications or previous treatment failures, which can be a result of the specific medication. Evidence suggests that more complex medication
hypertension.4,5,8 Differences in adherence to antihypertensive medication has also been shown between types of medications (e.g., calcium channel blocker versus angiotensin-converting enzyme inhibitor),45,46 which suggests that for some patients, adherence could be influenced by unique factors associated with a medication (e.g., side effects, cost, dosing frequency, and polytherapy). Unfortunately, these studies only assessed differences in types of medication, and not other factors that may have influenced adherence, such as cost, side effects, or dosing frequency.
2.3.4 Social and Economic Factors
Social and economic factors that influence medication adherence including factors such as socioeconomic status (e.g., income, education), social environment (e.g., support from family and friends), physical environment (e.g., geographic proximity to healthcare facilities and resources), culture and beliefs about illnesses and healthcare, and financial access to healthcare. More social support5,9 and higher household5 income have also been shown to increase adherence to anti-
hypertensive medications. More specifically, a meta-analysis of 32 peer-reviewed articles found functional social support, such as emotional, instrumental, and
informative support is associated with better medication adherence among patients with HTN.47 Culturally-driven beliefs about treatments have also been shown to influence medication adherence among patients with HTN.9 It is important to note that there are no known studies that have linked an underlying latent construct of socioeconomic status (i.e., using factor analysis) to poor adherence; however, income (a component of socioeconomic status constructs) has been linked to poor adherence.5 Poor adherence among individuals with more complex medication
drug costs, and research has shown that increased copayments for lipid-lowering medication lowers adherence significantly more for patients with a higher cost burden (e.g., paying copayments for all drugs, some drugs, with a payment cap, or no copayment).49
2.3.5 Health System and Healthcare Factors
Healthcare providers and the broader health delivery system have been identified as important factors in medication adherence by the WHO.42 These factors are often assessed through associations between clinicians’ interactions with
patients and health behaviors (i.e., medication adherence). In a 2010 Cochrane review of interventions used for improving BP control among patients with hypertension, four studies were identified that involved clinician involvement in patient education or monitoring and resulted in improved medication adherence.25 In addition, a 2015 study was able to show improved adherence to antihypertensive and lipid-lowering agents as a result of a multi-faceted pharmacist-led intervention consisting of collaborative care, medication review, and tailored adherence
counseling with motivational interviewing and telephone follow-ups.43 Results indicated significantly less non-adherence among patients in the intervention group (n = 231, 20.3%) compared to the control group (n = 285, 30.2%).43
Table 2.1 Determinants of medication adherence among patients with HTN
Citation WHO Adherence- related Factor(s)
Specific Factor(s) Study
Population (n) Study Design
Vrijens et al (2008)33
Patient-related Ability to adhere daily (effect on medication discontinuation)
HTN Patients (n=4783)
Retrospective Cohort Patel &
Taylor (2002)44
Patient-related Perceived Control of HTN HTN Patients
(n=240) Cross-
sectional Bailey et al
(2012)48 Patient-related Gender, Age, Race, Obesity, Mental Illness, Substance Abuse, Comorbidities, ER and Hospital Visits
Medicaid HTN Patients (n=49,479)
Cross- sectional
Malik et al
(2014)12 Patient-related HTN Knowledge HTN Patients
(n=209) Cross-
sectional Krousel-wood
et al (2009)6 Patient-related Age/Race/BMI HTN Patients
(n=2,087) Cross- sectional Briesacher et
al (2008)7 Patient-related Age, Comorbidities, History of trying other drugs to treat HTN
HTN Patients
(n=457,395) Retrospective Cohort Karaeren et
al (2009)11 Patient,
Condition-related HTN Knowledge, Length
of Diagnosis HTN Patients
(n=220) Cross-
sectional Ma (2016)5 Patient-related,
Condition- related, Therapy- related, Social, and Economic- related
Age/Income, Length of Diagnosis, Pill Regimen Complexity, Social Support
HTN Patients
(n=1,159) Cross- sectional
Wannasirikul et al (2016)9
Patient-related, Social, and Economic- related
Health Literacy, Social Support/Beliefs about Treatment
HTN Patients 60 to 70 years old (n=600)
Cross- sectional
Gazmararien (2006)8
Patient-related, Therapy-related
Race/Ethnicity,
Education/Health Literacy, Pill Regimen Complexity
Patients with coronary heart disease, HTN, diabetes mellitus, and/or hyperlipidemia (n=1,549)
Cross- sectional
Wogen et al
(2003)45 Therapy-related Type of Medication HTN Patients
(n=142,945) Retrospective Cohort Xie et al
(2014)4
Therapy-related Pill Regimen Complexity HTN Patients (n=17,465)
Retrospective Cohort Magrin et al
(2014)47 Social and Economic- related
Social Support Social support and medication adherence literature (n=32 journal articles)
Meta-analysis
Hedegaard et
al (2015)43 Health System
and Healthcare Healthcare (Pharmacist-
led motivational HTN Patients
(n=532) RCT
(Intervention)
2.4 Theories of Health Behavior
To understand how improving comprehension of medication adherence and BP information may lead to improved outcomes (e.g., improved medication
adherence or BP control), it is important to understand how comprehension, or the knowledge gained by facilitating comprehension, are related to factors known to influence health behaviors. I have identified two theories of health behavior where comprehension of medication adherence and BP information could play an important role in influencing medication adherence: the Health Belief Model and the process of self-regulation within Social Cognitive Theory.
2.4.1 Health Belief Model
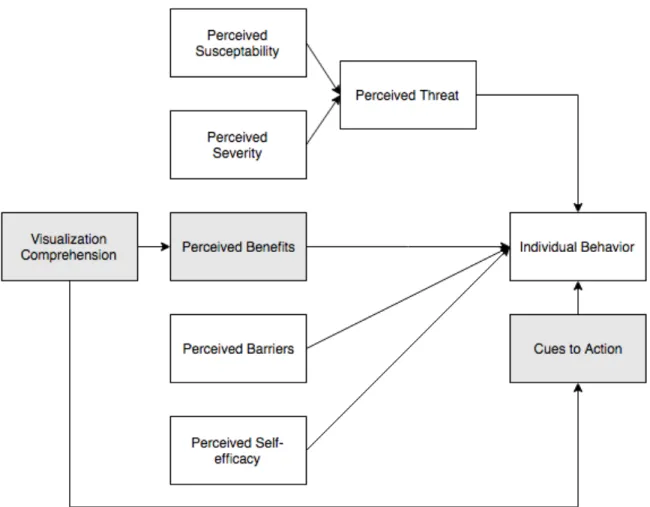
The Health Belief Model (HBM) posits that certain personal perceptions and cues to action influence individual behaviors, including disease self-management behaviors.15 According to the HBM, the personal perceptions that influence behaviors are: 1) perceived susceptibility, or beliefs about one’s vulnerability to a disease or condition, 2) perceived severity, or beliefs about the seriousness and consequences of a disease or condition, 3) perceived benefits, or beliefs about the value (personal or otherwise) of behaving in a way that reduces the perceived threat of a disease or condition, 4) perceived barriers, or beliefs about the impediments to performing a particular health behavior, and 5) perceived self-efficacy or the belief that one is able to successfully perform a particular health behavior and produce desired results. Perceptions of susceptibility and severity influence a broader
construct of perceived threat, which in turn influences behaviors. In addition, cues to action, or personal and environmental stimuli that trigger behaviors, are said to
Perceptions of the benefits of performing a behavior (e.g., taking medication) are shaped by one’s understanding of HTN and the behaviors that can influence HTN outcomes. Visualizations of medication adherence and BP information attempt to enhance understanding about the benefits of adherence depicting the correlation between adherence and BP control (i.e., high adherence leads to controlled BP).
Data visualizations can also serve as cues to action by providing information about missed doses of medication. This hypothesized relationship is shown in Figure 2.1.
Research has linked constructs of the HBM to medication adherence among patients with HTN.16,17 In one cross-sectional study of 671 rural-dwelling Iranians with hypertension, individuals with high levels of perceived susceptibility, severity, and benefits had better medication adherence than those with low to moderate perceived susceptibility, severity, and benefits.16 In another cross-sectional study of 232 Chinese hypertensive patients, higher perceived susceptibility, cues to action, and self-efficacy, and lower perceived barriers were associated with better
medication adherence.17 In addition, while not explicitly measured as perceived severity or perceived benefits, one study of 514 HTN patients showed that patients who believed in the necessity of a medication were more likely to be compliant.50
Figure 2.1 Hypothesized influence of visualization comprehension on concepts of the Health Belief Model*
*Gray boxes indicate theoretical constructs that could be affected by visualization comprehension.
2.4.2 Social Cognitive Theory
Social Cognitive Theory (SCT) posits that people interact with their environments in a reciprocal manner, or that people both influence and are
influenced by their environments.18 Several variables affect the interaction between individuals or groups and their environments, including: 1) outcome expectations, or beliefs about the consequences of behavior choices, 2) self-efficacy or the extent to which one believes one has the ability to perform specific behaviors, 3)
incentive motivation or the use of rewards or punishments to influence behavior, 5) facilitation, or the use of resources to make behaviors easier to perform, and 6) self- regulation or one’s ability to influence one’s behavior through self-monitoring, goal- setting, feedback, self-reward, and self-instruction.
As it relates to the comprehension of visualizations of medication adherence and BP information, understanding such information is an important component of outcome expectations and self-regulation. Understanding how behaviors influence outcomes (e.g., adhering to medication improves BP control) can affect what
outcomes one can expect from a behavior. Thus, improving one’s understanding of a visualization that displays the correlation between adhering to medication and controlling BP can influence patients’ expectations of what specific outcomes are associated with a behavior. For example, patients relying on their own physical experiences to determine the effectiveness of a medication might improve their understanding that medication adherence improves BP control when that relationship is visualized in a graph.
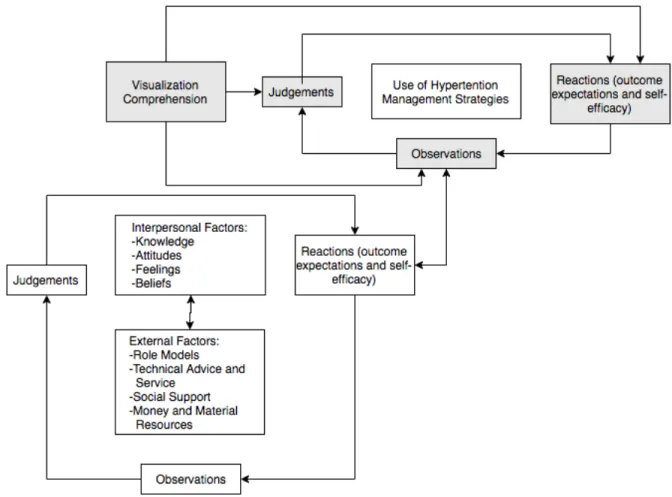
Clark and colleagues’ model of the self-regulation of chronic diseases, based in SCT,18 suggests self-regulation of chronic conditions occurs through a process of reciprocal determinism, where outcome expectations (i.e., perceptions about the consequences of a behavior associated with managing one’s condition) are made based on judgments (i.e., decisions made about one’s illness), which are based on observations (i.e., actively monitoring changes in one’s condition).19 The
observations made during this disease self-management process then influence and are also influenced by the outcome expectations produced through a similar
reciprocal determinism whereby outcome expectations, observations, and judgments are made in the context of interpersonal and external factors. This hypothesized process is shown in Figure 2.2. Comprehension of medication adherence and BP information visualizations is also an important component of self-regulation in that making accurate observations during self-monitoring of one’s condition requires an understanding of the current condition (e.g., BP level) and the factors influencing the condition (e.g., medication adherence).
Figure 2.2 Hypothesized influence of visualization comprehension on concepts of self-regulation of hypertension management behaviors*
*Gray boxes indicate theoretical constructs that could be affected by visualization comprehension.
Components of self-regulation have been used in interventions for chronic health conditions, including obesity, diabetes, heart disease, arthritis, and asthma.51 In a review of self-monitoring interventions, all 35 interventions provided feedback to patients about their self-monitoring behaviors.51 Unfortunately, the effectiveness of each intervention on improving health outcomes (e.g., medication adherence or BP) was not assessed. Previous studies have linked SCT to improved medication
adherence.52 In a meta-analysis of SCT-based interventions designed to improve medication adherence, an overall significant effect size (.350, p<.001) for improving medication adherence was found among 18 total treatment versus control group comparisons.52 Studies linking concepts of SCT to HTN self-management are limited, although self-regulating behaviors have been linked to one’s understanding of HTN and the factors that influence elevated BP.53
Improving comprehension of information visualizations for medication adherence and BP may play an important role in improving medication adherence and BP control. It is likely that several factors shape health behaviors and more distal health outcomes are influenced themselves through improved comprehension.
It is reasonable to suspect that improving one’s understanding of information about the correlation between medication adherence and blood pressure control leads to improved observations, outcome expectations, and judgments about one’s condition (i.e., seeing the consequences of behaviors and adjusting perceptions of future likely outcomes of a behavior), and more accurate perceptions of benefits to treating one’s condition (i.e., seeing how medication adherence leads to controlled BP), and cues to action (e.g., seeing when a medication dose was missed).
2.5 Health Literacy
The U.S. Department of Health and Human Services defines health literacy as “the ability to obtain, process, and understand basic health information and
services to make appropriate health decisions.”54 Over a third of adults lack sufficient health literacy to perform common tasks such as understanding prescription drug label directions or making simple calculations from a chart.54 Some minority groups are disproportionately affected with poor health literacy with 24% of Blacks and 41%
of Hispanics having below basic health literacy compared to just 9% of Whites.54 In addition, age and education are associated with health literacy in that those with less education and the elderly (60 and older) have lower health literacy.55 However, when accounting for cognitive ability (as measured as verbal working memory or one’s ability to store and manipulate verbal information simultaneously), the association of age and education with health literacy is reduced. This suggests the importance for future hypertension-related health interventions to focus on the cognitive aspects of information comprehension.55 Several studies have shown an association between health literacy and antihypertensive medication adherence8–10 and BP control9,56–60 among patients with hypertension. In addition, evidence suggests that health literacy is a mediating factor between demographic characteristics (e.g., financial status, race, and education) and health information recall (e.g., remembering instructions from a physician, and remembering names of prescribed medications),61,62 which is important in hypertension self-management.
2.6 Numeracy and Graph Literacy
An individual’s ability to interpret health-related information (such as medication adherence and BP information) extends beyond health literacy.
Numeracy is a person’s ability to comprehend and use numbers. Graph literacy is the ability to process and understand information conveyed in two-dimensional images, often charts, graphs, diagrams, or maps. Both numeracy and graph literacy are important patient characteristics to consider when developing information
visualizations intended to help patients manage their hypertension. Patients with high numeracy tend to better understand,63 remember, and use quantitative information when making health-related decisions, whereas their lower-numerate counterparts tend to rely on non-quantitative information, such as narratives and emotions.64–66 Furthermore, studies suggest that among older adults, health literacy and numeracy independently affect poor health performance.67 In addition, graph literacy and numeracy have been shown to be moderately correlated (r=.37),68 which further supports the notion that patients with high health literacy and low numeracy may be less likely to rely on numeric charts and graphs for managing their
hypertension.
2.7 Hypertension Knowledge
In addition to literacy and numeracy, insufficient HTN knowledge, defined as the understanding of the meaning, treatments, seriousness, and management behaviors of HTN, may negatively affect visualization comprehension. Specifically, low HTN knowledge may affect: 1) a patient’s ability to comprehend medication adherence and BP information visualizations since familiarity with the content
visualization,69 and 2) a patient’s ability to make health-related and medication related decisions,70–73 which is understandable considering health literacy mediates the relationship between education and hypertension knowledge.74 There are no known studies that have directly linked numeracy and graph literacy to HTN knowledge.
2.8 Assessing Health Literacy
There are several validated scales for assessing health literacy among the general English-speaking adult population.75–81 However, there are limitations for each assessment that affect the appropriateness of the use of each scale given the context in which it is to be administered (e.g., number of items, timing, administration mode, population in which it was validated, domains assessed). Table 2.2
summarizes important considerations for validated health literacy scales with an administration time of five minutes or less from the Health Literacy Tool Shed.82
Table 2.2 Validated health literacy assessments (<5 minutes) (for English-speaking adults ages 18 to 64)
Scale Domains
Assessed
Items Length (minutes)
Mode(s) Brief Health Literacy Screener75 Information
Seeking
3 1.5 Face-to-face
Health Literacy Skills
Instrument - Short Form (HLSI- SF)76
Numeracy, Information Seeking, Communication, Prose
10 5 Face-to-face,
self-
administered, online Medical Term Recognition Test
(METER)77 Prose 40 2 Face-to-face,
Paper and Pencil Newest Vital Sign (NVS)78 Prose, Numeracy 6 3 Face-to-face Rapid Estimate of Adult
Literacy in Medicine (REALM)79,80
Prose 125 2.5 Face-to-face,
Phone
Single Item Screener (SILS)81 Prose 1 1 Face-to-face
2.9 Health Literacy and Visual Short-term Memory
There is no known research that specifically assesses the relationship between literacy and visual-short term memory (i.e., one’s ability to store and recall visual information seconds or minutes later). However, health literacy has been shown to be strongly correlated with related cognitive abilities, including working memory, processing speed, and inductive reasoning.83 It is possible that a link exists between health literacy and visual short-term memory, especially in the context of understanding health information in a graph or chart. If such a link exists, designing information visualizations to reduce demands on visual short-term memory may particularly benefit low health literacy populations.
2.10 Visual Short-term Memory
Tversky and Schiano (1989) first demonstrated that both cognitive and perceptual factors (i.e., how objects are understood to be presented) should be considered in visualization design.84 In a series of experiments, participants were presented with a visualization of a distribution curve plotted on unlabeled x and y axes, asked to study the visualization for 5 seconds, and then draw the curved line from memory. Participant drawings were rated on a 5-point Likert scale (1= drawing much more asymmetric than the stimulus to 5=very much more symmetric) by three independent raters to provide an objective measure of symmetry. Results indicated that memory skews toward symmetry, suggesting that cognitive limitations exist that distort our recall of visual stimuli. In another set of experiments, Carswell et al (1993) tested the extent to which trend reversals, or points in a line graph where direction of the line reverses, affect ability to recall information about a simple line graph.85
limitations prevented participants from making global assessments about an overall trend, and information recall was limited significantly more to specific localized data points or sets of data points instead.85 In other words, overall trends of line graphs were more difficult to assess as the number of changes in the direction of the trend line increased, and participants tended to focus on specific points or more local areas of the trend line rather than overall trends as a result. This suggests graphs displaying BP information should limit the number of data points because several trend reversals in BP may decrease one’s ability to detect an overall trend.
Visual short-term memory (VSTM) is a subsystem that performs under the general working memory, which is the central executive system that allows for
complex tasks (e.g., comprehension, reasoning, and learning) to be completed while keeping other necessary information to complete such tasks in mind.86 The brain uses VSTM to complete brief tasks requiring the processing of visuospatial
information, such as interpreting the meaning of a graph or chart.87 Experiments in VSTM are often performed by measuring reaction times and accuracy of locating targets, which can be pre-identified (known) or unknown.88–91 Early investigations into VSTM sought to understand whether VSTM functioned under a general working memory framework, or whether the task of processing visuospatial information is conducted under a specialized visuospatial store where visual information is separate from other information stimuli such as audio.88
Logie and colleagues conducted two separate experiments to assess how inserting arithmetic, visual, and verbal secondary tasks within a visuospatial main task influenced visuospatial information recall.88 Participants were asked to recall
verbal or visuospatial information, but were instructed to complete secondary tasks concurrently that were either arithmetic (e.g., calculations), visual (e.g., repeating the movements of a square in a 4x4 matrix), or verbal (e.g., repeating a series of words) in nature. Results indicated support for a specialized visual short-term memory system as the interference, or disruption of memory, caused by interpolated visual secondary tasks, was more prominent among participants completing visual span tasks, and less prominent among participants completing verbal tasks.88 The converse was found for verbal task and the interference introduced by interpolated verbal and visuospatial secondary tasks. Furthermore, inserted arithmetic secondary tasks also presented a small but significant interference in verbal and visuospatial recall tasks.88 These findings support earlier assumptions that VSTM functions under a separate visuospatial information-processing store. Support for a separate
visuospatial information-processing store is important as it suggests visualization design has implications for performing tasks (e.g., self-monitoring BP and
medication adherence) that use visual information. In addition, while the effect is smaller than concurrent visuospatial tasks, concurrent arithmetic tasks limit the functionality of VSTM. This finding is particularly important for visualizations in medication adherence and BP monitoring as concurrent arithmetic and visuospatial information processing tasks are necessary to understand the relationship between changes in medication adherence and possible resultant fluctuations in BP.
Previous research has shown that up to four objects can be reliably stored in VSTM and accurately recalled moments later.90,92,93 However, in regard to
visualizations, this capacity decreases as 1) the number of different features (e.g.,