Standardised uptake values of 2-deoxy-2-[
18
F]fluoro-
d-glucose using PET/CT in normal cats
Y.K. Cho
1, K.C. Lee
21Department of Radiological Technology, Daegu Health College, Daegu, Korea 2College of Veterinary Medicine, Chonbuk National University, Korea
ABSTRACT: In this study we assessed the normal physiological and dynamic thoracoabdominal distribution of
18F fluorodeoxyglucose (18F-FDG) uptake and the standardized uptake values (SUVs) of the major parenchymal
organs in five normal young adult domestic short haired cats. Dynamic PET data were acquired with a transaxial field-of-view (FOV) PET/CT scanner, Regions of interests (ROIs) were manually drawn over the left ventricular free wall, left ventricular blood pool, liver, spleen, and left and right renal cortices. The SUVs of these organs were calculated for 5-min frames over the 90 min acquisition. The uptake of 18F-FDG within the major organs, showed
a tendency to gradually decline, except for the left ventricle and blood pool. The decrease in SUV was rapid after injection with a plateau occurring after 30 minutes. The uptake of 18F -FDG within the hepatic parenchyma was
low compared to that in the kidney at the beginning of study. A steady decline in the hepatic parenchyma SUV was quite similar to that observed for the kidneys .The SUV of 18F-FDG within the spleen was low. Uptake of 18F-FDG within the myocardium was minimal. These SUV data from the parenchymal organs of normal cats
com-pares favourably with those of normal humans and dogs and can be used in feline studies using PET/CT for the evaluation of various diseases. Furthermore, PET/CT can provide higher quality images over shorter examination times than conventional PET.
Keywords: standardised uptake value (SUV), 18F-FDG, cat, PET/CT
List of abbreviations:
18F-FDG = 2-deoxy-2-[18F]fluoro-d-glucose, PET/CT = positron emission tomography/computed tomography,
SUV = standardised uptake value
The positron emission tomography/computed tomography (PET/CT) scanner, in which PET and CT are combined, represents an important devel-opment in the fields of disease phase diagnosis and oncology. This scanner shows high accuracy as the morphologic image and metabolism-functional in-spection PET are confused (Gorospe et al. 2006; Tsukamoto and Ochi 2006).
In the oncology field, the clinical use of PET scan is frequent, and the image of distributed 18F-FDG
is used.
18F-FDG, a glucose analogue, enters cells with
the aid of the glucose transporter proteins GLUT-1 through GLUT-6, and is then phosphorylated (Fowler and Ido 2002).
A large number of malignant tumours exhibit a high number of specialised membrane transport
proteins, and have a greater affinity for glucose than normal cells, thus resulting in an increased glucose flow into cancer cells. Thus, the accu-mulation of 18F-FDG is greater in tumours than
in normal cells.
The intake of 18F-FDG depends on the supply
of blood, the distributed quantity as well as the normal physiological intake of the tumour, and on the competitive intake course in other organs. Furthermore, 18F-FDG intake by tumour tissues
and surrounding healthy tissues depends on the time elapsed after injection (Visser et al. 2008).
The 18F-FDG SUVs of feline heart muscle, liver
and large intestine using PET are already known (LeBlanc et al. 2009).
data using PET/CT, which is improved to allow the obtaining of a more accurate location. Combining PET with CT can more accurately depict the region of interest (ROI), thus resulting in an improved SUV.
Up to now, most PET studies have implemented to-tal body scans. In the selected case, semi-quantitative analysis was implemented, and is based on the calcu-lation of SUVs. These SUVs have become a universal measurement factor that indicates the glucose intake level within organs (Hamberg et al. 1994; Nuutinen et al. 1999; Liu et al. 2001; Abouzied et al. 2005).
This study was carried out to evaluate the impor-tance of dynamic PET/CT in the study of malignant disease with regard to tumour diagnosis and the establishment of appropriate treatment plans. An additional goal of this study was to increase the reliability of SUVs of PET/CT inspection.
In a previous study by our group, only the static data from PET using a cat subject was obtained (LeBlanc et al. 2009). In comparison, the acquisition of dynamic data is more important than that of the static image as it gives important information regarding tracer dis-tribution in time and space. The normal cat intake data is important for appropriate interpretation of
18F-FDG PET/CT scans in clinical situations.
The physiological distributions of malignant tu-mours and normal tracer may cause confusion in positive pathological settings and with malignant tu-mours due to physiological diversity (Abouzied et al. 2005; Gorospe et al. 2006; Tsukamoto and Ochi 2006).
An additional limitation to the previous PET ex-periment by our group was that the subject was im-aged in several positions using a micro PET scanner
with a small field of view (7.8 cm) (LeBlanc et al. 2009).
In the present study, we addressed that limitation by using a scanner with a large field of view (16.2 cm), so we could obtain dynamic data in only one position.
The main purposes of this study were to deter-mine the SUV, the normal physiological
distribu-tion of dynamic thoracoabdominal 18F-FDG in
normal cat organs, and to establish an image pro-tocol for PET/CT using a large field-of-view(FOV) scanner for the investigation of tumour size and for optimisation of treatment plans (Tsukamoto and Ochi 2006; Macapinlac 2008).
MATERIAL AND METHODS
Five young adult domestic short haired cats weigh-ing 3.0 ± 0.5 kg (mean ± SD) and rangweigh-ing in age from 1–2 years (mean ± SD, 1.4 ± 0.5 years) were supplied by the laboratory animal facilities at the Veterinary Medicine Clinic of Chonbuk University. The cats were housed in facilities approved by the Office of Laboratory Animal Care at Chonbuk University.
Physical examinations, thoracoabdominal radiog-raphy, laboratory testing, and abdominal ultrasound examinations were performed on the animals.
The five cats were fasted for 24 h, and were pre-medicated with atropine (0.10 mg i.m.). Anaesthesia was maintained with zoletil (tiletamine + zola- zepam) throughout the procedure.
[image:2.595.65.533.529.692.2]The cats were placed in dorsal recumbency, and positioned within the PET/CT scanner gantry, so
that the entire thorax and abdomen were included within the FOV.
A large FOV, cerium–doped lutetium oxyortho-silicate (LSO:Ce) PET/CT scanner is able to image low levels of radioactivity. Five large panels with an axial dimension of 16.2 cm and a transaxial dimension of 60.5 cm incorporating a total of 24 336. 4 mm × 4 mm × 20 mm LSO crystal elements providing a sen-sitivity of 4.4 cps/kBq were used. A fast LSO crystal for each point source served as a reference detector during the transmission coincidence acquisition (Liu et al. 2001).Two hundred and forty-eight 160 × 160, 3 mm-thick transaxial parallel slices were generated.
After deciding on the scan length, the CT scan (slice thickness 0.5 mm, scan time 25 s) was imple-mented, and dynamic PET (scan time: 90 min) was implemented by list mode.
The mean plasma glucose concentration before
18F-FDG injection was 105 ± 20 mg/dl. The cats
were injected intravenously with 25.9 ± 3.7 MBq (0.7 ± 0.1 mCi) of human-grade 18F-FDG and a
90 min, dynamic list-mode acquisition was initiated simultaneously with the injection.
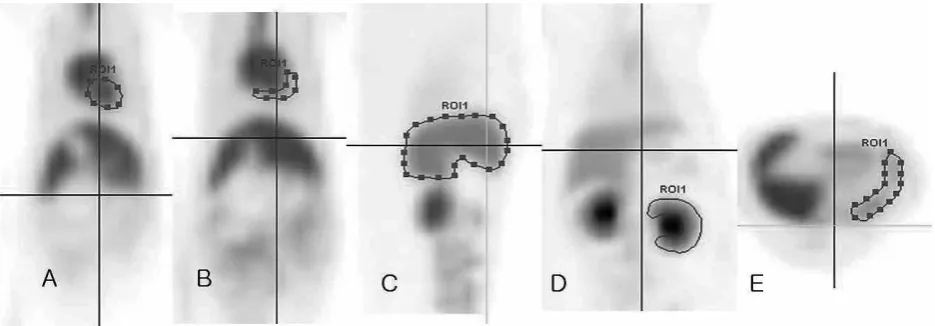
The 18F-FDG uptake was evaluated at the ROI
on the target organs or the uptake sites. The ROIs were manually drawn over the left ventricular free wall, left ventricular blood pool, liver, spleen, and finally, the left and right renal cortices (Figure 1). Particular caution was taken to exclude imaging of renal pelvic uptake due to accumulation of 18F-FDG
for urinary excretion.
The SUV was defined as the average decay-corrected tissue concentration of 18F-FDG, in the
region delineated by the ROIs divided by the ra-dioactivity injected per kilogram of body weight (LeBlanc el al. 2008).
RESULTS
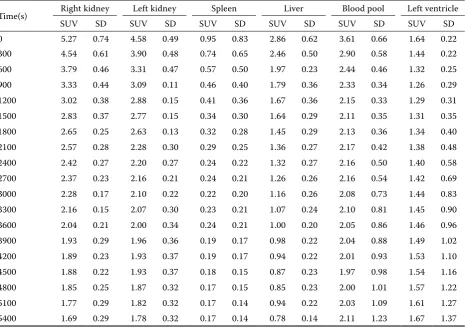
[image:3.595.66.532.428.756.2]In Table 1, each organ shows a high SUV with intravenous injection; however, our data show a gradual decrease with time. The images of the chest and abdomen showed accumulation in most of the small and large intestines except for the lung where only low accumulation was observed.
Table 1. Serial mean standardised uptake values (SUVs) and standard deviations (SD) for the major organs of five normal cats imaged with 18F-FDG PET/CT
Time(s) Right kidney Left kidney Spleen Liver Blood pool Left ventricle
SUV SD SUV SD SUV SD SUV SD SUV SD SUV SD
0 5.27 0.74 4.58 0.49 0.95 0.83 2.86 0.62 3.61 0.66 1.64 0.22
300 4.54 0.61 3.90 0.48 0.74 0.65 2.46 0.50 2.90 0.58 1.44 0.22
600 3.79 0.46 3.31 0.47 0.57 0.50 1.97 0.23 2.44 0.46 1.32 0.25
900 3.33 0.44 3.09 0.11 0.46 0.40 1.79 0.36 2.33 0.34 1.26 0.29
1200 3.02 0.38 2.88 0.15 0.41 0.36 1.67 0.36 2.15 0.33 1.29 0.31
1500 2.83 0.37 2.77 0.15 0.34 0.30 1.64 0.29 2.11 0.35 1.31 0.35
1800 2.65 0.25 2.63 0.13 0.32 0.28 1.45 0.29 2.13 0.36 1.34 0.40
2100 2.57 0.28 2.28 0.30 0.29 0.25 1.36 0.27 2.17 0.42 1.38 0.48
2400 2.42 0.27 2.20 0.27 0.24 0.22 1.32 0.27 2.16 0.50 1.40 0.58
2700 2.37 0.23 2.16 0.21 0.24 0.21 1.26 0.26 2.16 0.54 1.42 0.69
3000 2.28 0.17 2.10 0.22 0.22 0.20 1.16 0.26 2.08 0.73 1.44 0.83
3300 2.16 0.15 2.07 0.30 0.23 0.21 1.07 0.24 2.10 0.81 1.45 0.90
3600 2.04 0.21 2.00 0.34 0.24 0.21 1.00 0.20 2.05 0.86 1.46 0.96
3900 1.93 0.29 1.96 0.36 0.19 0.17 0.98 0.22 2.04 0.88 1.49 1.02
4200 1.89 0.23 1.93 0.37 0.19 0.17 0.94 0.22 2.01 0.93 1.53 1.10
4500 1.88 0.22 1.93 0.37 0.18 0.15 0.87 0.23 1.97 0.98 1.54 1.16
4800 1.85 0.25 1.87 0.32 0.17 0.15 0.85 0.23 2.00 1.01 1.57 1.22
5100 1.77 0.29 1.82 0.32 0.17 0.14 0.94 0.22 2.03 1.09 1.61 1.27
High SUV values in the left and right kidneys, gathered fast to the bladder for excretion to the pelvis of the kidney and the ureter was observed in all images by 90 min.
The uptake of 18F-FDG within both renal cortices
was high at the beginning of acquisition (right kidney: SUV 5.27 ± 0.74, left kidney SUV 4.58 ± 0.49), and those values represented the highest levels observed among the organs examined over all time points.
The decrease in SUV was rapid after injection with a plateau occurring after 30 min (right kidney: 30 min SUV 2.65 ± 0.25, 60 min SUV 2.04 ± 0.21,
90 min SUV 1.69 ± 0.29; left kidney: 30 min SUV 2.63 ± 0.13; 60 min SUV 2.008 ± 0.34, 90 min SUV 1.78 ± 0.32) (Figure 2 and 3).
The uptake of 18F-FDG within the hepatic
pa-renchyma was low at the beginning of acquisition (SUV 2.86 ± 0.62) compared to that in the kidneys.
The steady decline in SUV observed in the hepat-ic parenchyma was quite similar to that observed in the kidneys (30 min SUV 1.45 ± 0.29, 60 min SUV 1.00 ± 0.20, 90 min SUV 0.78 ± 0.14) (Figure 4).
The SUV of 18F-FDG in the spleen was relatively
[image:4.595.63.537.79.341.2]low (injection SUV 1.54 ± 0.83, 30 min SUV 1.04 ±
Figure 2. The time ac- tivity curve of 18F-FDG obtained from the re- gion of interest (ROI) around the blood pool of a cat
Figure 3. The time ac- tivity curve of 18F-FDG obtained from the re- gion of interest (ROI) around the left ventri-cle of a cat
[image:4.595.61.535.507.765.2]Figure 5. The time ac- tivity curve of 18F-FDG obtained from the re- gion of interest (ROI) around the left kidney of a cat
Figure 4. The time ac- tivity curve of 18F-FDG obtained from the re- gion of interest (ROI) around the liver of a cat
0 5 10 15 20 25 30 35 40 45 50 55 60 65 70 75 80 85 90 95 (min)
2.5 2.0 1.5 1.0 0.5 0
SU
V
0 5 10 15 20 25 30 35 40 45 50 55 60 65 70 75 80 85 90 95 (min)
1.8 1.6 1.4 1.2 1.0 0.8 0.6 0.4 0.2 0
SU
V
0 5 10 15 20 25 30 35 40 45 50 55 60 65 70 75 80 85 90 95 (min)
1.8 1.6 1.4 1.2 1.0 0.8 0.6 0.4 0.2 0
SU
V
0 5 10 15 20 25 30 35 40 45 50 55 60 65 70 75 80 85 90 95 (min)
4.0 3.5 3.0 2.5 2.0 1.5 1.0 0.5 0
SU
0.28; 60 min SUV 0.82 ± 0.21, 90 min SUV 0.66 ± 0.14) compared to that of other organs (Figure 5).
The SUV of the left ventricular myocyte was relatively lower than that observed in tissues from other organs. In the case of the left ventricular myo-cytes, the SUV showed a gradual increase in two of the five cats.
Our results regarding 18F-FDG uptake in cat
myo-cytes were mixed. In two animals, the accumula-tion of 18F-FDG in the left ventricular myocytes
showed a gradual decrease with time; however, in one animal, the SUV increased from 1.53 at 0 min to 3.5 at 90 min, while in another animal the value increased from 1.8 at 0 min to 2.2 at 90 min. In the remaining animal, there was an insignificant increase in SUV from 1.6 to 1.68 (Figure 6).
The results regarding the SUV of 18F-FDG in the
left blood pools of the cat were more consistent. Among all five animals, the SUV decreased with time. Interestingly, in the two animals that showed an increase in 18F-FDG SUV in the ventricular
myo-cytes over time, an insignificant decrease in SUV within the left blood pool was observed (Figure 7).
Our findings show that the percent changes in
18F-FDG SUV of the cat organs over time are as
fol-lows: liver 27.3%, from 2.86 to 0.78; spleen-17.9%, from 0.95 to 0.17: right kidney – 32.1%, from 5.27 to 1.69: left kidney – 38.9%, from 4.58 to 1.78. In comparison, the 18F-FDG SUV in dog organs over
time is as follows: liver 44%, spleen 90.7%, right kidney 38.6%, left kidney 38.6%.
When observing the change in 18F-FDG SUV
from 0 to 90 min, the distribution rate for each organ, our data suggest that the 18F-FDG SUV
de-crease rate in the feline is greater than in the dog.
DISCUSSION
PET imaging using 18F-FDG is rapidly gaining a
critical role in the clinical evaluation of patients with cancer. However, PET images lack anatomical landmarks for topographic orientation, and identi-fication of abnormal glucose metabolic activity in regions close to organs with variable physiological
18F-FDG uptake can be difficult.
To overcome these difficulties, a combined PET/CT scanner that acquires both functional PET and CT images has been recently developed, and its use as a diagnostic tool has increased rapidly. Since PET/CT is a combination of PET for functional informa-tion and CT for morphological informainforma-tion, their combination is synergistic.
Generally, most PET imaging data is gained from a static frame. However, dynamic data acquisition is arguably more informative than static images because it provides the tracer distribution in terms of time and space within the ROI.
[image:5.595.61.536.81.353.2]Therefore, it is important to evaluate the quanti-tative accuracy regarding list mode or dynamic PET acquisition before use in clinical and study applica-tions. The SUV is a semi-quantitative value that one
Figure 6. The time ac- tivity curve of 18F-FDG obtained from the re- gion of interest (ROI) around right kidney of a cat
Figure 7. The time ac- tivity curve of 18F-FDG obtained from the re- gion of interest (ROI) around the spleen of a cat
0 5 10 15 20 25 30 35 40 45 50 55 60 65 70 75 80 85 90 95 (min)
6 5 4 3 2 1 0
SU
V
0 5 10 15 20 25 30 35 40 45 50 55 60 65 70 75 80 85 90 95 (min)
1.2 1.0 0.8 0.6 0.4 0.2 0
SU
can easily access whenever PET/CT is performed under physiological or pathologic circumstances (Lindholm et al. 1993; Hamberg et al. 1994).
The SUV depends on acquisition, reorganisation, reconstitution, and ROI parameters. Thus, obtain-ing an accurate SUV requires a clean acquisition standard and analysis protocol.
The results from this study showed that the up-take of 18F-FDG in the stomach and small and large
intestines was variable and characterised by focal or diffuse uptake of 18F-FDG. These results were
simi-lar to results from human and dog studies (Yasuda et al. 1998; Kostakoglu et al. 2004; Rosenbaum et al. 2006). The reason for 18F-FDG uptake into the
digestive organs is not known.
Increases in smooth muscle intake, full energetic mucous membrane in metabolism, or intake by colon bacteria are possible reasons for this phe-nomenon (Abouzied et al. 2005). The lung showed the lowest SUV compared with the other organs, which is consistent with the observation that
18F-FDG does not accumulate in normal lung
tis-sue. However, if lung cancer is present, the SUV will increase due to tumour metabolism (Vansteenkiste et al. 1999; Weber et al. 2000; Lee et al. 2010).
The average SUV for the kidney, liver, and spleen
obtained 60 min post-18F-FDG injection into
healthy humans was 2.33, 2.17, and 1.65, respec-tively. The average SUVs for dog kidney, liver, and spleen at 60 min were 2.88, 2.75, and 1.71, respec-tively.
Thus, data suggest a similar average SUV for hu-mans and canines. In the current study, the average SUVs for cat kidney, liver, and spleen after 60 min were 2.02, 1.00, and 0.24, respectively. The average cat kidney SUV at 60 min was not much different from the SUV of humans or dogs.
Additionally, the 60-min SUV for the right kidney was 2.04 while in the left kidney the value was 2.00, a difference that is not significant. This difference seems to be caused by the use of a more accurate drawing of uncertain borders in a PET image.
It could be considered that the SUV values of liver and spleen are relatively lower than those of humans and dogs, and the SUV values at 0-min, and 60-min for the kidney, liver, and spleen, the kidney’s excretion rate of 18F-FDG is higher than
those of the liver and spleen.
The cellular distribution of 18F-FDG is largely
dependent on two factors: The presence and activ-ity of various glucose transporter proteins (GLUT 1–12) that allow 18F-FDG entry into the cell, and
hexokinase enzyme activity that works to phos-phorylate and thus trap 18F-FDG within the cell,
thereby preventing its passage through additional steps of glycolysis (Fowler and Ido 2002; Medina and Owen 2002; Wood and Trayhurn 2003).
Mammalian hepatocytes generally contain two enzymes responsible for phosphorylation of glu-cose to gluglu-cose-6-phosphate in the first step of gly-colysis: hexokinase and glucokinase (MacDonald et al. 1984). These enzymes may also phosphorylate
18F-FDG to 18F-FDG -6-phosphate. Hexokinase and
glucokinase are both present in the canine liver, but the feline liver does not contain appreciable levels of glucokinase activity (Ballard 1965).
In our previous experiments, cat spleens were not studied, (LeBlanc et al. 2009). However, in this study, the spleen 18F-FDG SUV was high at the
beginning of the time-course and then gradually decreased. As the accumulation was observed at the outset but decreased after sufficient accumu-lation, the necessity for dynamic examination is supported; we could verify the SUV of the spleen by establishing an ROI after correctly determining the uncertain border of the organ.
Poor myocardial uptake of 18F-FDG in this study
is consistent with typical findings in humans af-ter an 18 h fast. In humans, 18F-FDG intake may
not occur in the myocardium due to a change of disposition of this myocardium after an 18–24 h fast. Within the myocardium, the use of glucose is variable, depending on factors such as glucose se-rum level and insulin levels, what the myocardium energy disposition at empty stomach is superior as fatty acid (Nuutinen et al. 1999).
The fast is an significant factor in this analysis as anaesthesia is an important tool in veterinary science. As glucose is competing with 18F-FDG
the drop in blood glucose levels due to fasting is important because it increases 18F-FDG intake by
malignant tumour tissues and tissues affected by hypermetabolic disease. In a previous experiment, animals were fasted for 12–18 h before examina-tion. Sixty minutes after initiation of the experi-ment, the average SUV of heart tissue was 3.58 in the transverse scan and 3.34 in the sagittal scan (LeBlanc et al. 2009). In the current study, the ani-mals were fasted for 24 h before examination.
empty stomach. In this experiment and also in our previous findings, the left myocardial activity was highly variable. However, only the static data was obtained in the previous experiment; therefore, it is impossible to tell whether the SUV was increas-ing or decreasincreas-ing.
In this experiment, two of five cats showed a gradual decrease in SUV with time, while two other animals showed a gradual increase, and one animal showed a faint increase.
These results seem to have resulted from the use of fatty acid as a disposition medium into the myo-cardium at the time of fasting; however, we could not determine the exact reason in this experiment due to the lack of comparative data. It is known that individual differences can also be present within study subjects (Engel et al. 1996; Gordon et al., 1997; Ramos et al. 2001; Tan and Ong 2004).
Differently from a person who fasts just 6 hours before the inspection, in the case of a cat which must be put under anaesthesia, and fast for 24 h before the time of inspection, for the change of various individuals of left ventricular myocyte re-garding glucose intake of myocardium, the study on fatty acid use as disposition in myocardium not yet known when cat fasts will have to proceed more (Crippa et al. 1997; Lee et al. 2005).
The left blood pools of all five cats showed an SUV decrease by 90 min. Interestingly, a faint in-crease was observed in the SUV of the left blood pool in the two animals in which the SUV of the ventricular myocytes increased. In the future, the correlation between ventricular myocyte and blood pool SUV should be studied.
Data from canine experiments shows that the SUV decrease by at least 50% when comparing the 0 to 90 min results for both kidneys and the liver. Our data show that the feline 90-min SUVs from those same organs were decreased to less than half the values observed at 0 min. Therefore, both dog and cat SUV values for kidneys and liver decrease by at least 50% by 90 min.
Additionally, the dog SUV in liver and kidneys plateaus at 60-min, followed by a steady decrease in 18F-FDG (LeBlanc et al. 2008). The results from
cats show a sudden decrease in 18F-FDG at 60 min.
The SUVs of the dog’s kidneys are higher (right 6.70, left 6.24) at 0 min, compared to those of the other organs (liver 5.75, spleen 1.73, left blood pool 4.35, left ventricular myocyte 3.12), Our data also showed a higher SUV for the cat kidneys (right kidney 5.27, left kidney 4.58) than the other organs
(liver 2.86, spleen 1.54, left blood pool 3.61, left ventricular myocyte 1.64).
Thus, cats and dogs share another trait regarding SUVs in thoracoabdominal organs.
In contrast, the discharge rate of 18F-FDG for
each organ of the cat studied was quite different from that observed for dogs.
The cat discharge rates are as follows: liver 27.3%, spleen 17.9 %, right kidney 32.1%, left kidney 38%. The dog discharge rate for the liver is 44%, for the spleen it is 90.7%, for the right kidney 38.6%, and for the left kidney the value is 38.6%. Thus, the discharge speed of 18F-FDG from the cat liver and
spleen was relatively fast.
There are a few limitations to this study. First, the sample size was small. Second, the animals were anaesthetised with an injectable anaesthetic. In a similar study performed with rats, Xy/Ke anaes-thesia increased the blood 18F-FDG as it disrupted
the insulin discharged by a rat which was fasted for 4 h thus decreasing the tumour intake ratio. On the other hand, pentobarbital use resulted in a similar, but less severe response in insulin resistance. In a tumour model study on rats, isoflurane anaesthesia did not have any influence on a xenograft tumour (Fueger et al. 2006).
The use of general anaesthesia shows falsely low
18F-FDG intake in most organs due to changes in
the immanent metabolism path. The effect of gen-eral anaesthesia on dog or cat 18F-FDG intake has
not been explored.
To minimise the diversity of 18F-FDG intake, the
use of a single protocol for general anaesthesia should be recommended. The third caveat to our study is that only mature cats were included in this experiment. This is significant because the ratio of brown fat which consumes a large number of calories is greater in young animals than in adults. Brown fat is diverse in its degree and distribution of 18F-FDG intake. As in dual-time-point scanning
and malignant tumours, the hypermetabolic brown fat usually showed a significant 18F-FDG increase.
This brown fat is an important cause of false posi-tive results. As previously mentioned, young cats were not included in this experiment. However, studies to compare the 18F-FDG intake rate per
organ in young cats vs. that in old cats based on the presence of brown fat should be conducted in the future.
Given the lack of information regarding cat
18F-FDG intake ratios, the basic information
limitations. The use of PET/CT is expected to in-crease in numerous fields, including physiology, pathology, and oncology.
The normal cat SUV data of major organs de-scribed here could be used in cat PET/CT studies and in the clinical evaluation of various cat dis-eases. Furthermore, PET/CT can provide higher quality images over shorter examination times than conventional PET.
REFERENCES
Abouzied MM, Crawford ES, Nabi HA (2005): 18F-FDG
imaging: pitfalls and artifacts. Journal of Nuclear Medicine Technology 33, 145–155.
Ballard FJ (1965): Glucose utilization in the mammalian liver. Comparative Biochemistry and Physiology 14, 437–443.
Crippa F, Gavazzi C, Bozzetti F, Chiesa C, Pascali C, Bogni A, De Sanctis V, Decise D, Schiavini M, Cuc-chetti G, Bombardieri E (1997): The influence of blood glucose levels on [18F]fluorodeoxyglucose (FDG)
up-take in cancer: a PET study in liver metastases from colorectal carcinomas. Tumori 83, 748–752.
Engel H, Steinert H, Buck A, Berthold T, Huch Boni RA, von Schulthess GK (1996): Whole-body PET: physi-ological and artifactual fluorodeoxyglucose accumula-tions. Journal of Nuclear Medicine 37, 441–446. Fueger BJ, Czernin J, Hildebrandt I, Tran C, Halpern BS,
Stout D, Phelps ME, Weber WA (2006): Impact of animal handling on the results of 18F-FDG PET
stud-ies in mice. Journal of Nuclear Medicine 47, 999–1006. Fowler JS, Ido T (2002): Initial and subsequent approach
for the synthesis of 18F-FDG. Seminars Nuclear
Med-icine 32, 6–12.
Gordon BA, Flanagan FL, Dehdashti F (1997): Whole-body positron emission tomography: normal varia-tions, pitfalls, and technical considerations. American Journal of Roentgenology 169, 1675–1680.
Gorospe SL, Echeveste AJ, Raman S (2006): Positron-emission tomography/computed tomography: artifacts and pitfalls in cancer patients. Journal of Radiology 48, 189–204.
Hamberg LM, Hunter GJ, Alpert NM, Choi NC, Babich JW, Fischman AJ (1994): The dose uptake ratio as an index of glucose metabolism: useful parameter or oversimplifica-tion? Journal of Nuclear Medicine 35, 1308–1312. Kostakoglu L, Hardoff R, Mirtcheva R, Goldsmith SJ
(2004): PET/CT fusion imaging in differentiating physiologic from pathologic FDG uptake. RadioGraph-ics 24, 1411–1431.
LeBlanc AK, Jakoby B, Townsend DW, Daniel GB (2008): Thoracic and abdominal organ uptake of 2-deoxy-2-[18F] fluoro-d-glucose (18F-FDG) with positron
emission tomography in the normal dog. Veterinary Radiology and Ultrasound 49, 182–188.
LeBlanc AK, Wall JS, Morandi F, Kennel SJ, Stuckey A, Jakoby B, Townsend DW, Daniel GB (2009): Normal thoracic and abdominal distribution of 2-deoxy-2-[18F]
fluoro-D-glucose (18F-FDG) in adult cats. Veterinary
Radiology and Ultrasound 50, 436–441.
Lee KH, Ko BH, Paik JY, Jung KH, Choe YS, Choi Y, Kim BT (2005): Effects of anesthetic agents and fasting duration on 18F-FDG biodistribution and insulin
lev-els in tumor-bearing mice. Journal of Nuclear Medi-cine 46, 1531–1536.
Lee MS, Lee AR, Jung MA, Lee IH, Choi JH, Chung HW, Jeong SW, Nahm SS, Eom KD (2010): Charicterization of physiologic 18F-FDG uptake with PET-CT in dogs.
Veterinary Radiology and Ultrasound 51, 670–673. Lindholm P, Minn H, Leskinen Kallio S, Bergman J,
Ruot-salainen U, Joensuu H (1993): Influence of the blood glucose concentration on FDG uptake in cancer. Jour-nal of Nuclear Medicine 34, 1–6.
Liu X, Comtat C, Michel C, Kinahan P, Defrise M, Townsend D (2001): Comparison of 3-D reconstruc-tion with 3D-OSEM and with FORE + OSEM for PET. IEEE Transactions on Medical Imaging 20, 804-814. Macapinlac HA (2008): Clinical applications of positron
emission tomography/computed tomography treatment planning. Seminars Nuclear Medicine 38, 137-140. MacDonald ML, Rogers QR, Morris JG (1984): Nutrition
of the domestic cat, a mammalian carnivore. Annual Review of Nutrition 4, 521–562.
Medina RA, Owen GI (2002): Glucose transporters: ex-pression, regulation and cancer. Biological Research 35, 9–26.
Nuutinen J, Minn H, Bergman J, Haaparanta M, Ruo-tasalainen U, Laine H, Knuuti J (1999): Uncoupling of fatty acid and glucose metabolism in malignant lym-phoma: a PET study. British Journal of Cancer 80, 513–518.
Ramos CD, Erdi YE, Gonen M, Riedel E, Yeung HW, Macapinlac HA, Chisin R, Larson SM (2001): FDG-PET standardized uptake values in normal anatomical structures using iterative reconstruction segmented attenuation correction and filtered back-projection. European Journal of Nuclear Medicine 28, 155–164. Rosenbaum SJ, Lind T, Antoch G, Bockisch A (2006):
False-positive FDG PET uptake-the role of PET/CT. European Radiology 16, 1054–1065.
PET imaging. Annals of the Academy of Medicine Singapore 33, 183–185.
Tsukamoto E, Ochi S (2006): PET/CT today: system and its impact on cancer diagnosis. Annals of Nuclear Medicine 20, 255–267.
Vansteenkiste JF, Stroobants SG, Dupont PJ, De Leyn PR, Verbeken EK, Deneffe GJ, Mortelmans LA, Demedts MG (1999): Prognostic importance of the standardized uptake value on 18F
-fluoro-2-deoxy-glucosepositron emission tomography scan in non-small-cell lung cancer: an analysis of 125 cases. Journal of Clinical Oncology 17, 3201–3206.
Visser EP, Philippens ME, Kienhorst L, Kaanders JH, Corstens FH, de Geus-Oei LF, Oyen WJ (2008): Com-parison of tumor volumes derived from glucose
met-abolic rate maps and SUV maps in dynamic 18F-FDG
PET. Journal of Nuclear Medicine 49, 892–898. Weber WA, Schwaiger M, Avril N (2000): Quantitative
assessment of tumor metabolism using FDG-PET im-aging. Nuclear Medicine and Biology 27, 683–687. Wood IS, Trayhurn P (2003): Glucose transporters
(GLUT and SGLT): expanded families of sugar trans-port proteins. British Journal of Nutrition 89, 3–9. Yasuda S, Takahashi W, Takagi S, Fujji H, Ide M, Shohtsu
A (1998): Factors influencing physiological FDG up-take in the intestine. Tokai Journal of Experimental and Clinical Medicine 23, 241–244.
Received: 2012–01–06 Accepted after corrections: 2013–03–09
Corresponding Author: