Summarising Unreliable Data
Stephanie Inglis
Department of Computing Science
University of Aberdeen
[email protected]
Abstract
Unreliable data is present in datasets, and is either ignored, acknowledged ad hoc, or undetected. This paper discusses data quality issues with a potential framework in mind to deal with them. Such a frame-work should be applied within data-to-text systems at the generation of text rather than being an afterthought. This paper also shows ways to express uncertainty through language and World Health Or-ganisation (WHO) corpus studies, and an experiment which analyses how subjects approached summarising data with data quality issues. This work is still ongoing.
1
Introduction
Databases are used in multiple fields for various purposes. While gathering and using this data, is-sues arise regarding the quality of the data. These problems take multiple forms, and identifying them within a dataset can sometimes prove chal-lenging or impossible (Daniel et al. 2008). Once identified, action needs to be taken. In a large da-tabase, amending all problem entries could be a costly task prone to human error, potentially cre-ating more issues. Alternatively, it may not be possible to resolve the error. Either way, the user of the data must be informed of these errors if they are to use this data accurately.
Currently when companies use data to generate text, data quality issues are resolved ad hoc rather than during the generation phase. Instead, a framework should be created to deal with these is-sues at the point of generation, rather than amend-ing the document if required.
First, we cover a discussion of related work fol-lowed by a corpus study of Ebola and Global Road Traffic reports provided by the WHO. An experiment is used to investigate further in Sec-tion 4. Finally we outline future steps.
2
Related Work
2.1 Data Quality
The quality of data impacts the amount of confi-dence we can have in our conclusions. By being aware of the issues within the data, we can begin to attempt resolution.
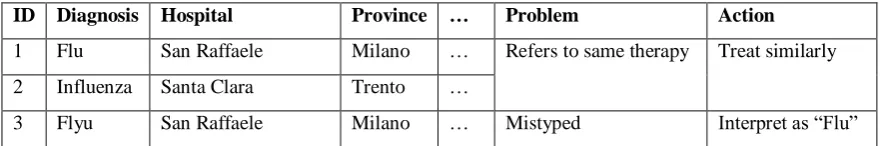
Daniel et al. (2008) discusses a system which aggregates reports in an attempt to improve the quality of reports hampered by poor quality data (see Figure 1). The data is acquired after summer from various sources such as hospitals, laborato-ries and emergency rooms. These reports are for the Italian Department of Health to predict the number drugs required over a winter period to treat flu, to prepare for outbreaks or to negotiate prices with manufacturers. Incorrect conclusions could result in overspending and the health de-partment losing money, or not having enough drugs readily available for those who require them. The key problems are categorised as com-pleteness, consistency and confidence issues. These are some issues likely to be missed by data cleaning tools.
Completeness covers missing data, which in-cludes empty cells as well as entirely lost entries. This system ignores rows with the diagnosis field missing as these could result in false drug quantity estimations.
Consistency covers data that is not classified together but has the same meaning. The example entries in the paper show “influenza” and “flu” to be different diagnoses however they should be represented as the same. This can also occur through human error by mistypes which will also create a new, unwanted diagnosis e.g. “flu” being mistyped as “flyu”. The precision of the diagnosis may result in additional entries such as including the type of flu of a patient. When ordering “influ-enza” drugs, underestimation may occur as “flu”, “flyu” and “flu type A” may not be included in the count.
of variable meanings also present issues. The example shown in the paper is “cost” of the drug differing for the same diagnosis. This could be interpreted by some as with tax added, while oth-ers omitted it.
While this is more of a consistency issue, its in-terpretation impacts the confidence of the data. A proposed solution is to replace an ambiguous var-iable with a more general varvar-iable, such as adjust-ing cost to become maximum cost.
2.2 Vague Language
Another aspect to investigate is the language used when conveying unreliable data, such as nu-merical data. When the author is writing a report and is unsure of the data, language becomes vague to allow for uncertainty. The reader will see these words and intuitively know that the author is not certain about their conclusion.
Van Deemter (2010) claims something to be vague if “it allows borderline cases”, and subse-quently defined categories of vague language. Adjectives themselves are vague as they allow borderline. Vague quantifiers such as “many”, “most” or “few also allow borderline cases. For lack of specificity, the term is not vague by defi-nition but a concrete value is not provided, such as “more than 5”. Comparatives use degrees of adjectives such as “30 is greater than 28”. Finally, hedges express uncertainties by using words such as “appears”, “suggests” or “may”. This allows the author to make statements without committing to them as fact such as “numbers appear to be in-creasing”.
This work looks at vagueness in the context of data quality issues as described above. For exam-ple, different vague language is used for missing data and inconsistent data.
2.3 Real World Applications
The use of vague language in low data quality situations is present in industry applications.
BT-Nurse is one application, generating hand-overs for nurses caring for pre-term neonates and
1 World Health Organisation, Situation reports with epidemiological data: archive,
sick babies (Hunter et al, 2012). The handover is generated at the end of a shift so the next nurse on the ward knows the babies current conditions. High data quality is important as the health of the babies depend on it. An example of incomplete data is when a baby is intubated, but an accurate time is not recorded. To try to correct this, the ventilator mode data is checked. When an estima-tion is present in the text, phrases such as “around 19:45” and “by about 06:15” were used.
Sripada et al. (2014) discuss a system able to generate 50,000 high quality weather reports in less than two minutes. This system is used by the Met Office to generate reports for public use. As these are predictions, the further away the fore-cast, the greater the uncertainty in the data. There-fore the reports on day 3 have different language compared to those reports on day 1. The paper shows this on practise where on day 3 the word “expected” is included, whereas this would be omitted if the forecast was for day 1. The use of vague language helps to convey this uncertainty.
3
WHO Ebola Reports
Information can be communicated through vari-ous mediums, ranging from visual graphs to sen-tences. The WHO1 has followed the Ebola virus
disease outbreak and provided detailed weekly re-ports and frequent updates on the situation. The reports used span from 29th August 2014 to 4th February 2015, containing 24 main weekly ports and 12 additional update reports. These re-ports contain a variety of tables, maps, graphs and sentences describing the number of suspected, probable and confirmed cases and deaths that have occurred in various countries as a result of the outbreak. The focus was primarily on the three most affected countries – Guinea, Liberia and Sierra Leone. An attempt was made to use the figures given in the tables to replicate sentences using the SimpleNLG (Gatt and Reiter, 2009) li-brary. While doing so, the issues mentioned in section 2.1 arose.
http://www.who.int/csr/disease/ebola/situation-re-ports/archive/en/ . Last accessed 23rd June 2015. ID Diagnosis Hospital Province … Problem Action
1 Flu San Raffaele Milano … Refers to same therapy Treat similarly
2 Influenza Santa Clara Trento …
[image:2.595.70.511.72.145.2]3 Flyu San Raffaele Milano … Mistyped Interpret as “Flu”
Country Case definition
Cases Deaths
Liberia Confirmed 950 *
Probable 1923 *
Suspected 1376 *
All 4249 2458
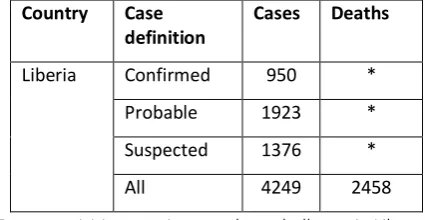
[image:3.595.77.290.71.181.2]“Data acquisition continues to be a challenge in Libe-ria. Evidence obtained from responders and labora-tory staff in the country suggests that the situation in Liberia is getting worse”
Figure 2- A data and textual example taken from the Situa-tion Report on the 15th October 2014. This shows an in-stance of missing data in deaths reported in Liberia.
3.1 Data Quality
Incompleteness was largely evident in Libe-ria’s data (see Figure 2). No data was given from report 4 to 20, covering almost 2 months. Throughout these reports, phrases such as “data acquisition continues to be a challenge” in report 14 can be found to describe Liberia’s situation. Eventually, the data reached a quality so low that the same report quotes “problems with data gath-ering make it hard to draw any firm conclusions from recent data” whereas previously, WHO had at least speculated on trends in the data.
Inconsistencies exist between the numbers in the table and the text. Numbers were not men-tioned explicitly in the text until around report 20. However, some vague statements appeared be-forehand, such as “with over 200 new cases re-ported” on the 18th September. When numerical data was mentioned, it almost exclusively referred to the confirmed deaths. Data on Guinea was mostly inconsistent, with only 5 of the 26 reports being consistent between the tabular data and the textual data. One explanation is that reports were updated after publishing when late lab results were produced, but only for one layout.
Finally, there is evidence of lack of confidence. Data is incorrect in some situations, such as when the number of deaths exceeded the number of cases. This can be seen in report 12 on the 8th Oc-tober, occurring in both Liberia and Sierra Leone. Identifying data that is inaccurate will lower the confidence.
2 World Health Organisation. (2009). Global status
re-port on road safety 2009. Available:
http://www.who.int/violence_injury_preven-tion/road_safety_status/2009/en/. Last accessed 23rd June 2015.
3.2 Vague Language
The reports on Ebola have numerous examples of vague language being used.
Phrases such as “this is a genuine decline”, “there may not yet be full agreement”, and “based on the best information available” appeared fre-quently. The adjectives “genuine”, “full” and “best” allow borderline cases, and so are vague. Therefore the phrases themselves are vague, and suggest this is more an opinion of the writer rather than fact. Vague quantifiers such as “many of the suspected cases”, “there appears to be some evi-dence”, and “very few confirmed cases were re-ported” also appeared often. Lack of specificity is rare but it does exist, for example “countries re-port that more than 80%”. The main comparative phrase in these reports is “it is too soon to say”. Finally, examples of hedges include phrases that include the words “appears”, “suggests” or “may”. These words are used in the majority of the reports such as “appears to have stabilised”, “which suggests that many of the suspected cases”, and “which may lead to a revision of the numbers of cases and deaths”.
Vague language was strongly used to describe the data in the Ebola reports. To investigate this further, an experiment was done using data from a different report, described in the next section.
4
Pilot Study
4.1 Set Up
To investigate human language in describing unreliable data, subjects were asked to summarise tables of data (see Figure 3). The experiment makes use of the Global Road Traffic reports for 20092 and 20133 provided by the WHO. A new domain was selected to observe differences be-tween this corpus and the Ebola corpus, though none are identified yet (see Future Work).
Subjects were asked to assume the role of a news reporter on Twitter and report information to followers. Due to Twitter constraints, subjects were restricted to only 140 characters per country. This forced subjects to be concise and to prioritise the information given to them.
For 6 of the 183 possible countries, the number of deaths reported by the police, the number of es-timated deaths, and a 95% confidence interval
3 World Health Organisation. (2013). Global status
were given. While the reported figures were pro-vided by police data, the estimated deaths were produced by a model by the WHO, which applies negative binomial regression if the police data is less than 85% complete.
While the data was for real countries, they were renamed Country A to F to avoid bias. 22 subjects successfully completed the experiment, providing 132 tweets for analysis.
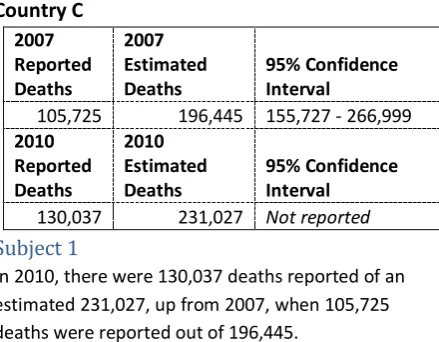
Country C
Subject 1
In 2010, there were 130,037 deaths reported of an estimated 231,027, up from 2007, when 105,725 deaths were reported out of 196,445.
Figure 3- An example of stimulus used in the experiment taken from the reports, and an example of a tweet given.
4.2 Findings
To evaluate the tweets, they were annotated by the first author to identify the different techniques subjects used to report information. These were:
If the exact police or WHO numbers were used
If a description of the numbers was used i.e. “around 300 deaths”
If a trend in the data was mentioned
If data quality was mentioned
If opinions were given
No second annotator was present. The example in Figure 3 was annotated as police numbers, WHO numbers and a trend (“up from 2007”).
As this is a pilot study, further study is needed to improve confidence in these findings. It was found that different subjects used different tech-niques (p<0.001 for police numbers, WHO num-bers, Descriptions and Opinions, p=0.007 for trends using Pearson Chi-Squared). The only in-stance this did not apply to was data quality indi-cating subjects used this technique in a similar way. If data quality was mentioned by subjects, they were likely to add an opinion (p=0.02, Pear-son Chi-Squared).
If data was incomplete, the quality of data was more significantly likely to be mentioned
(p<0.001, Pearson Chi-Squared), as well as more specifically that missing data was the quality issue (p<0.001, Pearson Chi-Squared).
Unlike incomplete data, subjects were not sig-nificantly more likely to mention data quality if data was inconsistent (p=0.157, Pearson Chi-Squared). However, when data was consistent, subjects were likely to acknowledge this (p<0.001, Pearson Chi-Squared). Subjects were also significantly likely to mention trends when the data was consistent (p=0.01, Pearson Chi-Squared).
As there was no indication of how confident we could be in the data, there was no way to in-vestigate if subjects’ tweets correlated with the ac-tual accuracy of the data. An observation how-ever was that only one of the 16 mentions of con-fidence was positive. The remaining 15 were un-confident in the data.
Another notable result was trends and descrip-tions were correlated, and were used as a pairing in 53 of the 75 instances that either trends or de-scriptions appeared (p<0.001, Pearson Chi-Squared).
Of the 132 tweets, only one directly mentioned the confidence interval, so this element of the ex-periment was discarded.
5
Future Work
Analysis of the vague language used in the ex-periment tweets will be done, as well as language comparisons between the two WHO corpuses used in this paper. Further experiments will be conducted using mechanical turk. One will use 20 countries and 150 subjects while another will give 75 subjects only reported figures and a further 75 subjects only estimated figures to provide a base line for the first experiment. These will concen-trate on the findings from the initial experiment. Another potential experiment will give subjects text and investigate if they can identify present data quality issues. The increase in results should allow a deeper analysis. After analysing the re-sults and undertaking further research into more low quality datasets, a framework will be devel-oped and generated text will be evaluated by hu-man subjects. Improvements will be made to the framework based on the feedback of subjects. 2007
Reported Deaths
2007 Estimated Deaths
95% Confidence Interval
105,725 196,445 155,727 - 266,999
2010 Reported Deaths
2010 Estimated Deaths
95% Confidence Interval
[image:4.595.74.294.197.368.2]References
Daniel, F., Casati, F., Palpanas, T., Chayka, O. and Cappiello, C. (2008). Enabling Better Decisions Through Quality-Aware Reports In Business Intel-ligence Applications.
Gatt, A. and Reiter, E. (2009). SimpleNLG: A realisa-tion engine for practical applicarealisa-tions. Proceedings of ENLG-2009
Hunter, J., Freer, Y., Gatt, A., Reiter, E., Sripada, S. and Sykes, C. (2012). Automatic generation of nat-ural language nursing shift summaries in neonatal intensive care: BT-Nurse. Artificial Intelligence in Medicine, 56(3), pp.157–172.
Sripada, S.G., Burnett, N., Turner, R., Mastin, J., and Evans, D. (2014). A Case Study: NLG meeting Weather Industry Demand for Quality and Quantity of Textual Weather Forecasts. INLG 2014.p1-5.