Statistical and Social Inquiry
Society of Ireland
Problems of Industrialisation in Developing
Countries and their Implications for Ireland
By C. E. V. LESER
(Read before the Society on 10 November 1967)
1. THE LEVEL OF OF INDUSTRIALISATION
Recent years have seen an increasing interest in the economies of those countries which have at various times been described as "underdeveloped", "less industrialised" or "developing". It is recognised that the magnitude and character of the economic problems facing countries at opposite poles with regard to the level of industrial development were very different. At the same time, there is now perhaps an excessive tendency towards lumping countries together in a few groups. The official United Nations definition, for example in [13], classifies all countries analysed other than "centrally planned economies" as either "developed market economies" or "develop-ing countries", regardless of the fact that some of the former are rapidly developing and some of the latter stagnating. All European non-Com-munist countries are counted as developed, whilst Latin America, Africa excluding South Africa, and the non-Communist Asian countries except Japan are those which are treated as developing.
For a country like Ireland, it seems reasonable to surmise that its economy has some features in common with industralising countries in other continents rather than with the industrially most advanced European countries. It therefore seems pertinent to ask where the country stands in relation to others as regards the level of economic development. There are obvious difficulties in attempting to measure something that is really very complex by a single indicator; nevertheless this must be attempted.
price situations, with substantial inter-country variations in relative prices of different types of commodities, have been shown by Gilbert and Kravis [3] to present serious difficulties even when attempting a comparison between European and American countries. The difficulties are multiplied if the comparison extends to countries in which subsistence agriculture plays a large part. The difficulty is highlighted by the fact that the U.N. Statistical Office [12] publishes two sets of figures, using different exchange rates.
A further limitation of this measure is the fact that a very high figure is obtained for countries deriving large oil revenues such as Kuwait. In these cases, national income per head may be high but, with very uneven income distribution, does not guarantee a high living standard to the mass of the country's inhabitants, nor does it provide a secure basis for further economic progress.
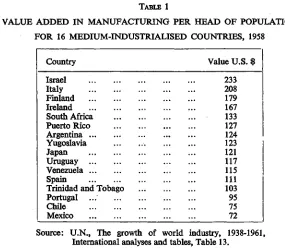
In a different publication [11], the U.N. Statistical Office gives an alternative indicator for a number of countries with regard to 1958 and a few other bench-mark years. This is the value added in manufacturing per head of the total population expressed in 1958 U.S. dollars. Of course, the figures represent estimates, the validity of which also depends on the suitability of the chosen exchange rate. Within the manufacturing sector which produces internationally traded goods, however, difficulties of comparison are probably less than within other sectors. This measure of the level of industrialisation reached by a country thus appears to be a satisfactory indicator. The countries were classified as industralised or less industralised according to whether the capita value added in manufactur-ing exceeded or fell short of $125 in 1958. This choice of a smanufactur-ingle dividmanufactur-ing line does not appear to be a happy one, as there are a number of border-line cases, the value lying between $120 and $130 in the case of four countries and between $100 and $150 in the case of nine countries altogether. The allocation of such countries to one or the other class appears fairly arbitrary.
TABLE 1
VALUE ADDED IN MANUFACTURING PER HEAD OF POPULATION
FOR 16 MEDIUM-INDUSTRIALISED COUNTRIES, 1958
Country Value U.S. $
Israel Italy Finland Ireland South Africa Puerto Rico Argentina Yugoslavia Japan Uruguay Venezuela Spain
Trinidad and Tobago Portugal
Chile Mexico
233 208 179 167 133 127 124 123 121 117 115 111 103 95 75 72
Source: U.N., The growth of world industry, 1938-1961, International analyses and tables, Table 13.
The countries listed here comprise those on the fringe of Europe, the more advanced Latin American countries, and a few isolated countries in Asia and Africa whose experience has set them apart from the rest of these continents. In addition one would hazard a guess that most countries of Eastern Europe also fall into this category. If data for these are not available this is not due to ideological reasons but to their industrial classification scheme which does not readily permit separation of manu-facturing from other activity.
If the criterion adopted here is accepted, Ireland clearly appears as a medium-industrialised country, though near the top of this group of nations, and not as highly industrialised. It is true that a notable advance has been made since 1958, but other countries have not stood still mean-while. Considerations of sheer arithmetic show that large and sustained differentials in industrial growth rates are required to eliminate differences in levels of industrialisation of the magnitude recorded here.
4
lot T -0-554+0.573 log10P(R2=.817)
or Lc=3.58xP0'573
The output per person engaged in $ is then represented by the expression 1,000 P/L, and we have
1,000 P \ __ 279 xp 0-427
The relationship derived here is formally similar to the "Verdoorn Law" quoted by Kaldor [6] which applies to changes over time in manufacturing output and employment. In this instance, a numerical employment function is derived from the annual exponential growth rates between 1953-54 and 1963-64 observed in 12 industrial countries. The result obtained is a 0.516% increase in employment and a 0.484% increase in productivity associated with a 1 % increase in manufacturing output, apart from an autonomous productivity rise or employment decline by 1.03% p.a.
The employment function given above, on the other hand, refers to the situation at a given time. For example, it specifies that in the average country with a manufacturing output of $100 per head of the population, about 50 out of 1,000 inhabitants work in manufacturing with an annual output of about $2,00 per person engaged. With rising industrial production manufacturing employment appears to rise slightly faster than labour productivity.
However, the deviations from this average relationship are perhaps even more interesting than the relationship itself, and they are brought out in Tables 2 and 3. Table 2 shows that there is a systematic element in these deviations which is associated with regional differences but cuts across the grouping of countries by level of industrialisation. On account of the mathematical formulation used, the averages shown represent unweighted geometric means. A high index in the last column indicates high employment and low output per worker in relation to the industralisa-tion level.
Thus in the European countries, employment on the whole makes a relatively large contribution and output per head a relatively small con-tribution to the level of manufacturing output attained. The same is true with regard to the Asian countries and the less developed Latin American countries. On the other hand, the countries of North America and Oceania are characterised by relatively low manufacturing employment and high output per head, as are also the more advanced Latin American countries and the African countries.
TABLE 2
ACTUAL AND EXPECTED NUMBER OF PERSONS ENGAGED IN MANUFACTURING FOR VARIOUS GROUPS OF COUNTRIES, 1958
Level of industria-lisation and region
HIGH
America & Oceania Europe Total MEDIUM: America Europe Others Total Low: Africa America E. &S.E. Asia Middle East & Europe
Total All countries Number of Countries 4 13 17 7 6 3 16 12 13 11 6 42 75 Average value added per in-habitant 553 478 494 102 142 155 125 14 25 11 26 17 56
Average persons engaged per 1,000 inhabitants Actual 91.2 139.8 126.4 43.2 73.3 62.1 56.4 10.9 26.6 18.1 22.3 18.1 35.9 Expected on basis of regression 133.4 122.8 125.2 50.8 61.2 64.6 57.0 16.2 22.4 14.1 22.9 18.1 35.9 Actual (Expected = 100) 68 114 101 85 120 96 99 67 119 128 97 100 100
Source: Derived from U.N., The growth of world industry 1938-1961, International analyses and tables ,Table 13; and from regression in this text.
experiences of Asia and Africa, with the much higher population density in the former than in the latter, are certainly a case in point.
The state of affairs in these alternative circumstances corresponds to what Maizels [8] describes as the two typical development paths for industrialising countries. Some countries start off by generating a sub-stantial volume of employment in manufacturing without any large pro-ductivity gains at this stage; in others, the initial emphasis is on a few industries operating at high productivity levels but providing very limited employment.
Table 3 gives similar particulars for individual countries with medium-high manufacturing production. It clearly shows that even within the regional grouping adopted, there are substantial variations from country to country in the contributions made by employment and output per worker.
TABLE 3
ACTUAL AND EXPECTED NUMBERS OF PERSONS ENGAGED IN MANUFACTURING FOR 16 COUNTRIES, 1958
Average persons engaged per 1,000 inhabitants
Country
Argentina Chile Mexice
Puerto Rico ... Trinidad and Tobago Uruguar
Venezuela ..;
Finland Ireland Italy Portugal Apain Yougslavia
Israel Japan
South Africa ...
Actual Expected
Actual (Expected
= 100)
68.8 36.3 37.0 31.5 52.2 69.9 26.3
56.2 42.7 41.7 57.5 51.3 55.0 53.7
122 85 89 55 102 127 49
93.2 61.4 74.2 88.0 64.0 64.1
69.2 67.6 75.9 49.0 53.7 56.2
135 91 98
180
119 114
64.8 75.4 49.5
81.3 56.2 58.9
80
134
84
Source: As Table 2.
In particular, Ireland does not appear to follow the typical European pattern of relatively high manufacturing employment and relatively low output per worker. Contrary to a common belief, industry in Ireland has not been predominantly of a largely employment-creating character, and it is not to be wondered that, as in Italy, there have been and still are difficulties in the way of achieving full employment.
It would be interesting to assess the relative degree of success obtained by these alternative approaches towards industrial development. How :ver, without studying a much longer span than available data permit, it is not possible to arrive at any conclusive results. Moreover, as indicated, there is no guarantee that a single optimum approach would be applicable to every country; the particular circumstances have to be taken into account.
When all is said and done, what matters most to a country is nc t its position in a league table among other countries or even the precise numerical value of a growth rate but whether its economy is making progress which is likely to be sustained. Moreover, whilst an increase in manufacturing output is important, it is not the only aspect of econoraic development that matters, and it must be seen in conjunction with other changes which have occurred or will occur in the future.
2 OVERALL PATTERNS OF DEVELOPMENT
The advancement of economic growth raises problems for all countries of the world, rich or poor. Once the possibility of raising living standards of the less privileged sections of a community, without appreciably encroaching on those of the better-off sections, had been demonstrated, the pressure to attain these ends remains strong, though the actions taken are not invariably in harmony with the aims. In highly developed countries, much of the growth occurs spontaneously and painlessly, through ithe application of increasing knowledge and better use of existing resources. Only in so far as capital investment is required is there any choice between progress in different economic sectors and consequently a need to formulate priorities, be it by market forces or by social planning.
The position is different in the have-not countries, living standards in which not only exhibit the most glaring contrasts with those of their counterparts in the have countries but where also growth possibilities in the existing economic setting are far more limited. In a country wh( re a high proportion of national output is in the form of subsistence agricul ural production, the difficulties in the way of achieving a rapid increase ir. the national product are obvious. Development thus implies more than gro ;vth; it means a substantial structural transformation of the economy.
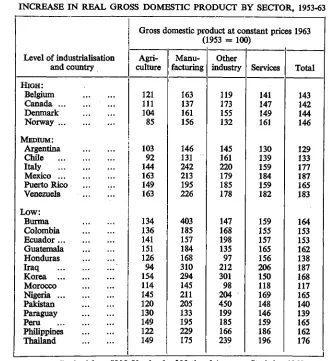
Fortunately perhaps, the dilemma is more apparent than real. In most countries, growth tends to be balanced between broad economic sectors, in the sense that progress in one sector does not tend to be at the expense of another but that the advance is simultaneous. This does not mean that agricultural and industrial gjrowth rates tend to be similar; on the contrary, industry tends to grow morb rapidly and thus to increase its share in gross domestic product, at any rate for countries in the process of development. These points are illustrated by Tables 4 and 5. Table 4 is based on constant price data for the gross domestic product and its major economic sectors and gives particulars for countries for which such data are available. Table 5 uses current price data and therefore covers a wider range of countries. Agriculture herein includes forestry and fishing; industry other than manufacturing embraces mining, construction and public utilities.
TABLE 4
INCREASE IN REAL GROSS DOMESTIC PRODUCT BY SECTOR, 1953-63
Level of industrialisation and country HIGH: Belgium Canada Denmark Norway
Gross domestic product at constant prices 1963
Agri-culture 121 111 104 85 MEDIUM: ; Argentina Chile Italy Mexico ... Puerto Rico Venezuela .. . 103 Low: Burma Colombia Ecuador ... Guatemala Honduras Iraq Korea ... Morocco Nigeria ... Pakistan Paraguay Peru Philippines Thailand .. .. .. .. .. .. . • 92 144 163 149 163 134 136 141 151 126 94 154 114 145 120 130 149 122 149
(1953 = 100)
Manu-facturing 163 137 161 156 146 131 242 213 195 226 403 185 157 184 168 310 294 145 211 205 133 195 229 175 Other industry 119 173 155 132 145 161 220 179 185 178 147 168 198 135 97 212 301 98 204 450 199 185 166 239 Services 141 147 149 161 130 139 159 184 159 182 159 155 157 165 156 206 150 118 169 148 146 159 186 196 Total 143 142 144 146 129 133 177 187 165 183 164 153 153 162 138 187 168 117 165 140 139 165 162 176
During the decade under consideration, a fall in agricultural output appears to have occurred in a few countries but this is the exception rather than the rule. Generally agricultural output has expanded though at a moderate rate which did not keep pace with other economic sectors. Industry, and manufacturing in particular, on the whole exhibits high growth rates, though in the case of less developed countries these rates are commonly superimposed upon a fairly narrow basis. The service trades generally expand at a rate close to that for the economy as a whole, which is plausible on a priori grounds. By and large economic growth seems to have been somewhat greater in countries which are at a medium or low level of industrialisation than in the most advanced countries, though there are large variations between the experience of different developing countries.
TABLE 5
PERCENTAGE SHARE OF INDUSTRY IN GROSS DOMESTIC PRODUCT AT CURRENT PRICES 1953 AND 1963
Level of industrialisation and country HIGH: Australia Austria Belgium Canada Denmark France Germany (F.R.) Netherlands ... Norway United Kingdom United States MEDIUM: Argentina Chile Ireland Israel Italy Japan Portugal Puerto Rico ... South Africa ... Trinidad and Tobago 1953 38.5 50.3 41.6 41.1 35.8 47.0 51.8 41.6 38.6 46.0 41.5 33.6 26.1 27.9 32.9 40.5 31.8 36.5 26.8 34.6 50.6 1963 40.6 50.9 42.1 38.3 39.3 47.5 52.7 41.1 38.0 46.6 38.3 39.6 27.8 32.4 34.5 45.1 38.6 42.6 32.6 40.4 51.2 Level of industrialisation and country Low:
British Guiana ... Burma China (Taiwan) Colombia Costa Rica Ecuador Greece Honduras India
Iraq ... r ... Jamaica
Korea (Rep.) ... Mauritius Pakistan Paraguay Philippines Thailand Turkey 1953 32.7 10.5 27.5 21.2 14.6 21.4 22.3 17.1 16.9 50.2 26.6 11.0 27.4 10.5 18.4 16.8 17.4 17.3 1963 33.1 20.1 30.9 26.6 17.5 23.5 26.7 18.8 19.6 49.9 36.4 16.2 26.9 15.5 18.7 23.7 19.5 21.9
10
The data on which Table 5 is based are to some extent influenced by differential price movements in different economic sectors. It appears that manufacturing products have shown a tendency towards a relative price fall in most countries, and therefore the figures given somewhat play down the rise in the share of industry which has occurred. This phenomenon explains the falling share of industry in Canada and probably also that in the United States.
Nevertheless, the general conclusion is clear. In the more mature economies, industry accounts for about 40-50 % of total gross domestic product, and the position as regards industry's share appears to be largely stabilised. In other countries, with the exception of major oil producers in which mining makes a substantial contribution to the national product, the share of industry is lower but generally rapidly increasing. The Irish experience is thus very much in line with what has happened elsewhere. Thus, there appears to be a clearly marked general pattern of develop-ment. While manufacturing and other industrial activity expands at a rapid rate, the output of agriculture and services also increases but at a more moderate rate. Thus, gross domestic product increases but relatively less than industrial production.
It is not surprising that there should be a tendency towards a balance between the growth of manufacturing and other sectors of the economy, notably agriculture. Inter-industry relations exist not only between different manufacturing industries but also between a manufacturing industry and non-manufacturing activities. Awareness of this inter-dependence is not entirely n$w in economic thought but has recently been given quantitative form by the construction of input-output tables.
The problem of sector balance has received particular attention in the context of agricultural versus industrial development. Here the linkages are obvious as on the one hand many industries utilise food or agricultural raw materials, on the other hand agriculture generally uses fertilisers and agricultural machinery. Thus, an expansion in one of these sectors will generally stimulate developments in the other. Conversely, if there are obstacles to the growth of one of the sectors, the bottlenecks which ensue may hamper the whole process of economic development.
The inter-action between agriculture and industry is likely to be parti-cularly effective through the medium of agro-industries which use food or non-food agricultural produce as their chief raw materials, and which are of particular importance in developing countries. Establishment of such industries may sometimes merely imply that an agricultural product is exported in processed, instead of in crude form; but generally it will tend to stimulate the production of agricultural commodities, which in the new circumstances will find more assured markets than previously.
11
capital-intensive and demand large-scale production. Once established, however, their products are likely to be used, thus raising agricultural out-put. Thus, in this respect also, manufacturing is more likely to provide the driving force which will help agriculture along then the other way round. Strictly speaking, these considerations fully apply in a closed econemy only. In an open economy it is possible to meet requirements of materials and other inputs by imports instead of home production, and the linkage between sectors is less strong. This applies particularly to island countries and others with a good seaboard and port facilities, in which the main centres of production are within easy reach from the outside world.
In such circumstances, it is theoretically possible to increase the level of only one economic activity, say manufacturing or even one manufacturing industry, and to meet all additional requirements other than local services by means of imports. It is even theoretically possible to switch over to some extent from primary production to manufacturing. This, in fact, has happened in developing countries in the sense that labour has moved out of agriculture and into industry. Normally, though, this does not cause agricultural output to fall since it is accompanied by increases in agri-cultural labour productivity.
However, there are obvious limitations to the possibilities which are open in this respect. Some materials, particularly foodstuffs used for industrial processing, are so perishable that unless they are immediately used for final consumption, their production and industrial exploitation must needs go hand in hand. In other cases, economies in transport costs are so strong that the same result is brought about in practice.
Similarly it would be theoretically possible to concentrate all efforts on expanding the production of such agricultural commodities which can be exported to pay for additional imports of manufactured goods. This is not, however, a favourite solution with developing countries towards their problems; and there are not only political but solid economic reasons for this, as agricultural raw materials tend to be vulnerable to price fluctuations and do not provide a stable economic basis.
Thus, the overall pattern of economic growth appears to be generally one in which all sectors share, but in which manufacturing occupies a dominant position and obtains the largest proportionate rise in output. In this sense, but in this sense only, can industrialisation be regarded as almost synonymous with economic development.
3 THE COMPOSITION OF MANUFACTURING OUTPUT
M
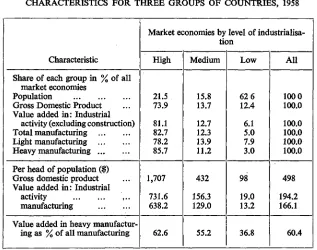
[image:12.411.50.367.144.394.2]Within these limits, the relative position in 1958 of the three groups of countries distinguished here can be derived from official estimates, and is summarised in Table 6.
TABLE 6
CHARACTERISTICS FOR THREE GROUPS OF COUNTRIES, 1958
Characteristic
Share of each group in % of all market economies
Population
Gross Domestic Product Value added in: Industrial
activity (excluding construction) Total manufacturing
Light manufacturing Heavy manufacturing
Per head of population ($) Gross domestic product Value added in: Industrial
activity manufacturing
Value added in heavy manufactur-ing as % of all manufacturmanufactur-ing
Market economies by level of
industrialisa-High
21.5 73.9
81.1 82.7 78.2 85.7
1,707
731.6 638.2
62.6
tion
Medium
15.8 13.7
12.7 12.3 13.9 11.2
432
156.3 129.0
55.2
Low
62 6 12.4
6.1 5.0 7.9 3.0
98
19.0 13.2
36.8
All
100 0 100.0
100.0 100.0 100.0 100.0
498
194.2 166.1
60.4
Source: Derived from U.N., The growth of world industry 1938-1961, International analyses and tables, Tables 12, 13 and Appendix III, Table 2.
The discrepancy between the geographical distribution of population and that of productive capacity is strikingly demonstrated. In 1958, about five people lived in the least industrialised countries for every three in the countries with a high and medium industrialisation level. On the other hand, almost three-quarters of the value of goods and services produced in all market economies originated in the most highly industrialised countries alone. The degree of concentration becomes successively more marked when the attention is confined first to industrial activity, i.e. mining, manufacturing and public utilities, then to manufacturing and finally to heavy industry alone. To put it in a different way, gross domestic product per capita is more than 17 times as high in the top group than in the bottom group of countries, but the disparity is less than with regard to manufacturing value added, for which the corresponding ratio is more than 4 8 t o h
13
here by the proportion borne by heavy industries. In accordance with the U.N. definition, this includes the following industry groups: paper and paper products; chemicals and chemical, products; petroleum and coal products; non-metallic mineral products; basic metals; and metal indus-tries. There maining light manufacturing industries are: food, beverages and tobacco; textiles; clothing; footwear and make-up textiles; wool products and furniture; printing and publishing; leather and leather products; rubber products; and miscellaneous manufactures.
For the market economies as a whole, heavy industries account for about three-fifths and light industries for about two-fifths of the total out-put value. The share of heavy manufacturing in the medium-industrialised countries is lower than in the most advanced countries but is still greater than one-half. In contrast, the emphasis on light industries is very strong in the least developed countries.
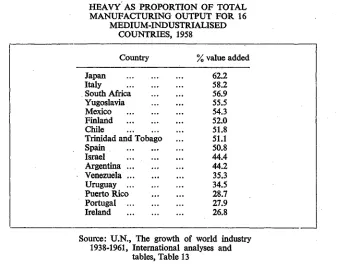
Within each group, however, there are considerable variations in the broad composition of manufacturing output. In the high group the pro-portion accounted for by heavy manufacturing lies between 40.9 % in the case of Australia and 82.9 % in the case of Luxemburg; the extreme figures quoted for the bottom group are 8.6 % for Honduras and 86.8 % for Iran. Data for the intermediate group are reproduced in Table 7. They show that in 1958, Ireland showed the highest concentration on light industries of all the countries in this group, though it was closely followed by Portugal and Puerto Rico in this respect.
[image:13.411.38.375.353.624.2]TABLE 7
HEAVY AS PROPORTION OF TOTAL MANUFACTURING OUTPUT FOR 16
MEDIUM-INDUSTRIALISED COUNTRIES, 1958
Country
Japan Italy South Africa Yugoslavia Mexico Finland Chile
Trinidad and Tobaj Spain
Israel ... . Argentina ... Venezuela ... Uruguay ... Puerto Rico Portugal ... Ireland
% value added
62.2 58.2 56.9 55.5 54.3 52.0 51.8 51.1 50.8 44.4 44.2 35.3 34.5 28.7 27.9 26.8
Source: U.N., The growth of world industry 1938-1961, International analyses and
14
Attempts to explain by means of regression analysis international differences in the contribution made by various industries have been made, particularly by Chenery [2] and in a U.N. study [10] which follows the same approach. In the latter study, the output of each of 13 industry groups is obtained as a function of per capita income, population size and relative level of industrialisation. Other variables, including an indicator of natural resources, had tentatively been included in the equations, but they were eliminated as they did not make any statistically significant con-tribution in the large majority of cases.
A similar relationship has been derived here for the percentage share of heavy industry in total manufacturing value added, using the 1958 data for 75 countries as observations. The explanatory variables are:
P per capita manufacturing value added in $ N total population in millions
Z percentage of mining in value added by all industrial activity. The variable Z is used as indicator regarding the character of natural resources. Ideally, one would prefer to express mining output as a per-centage of all primary production not used for direct consumption, including a substantial portion of agricultural as well as mining output. But the separation of agricultural production for processing from that for immediate consumption is statistically elusive; and Z, although not a perfect indicator, has been chosen as data are available in a convenient form. Denoting by hc the theoretical value of h, the regression equation is:
hc=11.44+ 21.545 log10P +9.426 log10N (2.251) (2.354)
+0.3675 Z (R2=.593) (0.0736)
All three regression coefficients are highly significant. The sign of the first two coefficients implies that a larger share of heavy industries is directly associated not only with a higher degree of industrialisation but also with larger population size, per capita manufacturing output being equal. These findings tally with those of the previous studies quoted [12,10]. The sign of the last coefficient shows that heavy industries, ceterisparibus, play a larger role in countries with substantial mining resources and activity than in others. This, of course, is in accordance with common sense.
15
There is a sound theoretical reason for the finding with regard to popula-tion size. Most heavy industries require a minimum scale of output for economic production, and thus depend on a minimum market size. It is true that population and market size are not identical; in a country with poor transport facilities, only part of it may constitute the market for one of its industries, whilst with free trade or trade agreements, the market may go far beyond national boundaries. Nevertheless the establishment of heavy industries in particular is facilitated if the country has a large population.
The equation given here to explain the differences in composition of manufacturing output is subject to some limitations. For one thing, it only explains about three-fifths of the total variation. In the case of Ireland, it does not explain the high specialisation in light industries. This can be seen as follows:
For the average of the 75 observations we have
h=40.6
This is an unweighted mean and therefore much lower than the weighted mean of 60.4 shown in Table 6, which is heavily influenced by the manu-facturing pattern of the mostly highly industrialised countries, particularly the U.S. with its large weight. For Ireland, the data are:
P=167 N=2.8 Z=3.3 thus hc=41.8
but h=26.8
Although Ireland is a small country with few mining resources, its manufacturing output per head of the population is such that on the basis of the relationship given her, the expected proportion of heavy manu-facturing is above 40 % and above the unweighted mean of 75 countries. The actual proportion in 1958 is well below 30%. Of course, as pointed out before, the indicator Z does not fully reflect the availability of different types of natural resources.
A further limitation of the output relationship is that differences in the level of total manufacturing output act as a statistical bait hardly as an economic explanation of differences in industrial pattern. It leaves the question open why there should be this concentration on light or heavy manufacturing according to whether the volume of industrial output is small or large.
com-16
munity, the proportion of personal expenditure which is devoted to food tends to decline with rising income per head. This general tendency, known as Engel's law, also operates on an international level, in that the share of food expenditure (including drink and tobacco) tends to be between 30 % and 40% in the more advanced but between 50% and 60% in the less developed countries. Conversely, the share of durable household goods and transport equipment in personal expenditure tends to rise as one goes up the scale from low-income to high-income countries.
However, matters are not as simple as might be thought at first. With rising incomes there is also some tendency towards spending a higher proportion of income on light consumer goods such as clothing. Moreover, the relatively high demand for food in low-income countries is not neces-sarily translated into large requirements in terms of food processing industries' net output. In these countries, much of the home-produced food is consumed directly or after light processing, with little manufacturing content, whilst the demand for elaborately processed foods is more prominent in the high-income countries. There would seem to be more validity for the view that the overall demand for manufactured goods is low in the less developed countries and the overall pattern of production, with a low share of manufacturing, is suited to their needs.
Another way in which patterns of home demand may differ from each other lies in the proportion borne by fixed capital formation, personal and government consumption (and possibly stock building) being the other components. In fact, there is a tendency for fixed investment to play a relatively large part as industrialisation proceeds. As far as investment in the form of machinery and transport equipment is concerned, this immedi-ately sets up substantial demand for products of heavy industry; but this also applies to investment in the form of construction activity, which utilises large amounts of metals, mineral products and other materials. To some extent, of course, this merely reflects the fact that the country con-concerned has already achieved a substantial degree of industrialisation, since capital formation is generally measured as a gross figure, containing a substantial replacement element which is proportionate to the stock of fixed capital in existence.
Whilst the variations in the importance of investment work in the same direction as the variations in composition of personal expenditure, the extent to which they contribute towards explaining differences in manu-facturing pattern is limited and should not be overrated. The proportion of home demand occupied by investment is by no means negligible in countries at a low level of development. The relatively low output of heavy manufacturing industries in these countries does not point to a lack of demand for their products in these countries. The substantial imports in these countries of manufactured goods, notably products of the metal and engineering industries, which are matched by exports of primary produce, are evidence for the contrary view.
17
efficient operation of many industries, particularly in the heavy manu-facturing sector, depends on an adequate market size. Where this condition is not fulfilled, circumstances for their establishment are unfavourable. In this sense, demand may be said to have a considerable impact upon a country's industrial structure, though it may well be argued that this is stretching the meaning of demand too far.
There are other difficulties with which the establishment of most heavy industries is faced in the early stages of industrialisation. Indeed, according to Hoffman [5] the industrial structure provides the very criterion by which the stage of industrialisation reached may be determined. The ratio of consumer goods output to capital goods output which he uses is a measure which is very similar to the proportions of heavy and light manufacturing. Rigid application of this criterion leads to somewhat paradoxical results when it is used to determine the stage of industrialisation which the presently developed countries had reached at any given time, say in the last century. For example, Great Britain would have to be envisaged as still having been in the first stage of industrialisation by 1870, whilst the United States had already reached the second stage.
As a general proposition, it is nevertheless correct to say that the majority of light consumer industries develop at an early stage, and the majority of heavy capital goods industries at a later stage of industrialisa-tion. It certainly applies to most countries which were among the first to experience their industrial revolution, particularly to Great Britain. This phenomenon is, however, partly explained by a calendar date effect and only partly by an industrialisation stage effect. Around 1800, clothing occupied an important part in the consumer's budget and there was a large potential market for increased production. Hence conditions were particularly on the Asian continent, and which manifests itself in a low now is somewhat more complex.
Perhaps the clearest description of the situation that prevails in the initial stages of a country's industrial development is that supplied by Baldwin [1]. His thesis is that the first industries coming into being are those providing either essential consumer goods, or capital goods required for construction, or processed exports based on natural resources. Whilst the industries in the first and third categories fall largely into the light manufacturing sector, this does not apply to those in the second category, which to a large extent belong to the industry group of "non-metallic mineral products". Indeed, this industry group does not follow the general pattern of heavy manufacturing and generally tends to be well represented in less industrialised countries.
The character of domestic natural resources and the importance of processing industries based on them, both at an early stage of industrialisa-tion and during further growth, varies from country to country. When studying the influence of domestic primary resources on the composition of manufacturing output, the broad division into light and heavy manu-facturing loses much of its meaning, and a more detailed consideration, going even beyond the industry group level to the industry level, is required.
18
the raw material is so perishable that it must be processed here and then, or not at all, as in the case of fish and fruit. The same applies when the raw material is bulky and loses weight in the production process so that a considerable saving in transport cost is achieved by locating the industry near the source, as the case of crude sugar production and saw-milling. In other instances, for example, with grain and flour, the raw material is easier to transport than the finished product, with the result that the flour milling industry tends to be set up near its markets.
There are also cases in which the raw material can be exported without loss of quality though there is no particular advantage in transporting it in crude rather than in processed form. Examples are found in the field of textiles, notably the cotton industry. Cotton lint is produced in a number of Asian, African and American countries and is utilised in many of them for the production of cotton yarn and fabrics. On the other hand, industries based on imports of cotton and other fibres have also been successfully set up in countries which are not rich in natural resources, such as China (Taiwan) and Hong Kong.
In view of the character of Ireland's natural resources, the composition of its manufacturing output a decade ago is not as abnormal as comparison with other countries at a similar stage of industrialisation might suggest. Subsequent development such as the growth of the metal industry, the establishment of petroleum refining and fertiliser plants ,are also much in line with general patterns of increasing industrialisation.
4 OBSTACLES AND PROSPECTS
If it is a correct assessment of the position to regard manufacturing as the key sector for economic growth, then recent movements in this sector are obviously of outstanding interest. Table 8 shows the estimated growth of manufacturing production between 1968 and 1965 for those countries for which data in the form of production volume index numbers are available. Changes in total population are also shown and contrasted with changes in industrial output. The countries are grouped as previously, the centrally planned economics of Eastern Europe being shown together, side by side with other medium-industrialised countries, irrespective of their varying industrial potential.
A number of conclusions may be drawn from this table. What is perhaps the most striking feature is the contrast between the high degree of uni-formity observed for the most highly industrialised countries, and the wide variety of experiences which other countries have undergone. In most of the countries in the top group, the average annual growth in manu-facturing production between 1958 and 1965 was a little above 5%. But out of eleven countries listed which belong to the least industrialised group, there are four in which manufacturing growth exceeded 10% per annum, and 3 in which it fell short of 5 % per annum.
19
high-income countries. Argentina, which experienced a very severe depression in the early 1960s, provides the chief exception to the rule.
If one accepts the analysis of Rostow [9] one will probably look at all or most of the countries in the intermediate group as having passed the take-off stage, and therefore consider their continued industrial progress as more or less assured. For countries starting from a lower level of industrialisation, sustained progress seems more uncertain and largely depending on government policy and its effectiveness as well as on aid from abroad. There are, however, also schools of thought which would take a less optimistic view for the medium-industrialised countries and consider premature stagnation as a serious possibility confronting them.
There are both advantages and disadvantages in being new to the industrial scene. In Great Britain, the first country to experience the industrial revolution, modern industry as we know it now developed slowly as new manufacturing techniques were brought into being. Countries such as the United States, Germany, Sweden and Japan which industrialised later on appear to have achieved higher growth rates than early industrial Britain, if data given by Hoffman [4] and the League of Nations [7] are accepted. The developing countries of today are able to draw upon a large body of technical knowledge and experience which they can use provided they adapt them to the particular setting of their economic and social environment. On that score, one should expect to find that these countries experience even more favourable results than those in which the process was largely completed in the nineteenth century.
There, are, however, difficulties in the present-day situation which did not confront the countries of Europe and North America at the time. One unfavourable feature is the high density of population pressing upon natural resources which already exist in countries prior to industrialisation, particularly on the Asian continent, and which manifests itself in a low supply of land and low agricultural output per worker.
An allied feature is the rapid population growth which is observed in most non-European countries at the present time. This is shown in Table 8, an index of 115 in the second column of figures for example corresponding to an annual population increase by 2 %. Population growth tends to be in inverse relation with industrialisation, being in the neighbourhood of 1 % for the highly industrialised and above 2% for the bulk of the least industrialised countries for which figures are quoted.
20
TABLE 8
INCREASE IN MANUFACTURING OUTPUT AND POPULATION, 42 COUNTRIES, 1958 TO 1965
Country Australia Austria Belgium Canada France
Germany (Fed. Rep.) .. Luxemburg Netherlands Norway Sweden Switzerland United Kingdom United States Argentina Chile Finland Ireland Israel Italy Japan Mexico Portugal South Africa Spain Venezuela Czechoslavakia
Germany (Dem. Rep.) .. Hungary Poland Roumania Yougoslavia China (Taiwan) El Salvador Greece Guatemala India Korea (Rep.) Pakistan Philippines Rhodesia (S.) Senegal Zambia
1965 (1958 = 100)
Output Population Per capita output 148 147 158 155 142 162 127 L
163 151 157 154 134 L
156 115 104 105 115 109 109 107 110 105 104 114 105 113 128 142 151 135 130 148 119 148 143 150 135 127 139 120 L
153 172 159 239 H
178 267 H
174 180 171 194 191 161 163 189 185 247 H
226 H
112 117 106 101 128 105 107 127 105 118 106 128 105 98 103 109 105 108 107 131 163 158 186 169 250 137 171 145 183 150 153 166 184 169 234 209 277 H
226 H
155 134 L
168 207 H
236 H
149 134 L
120 L
162 126 126 105 124 118 122 116 125 125 118 122 219 179 148 108 143 170 204 119 107 102 133
H: higher growth than 10% p.a. (195 or more). L: lower growth than 5 % p.a. (140 or less)
21
Furthermore, the impact of even a high manufacturing growth rate is limited if it starts from a narrow base. In a country where manufacturing accounts for but a small fraction of the national product, a high rate of growth in this sector does not necessarily imply a substantial increase in the volume of consumer goods available for the population. In such con-ditions, an expansion in agricultural output will be felt more in the short run; in the long run, such an increase in the agricultural sector, too, must rely on the support it receives from the industrial sector. It is, however, clear that developing countries must be patient and cannot expect quick results in improving the standard of living of their population. After all, what happened to the working classes in the European industrial revolu-tion and to the peasants in the early phases of the U.S.S.R. is a familiar story.
Moreover, the industries on which the developing countries specialise are not, on the whole, those with the best growth record. It has been shown that heavy manufacturing industries are on the whole not well represented in countries which are at an early stage of industrialisation. Yet Table 9 shows that it is these very industries which, in the world as a whole, tended to increase their output at the highest rate, both during the decade 1948-58 and since then.
[image:21.410.39.360.336.603.2]TABLE 9
WORLD INCREASE IN OUTPUT OF MANUFACTURING INDUSTRY GROUPS, 1948 TO 1966
Industrial group
All manufacturing Light manufacturing Heavy manufacturing
Food, beverages and tobbacco ... Textiles
Clothing, footwear and made-up textiles Wood products and furniture
Paper and paper products
Chemicals, petroleum and coal products Non-metallic mineral products
Basic metals Metal products
Index (1958 = 100)
Excluding U Eastern
1948
62 69 56 68 74 74 73 57 46 60 76 55
.S.S.R. and Europe
1966
171 149 185 135 145 147 154 166 207 163 170 186
Including U.S.S.R. and Eastern
Europe
1965
169 145 184 138 137 143 164 156 198 178 170 187
22
This conclusion remains valid on a less aggregated level. Between 1948 and 1958, world production in any of the four light industry groups increased less sharply than that in any of the five heavy industry groups with the exception of "basic metals" which suffered from a temporary set-back in the 1958 recession. Between 1958 and 1966, the differential in favour of heavy manufacturing groups is present without exception and is particularly marked for chemical and metal products industries. The inclusion of the centrally planned economies for which data are available does not materially affect the picture.
Of course, there is a limit to the relevance of such generalisations. Some industry groups, notably the food processing, chemical and metal products industries embrace within their ranks a wide variety of trades possessing very different economic characteristics and playing very different roles in economic development. Furthermore, growth prospects of the same industry group or industry may vary considerably from country to country.
The reason for this is the initial specialisation of a country, largely following the availability of natural resources. Much of the subsequent industrial growth is in the form of increased output of some products and in the form of creating related or ancillary industries. In the long run there may be a tendency towards greater industrial diversity, with a pattern of manufacturing resembling that of the more mature economies. At an earlier stage of development, diversity does not seem to matter as much as the establishment of industries which will provide further growth within the manufacturing sector and in the rest of the economy.
Nevertheless, the apparent limits to the world demand for additional products of the light industries makes realistic assessment of the market potentials essential with regard to these industries in particular. Mistakes in investment policy have no doubt been made in the past in all countries of the world. The need for protection of infant industries by tariffs has probably been an aggravating factor in so far as many industries did not ultimately become viable. The example of high-cost textile industries set up in Latin American countries under tariff protection and subsequently stagnating is often quoted as a case in point.
When comparing the present-day setting for industrial development with that of the nineteenth century, one or two further points stand out. At that time, industrialisation was largely a piece-meal process, taking place in a limited number of countries at any one time. Nowadays, many countries representing the majority of the world's population, are simul-taneously striving to transform their economies, thereby engendering large requirements for capital and problems of finance. In this respect, a small country has perhaps a better chance of securing help from abroad than a large country, in which the magnitude of the task involved implies that it may largely be left to its own resources.
23
considerations for an industry, which do not take into account reper-cussions upon the rest of the economy, have become more clearly recognised. A positive role of national governments as well as international agencies in promoting industrial development has thus come to be accepted.
The point has been made that the economy of Ireland, although having some features in common with the rest of Europe, in some respects may be fairly compared with countries at a similar level of industrialisation in other continents. Without spelling out matters in detail, the general points made may, perhaps, be considered as having some relevance to this country.
SUMMARY
1. Manufacturing output per head of the population is a suitable indicator of a country's economic development.
2. A rise in this indicator is generally accompanied by rises both in manufacturing employment and output per worker.
3. Emphasis on relatively high employment or high output per worker varies in response to conditions confronting a country.
4. The general overall pattern of economic development is one of rapid growth in manufacturing, slow growth in agriculture and medium growth in other sections.
5. There is a link between agricultural and industrial development but the push generally comes from industry.
6. The less developed countries concentrate strongly on light industries compared with the advanced countries, though some heavy industries tend to be fairly well represented.
7. The character of natural resources has an important influence on the pattern of manufacturing, particularly in the developing countries.
8. There are wide variations in the growth experience of countries other than the most highly industrialised ones; for the least industrialised countries, growth seems less assured than for those in the intermediate group.
9 On the whole, heavy industries are expanding more rapidly than light industries, which is to the disadvantage of the developing countries.
10. In present-day conditions, establishment of new industries requires more careful assessment of prospects and more government participation than at the time of the industrial revolution.
DISCUSSION
24
There are a number of points worth developing at this stage. As regards our industrial structure, Dr. Leser has demonstrated that the industries in which we have specialised are not those which, in the world as a whole, tend to contribute the highest increase in output. Also on this topic, Dr. Leser has reminded us that we must keep before us the fact that diversity is not as important as the establishment of industries which will provide further growth within the manufacturing sector and in the rest of the economy.
These are crucial matters for our future industrial development. Up to recently our policy has been to build up an industrial sector providing a wide range of products for a small market. Even the system of adaptation grants, which were introduced to bring the efficiency of Irish firms and industries more into line with those of other countries with which we will have to compete, tended to build on the old structure rather than reorganise it for freer trading conditions. It can be argued that firms had to provide forward production plans which were taken into account in approving their grant applications. However, there appears to have been little if any assessment of whether the firms products could be sold in free trade conditions.
From now on, we will have to work towards building an industrial sector providing a narrower range of products for a much larger market. In line with this, if, as I very much hope, grants and other incentives are introduced to substitute for the now ceased adaptation grants, they will have to be based on competitive market considerations. The new incentives must be part of a comprehensive industrial development programme calculated to encourage firms to choose the lines which will have the best chance of succeeding in the competitive conditions of free trade. Among other things this will mean less emphasis on goods which can be mass pro-duced and products in which price is the key factor. Instead, greater con-centration will be needed on specialised articles, incorporating such characteristics as quality or special design. More attention will also have to be given to industries based on natural resources, those with a high technological content and those providing special advantages such as linkage.
There is, therefore, an urgent need for a change of emphasis in our industrial development programme. In line with this as Dr. Leser suggests, we should look at the policies necessary for encouraging the macimum growth potential for industry. As regards grants for domestic industry it is extremely important that a new system be introduced to replace the adapta-tion grants which ceased on 30th September last. While many Irish firms have made tremendous efforts to prepare for free trade conditions, a good deal remains to be done. Grants and other incentives will be needed for a time yet if we are to achieve the necessary state of preparedness. Apart from this, if new grants are not introduced there is a very grave danger that the idea which exists in some quarters, that adaptation is a once for all effort and once made will put us on a competitive footing with other countries will become more widespread and create an entirely wrong attitude.
25
perhaps somewhat higher for the development areas, are therefore needed. Of course, as already mentioned they should be related to market con-siderations and be part of a programme to encourage firms to concentrate on the lines most likely to succeed in free trade. Dr. Leser touched on this point when he said in connection with light industries that the apparent limits in the world demand for additional products makes realistic assess-ment of the market potential essential with regard to these industries in particular.
Further incentives which favour progressive firms are also necessary. In this connection, the system of optional wear and tear rates introduced to the Twelve Western Counties in the last Budget, could usefully be extended to the rest of the country. Not only would this provide an investment incentive in its own right, but it would also encourage the replacement of plant, which although in perfect working order, may be technically obsolete. In this way the tax incentive of optional wear and tear rates would be of the utmost value in helping Irish industry produce the highest quality goods at competitive costs.
Another measure which should.be considered is a reduction in direct taxation, both company and personal. This could be achieved by relying more on indirect taxation, as is the trend in Continental countries, the T.V.A. system in E.E.C. being a case in point. Such a policy would provide a stimulus to industrial exports and investment. It would also be an incentive to the management and key personnel which Ireland must attract and maintain to run its industries. In addition, it would be a deterrent to excessive consumer expenditure and it would encourage savings and thereby facilitate higher levels of productive expenditure.
An improved investment incentive scheme is also necessary to attract new firms and industries which will survive and help our industrial develop-ment. However, Mr. Walsh of the Industrial Development Authority is present and may want to say a word on this subject.
Investment incentives and reduced direct taxes are, of course, only one aspect of a comprehensive industrial development programme. They will not of themselves bring such development unless the environment for industrial growth is right. The amount of private enterprise and the degree of risk private entrepreneurs are prepared to take will be influenced by the opportunity for making profits. Here I would definitely take issue with Dr. Leser when he tends to play down the importance of the profit motive.
26
will be held back if these matters are not tackled immediately.
There are many other matters which need attention. For example train-ing, both at operative and management level, will have to be developed. Another important need is a comprehensive State backed research and development programme to help firms with their product policy. These, together with the other measures, such as investment incentives, direct tax reliefs, the creation of the right environment and infrastructural develop-ment, will have to be planned within the context of an overall industrial development programme. Their full effectiveness will be hampered if they are treated in isolation as has been the tendency in the past.
Dr. Leser has quoted the school of thought which takes the pessimistic view that premature stagnation is a serious possibility for the medium industrialised countries. However, given a sound and comprehensive industrial development programme. I think it safe to say that many of our industrialists, by their progress to date, give reason for confidence that, in the terms of Rostow, we have passed the take-off stage and are all set for continued industrial progress.
On this note it gives me great pleasure to propose the vote of thanks to Dr. Leser for his most interesting paper.
Mr. J. J. Walsh: I am particularly happy to welcome a paper that falls into the relatively narrow category of studies that help directly to provide a framework of policy.
An aspect of the paper of particular interest is the relative position of Ireland in heavy industry am(png medium industrialised countries (Table 7). Undoubtedly a further reason for this situation has been the long-term proximity of the country, as an agricultural appendage, to one of the most highly developed industrial areas in the world. With the development of major technological and political changes particularly since the Second War the balance of international advantage and disadvantage has been continually shifting. It would be inappropriate to go into this subject in detail here. I need mention only the technical and marketing pressures towards industrial organisation conceived and structured on a continental scale, the massive American investment in Europe stemming from greater resources and adaptability to these pressures, and the revolution in trans-port linked to a substantial extent with the increasind dependence on Europe on increasingly distant sources of supply of basic materials. It is against a background of growth and change that we must try to develop industry on the basis of complimentarity within an international frame-work.
27
fact that over 90% of the increase in exports of transportable goods between 1960 and 1966 was attributed to new industries, mostly grant aided, which commenced production during the period. We are still, however, at a relatively early stage in the development of technology and infrastructure to sustain the most advanced industry. Classification such as that between light and heavy industry need to be re-examined from time to time. Other-wise account may not be taken of major technological developments which, for instance, in recent years have changed certain.light industries from being labour-intensive to being capital intensive. Yet the importance of heavy industry as defined cannot be overlooked. Products of metal working and metal transforming industries account for some 60 % of world trade in manufactured goods. Alfred Maizels, quoted by Professor Leser, considers that in the final quarter of this century international trade in manufactured goods will be mainly in the development section of enginere-ing and chemical products.
How do we, with economy and realism, increase the proportion of total output (which I estimate at about 32% in 1966) attributed to heavy industry? To avoid misunderstanding it should perhaps be made clear that 'heavy industry' is a statistical classification that does not by any means imply that the products of this sector are all necessarily capital intensive or require enormous throughput to support minimum economic scale. Many of the products are components or subassemblies requiring skills but no exceptional scale of investment. It is notable that with the extension of mass production to new areas particularly in the field of construction, com-ponents are entering increasingly into international trade. This is one fruit-ful area which has already been the source of a nember of manufacturing projects here which have considerable capacity for growth. !
A considerable task in the future will be to ensure that Irish industry will be buoyant enough to flow into the mainstream of international growth. It has become a cliche to speak of the increasing pace of technological change. It seems fair to say that if European industry cannot keep pace with American in import sectors of growth we cannot do so unaided. It will be essential for us in the coming years to attract greater numbers of inter-national leaders in growth industries to establish factories in Ireland. This will not be easy as the competition for international investment in industry is, if anything, increasing in intensity. It will also be important to facilitate associations between existing industry and industry abroad. Perhaps exist-ing industry is too "product orientated" and would benefit from an approach based more on profit opportunities in external markets. On this basis amalgamation of older firms could well extend across industry boundaries. Broadly speaking, the aim should be for consumer products to avoid confrontation with mass production goods by concentration on design and quality and for industrial goods to aim at products requiring high skills and substantial vaule added.
28
might be said that the raising of educational and training standards at all levels is the single most important condition for success in development. We will also have to take account of limitations imposed by transport facilities, though improvements in these facilities and the extension of the range of goods capable of being air freighted can significantly improve our position. We could also benefit from the existence of deepwater facilities in the West in the context, I have already mentioned, that more and more basic materials for European industry must be transported from outside Europe.
Professor R. Lynn: The conclusion drawn in the penultimate paragraph -to the effect that the profit motive is no longer sufficient -to achieve growth and needs replacement or supplementation by Government action - does not follow from the body of the paper and is not argued in it. It is, in fact, a quite different point and a highly contentious one. The theory of the advantages of state planning is in essence the theory that academic economists, civil servants and politicians are wiser about business affairs than businessmen themselves. While this theory enjoys a certain vogue, as is natural, among economists, it has suffered a severe setback as a result of the dreadful state of the economy in the United Kingdom after three years of planning (1964-67). A considerable number of academics are in fact opposed to state intervention in in industry, for example Professor Jewkes of Oxford University in a paper published eight weeks ago ("No Industry Without Enterprise" in Growth Through Industry, Institute of Economic Affairs, London, September, 1967). It seems to me misleading to suggest that there is any consensus of agreement on the necessity for state intervention in industry.
Dr. R. C. Geary: Taking a line from Mr. Clarke's observations about Input-Output, I may say that I have pressed unremittingly for an annual Irish table, as a natural extension of the work of the Census of Industrial Production in C.S.O. In no other way can we study the year-to-year changes in the technical coefficients of the table. A table at intervals of years is simply not good enough. Still, I am happy to note that a table for 1964 is in preparation.
For my work on decision models, I used a 1960 table. No single factor impressed me so much as the high proportion borne by imports in the unitary cost of capital-type industries, engineering in particular. Surely there is an emphatic policy hint here, and, in speaking, I address myself to Mr. John Walsh. Every capital product nowadays is an assembly job: I read recently that the Jaguar Car Co. had no fewer than 106 sub-contracts. We in Ireland, a small country, cannot hope to manufacture moon rockets from the rawest of materials to the finished product, but we surely can specialise in capital components of a highly defined type. This, I believe, will be the shape of our capital industries in the future.
29
manufacturing output in Ireland, as shown in Table 7. It will be noted that Puerto Rico has practically the same proportion as we have. Now, Puerto Rico, in its relation to U.S.A., is somewhat similar to Ireland in relation to U.K., the connecting link being the high proportion borne by external trade of small countries with single large countries adjoining them. I suggest that if Professor Leser used this proportion as an explanatory (or independent) variable to explain heavy as a proportion of total manu-facturing, he would obtain a significant result.
In my opinion, Table 6 transcends in importance all others in a very interesting paper. Take the single fact that countries with low levels of industrialisation have f of the world population and ^ G.D.P. Manifestly there is catastrophe on a world scale impending on the showing of these figures alone. Some means must be found, for no higher motive than self-preservation, for the richer countries to help the poorer, on a scale hitherto undreamt-of. In the more advanced countries we take it for granted that, by income distribution, we should help our poorer fellowcountrymen. This doptrine must be extended to cover the whole world. I am well aware of the difficulties, national balances of payments being the principal and also there is the natural objection on the part of proud poor countries to accept charity (with a smalT'c"). Still, something must be done on a very large scale and quickly.
I am happy to be in a position to remedy partly the absence of Ireland from "Medium" countries in Table 4. Wild horses would draw from me my source: it was, of course, Brendan Broderick, though C.S.O. is not to be regarded officially as responsible for the roughly estimated figures: Agriculture 108 Manufacturing and Other industry 146 Services 121 Total 124 Ireland makes but a poor showing in the Medium league; it would be better on a per caput basis. The showing emphasises that the year 1953 is not a suitable base as far as Ireland is concerned. In fact, the only misgiving I have about the paper is with regard to the extent to which the findings are influenced by choice of base year.
It is very nice to have Dr. Leser back with us, even temporarily. I hope he will come often, with offerings like this. The truth is he has become more Irish than the Irish themselves, as you will have guessed by his introductory remarks in mellifluous Gaelic. I hope the position is that he can't keep away from us.