The UPC Submission to the WMT 2012 Shared Task on Quality Estimation
Daniele Pighin Meritxell Gonz´alez Llu´ıs M`arquez Universitat Polit`ecnica de Catalunya, Barcelona {pighin,mgonzalez,lluism}@lsi.upc.edu
Abstract
In this paper, we describe the UPC system that participated in the WMT 2012 shared task on Quality Estimation for Machine Translation. Based on the empirical evidence that fluency-related features have a very high correlation with post-editing effort, we present a set of features for the assessment of quality estima-tion for machine translaestima-tion designed around different kinds of n-gram language models, plus another set of features that model the quality of dependency parses automatically projected from source sentences to transla-tions. We document the results obtained on the shared task dataset, obtained by combining the features that we designed with the baseline features provided by the task organizers.
1 Introduction
Quality Estimation (QE) for Machine Translations (MT) is the task concerned with the prediction of the quality of automatic translations in the absence of reference translations. The WMT 2012 shared task on QE for MT (Callison-Burch et al., 2012) required participants to score and rank a set of automatic English to Spanish translations output by a state-of-the-art phrase based machine translation system. Task organizers provided a training dataset of1,832
source sentences, together with reference, automatic and post-edited translations, as well as human qual-ity assessments for the automatic translations. Post-editing effort, i.e., the amount of Post-editing required to produce an accurate translation, was selected as the quality criterion, with assessments ranging from 1
(extremely bad) to 5 (good as it is). The organizers also provided a set of linguistic resources and pro-cessors to extract 17 global indicators of translation quality (baseline features) that participants could de-cide to employ for their models. For the evaluation, these features are used to learn a baseline predictors for participants to compare against. Systems partic-ipating in the evaluation are scored based on their ability to correctly rank the 422 test translations (us-ing DeltaAvg and Spearman correlation) and/or to predict the human quality assessment for each trans-lation (using Mean Average Error - MAE and Root Mean Squared Error - RMSE).
Our initial approach to the task consisted of sev-eral experiments in which we tried to identify com-mon translation errors and correlate them with qual-ity assessments. However, we soon realized that simple regression models estimated on the baseline features resulted in more consistent predictors of translation quality. For this reason, we eventually decided to focus on the design of a set of global in-dicators of translation quality to be combined with the strong features already computed by the baseline system.
An analysis of the Pearson correlation of the baseline features (Callison-Burch et al., 2012)1 with human quality assessments shows that the two strongest individual predictors of post-editing ef-fort are then-gram language model perplexities es-timated on source and target sentences. This ev-idence suggests that a reasonable approach to
im-1Baseline features are also described in http://www.
statmt.org/wmt12/quality-estimation-task. html.
Feature Pearson|r| Feature Pearson|r| BL/4 0.3618 DEP/C+/Q4/R 0.0749
BL/5 0.3544 BL/13 0.0741
BL/12 0.2823 DEP/C−/Q1/W 0.0726
BL/14 0.2675 DEP/C+/Q4/W 0.0718 BL/2 0.2667 DEP/C+/Q34/R 0.0687
BL/1 0.2620 BL/3 0.0623
BL/8 0.2575 DEP/C+/Q34/W 0.0573
BL/6 0.2143 SEQ/sys-ref/W 0.0495 DEP/C−/S 0.2072 SEQ/sys/W 0.0492 BL/10 0.2033 SEQ/ref-sys/W 0.0390 DEP/C−/Q12/S 0.1858 BL/7 0.0351 BL/17 0.1824 SEQ/sys/SStop 0.0312 BL/16 0.1725 SEQ/sys/RStop 0.0301 DEP/C−/W 0.1584 SEQ/sys-ref/SStop 0.0291 DEP/C−/R 0.1559 SEQ/sys-ref/RStop 0.0289
DEP/C−/Q12/R 0.1447 DEP/Coverage/S 0.0286 DEP/Coverage/W 0.1419 SEQ/ref-sys/S 0.0232 DEP/C−/Q1/S 0.1413 SEQ/ref-sys/R 0.0205 BL/15 0.1368 SEQ/ref-sys/RStop 0.0187 DEP/C+/Q4/S 0.1257 SEQ/sys-ref/R 0.0184 DEP/Coverage/R 0.1239 SEQ/sys/R 0.0177 SEQ/ref-sys/PStop 0.1181 SEQ/ref-sys/Chains 0.0125 SEQ/sys/PStop 0.1173 SEQ/ref-sys/SStop 0.0104 SEQ/sys-ref/PStop 0.1170 SEQ/sys/S 0.0053 DEP/C−/Q12/W 0.1159 SEQ/sys-ref/S 0.0051 DEP/C−/Q1/R 0.1113 SEQ/sys/Chains 0.0032 DEP/C+/Q34/S 0.0933 SEQ/sys-ref/Chains 0.0014
[image:2.612.77.297.55.345.2]BL/9 0.0889 BL/11 0.0001
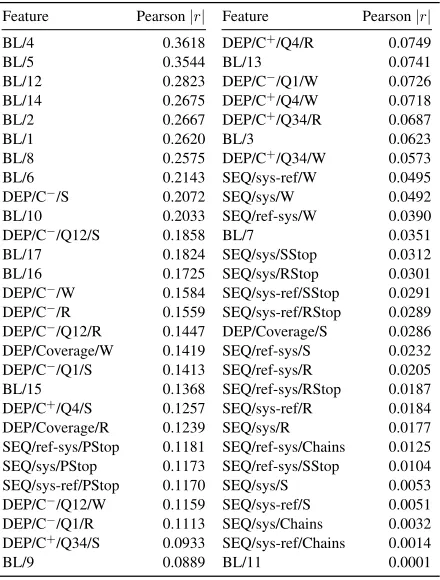
Table 1: Pearson correlation (in absolute value) of the baseline (BL) features and the extended feature set (SEQ and DEP) with the quality assessments.
prove the accuracy of the baseline would be to con-centrate on the estimation of othern-gram language models, possibly working at different levels of lin-guistic analysis and combining information coming from the source and the target sentence. On top of that, we add another class of features that capture the quality of grammatical dependencies projected from source to target via automatic alignments, as they could provide clues about translation quality that may not be captured by sequential models.
The novel features that we incorporate are de-scribed in full detail in the next section; in Sec-tion 3 we describe the experimental setup and the resources that we employ, while in Section 4 we present the results of the evaluation; finally, in Sec-tion 5 we draw our conclusions.
2 Extended features set
We extend the set of 17 baseline features with 35 new features:
SEQ: 21 features based onn-gram language mod-els estimated on reference and automatic trans-lations, combining lexical elements of the tar-get sentence and linguistic annotations (POS) automatically projected from the source;
DEP: 18 features that estimate a language model on dependency parse trees automatically pro-jected from source to target via unsupervised alignments.
All the related models are estimated on a cor-pus of 150K newswire sentences collected from the training/development corpora of previous WMT edi-tions (Callison-Burch et al., 2007; Callison-Burch et al., 2011). We selected this resource because we pre-fer to estimate the models only on in-domain data. The models for SEQ features are computed based on reference translations (ref) and automatic trans-lations generated by the same Moses (Koehn et al., 2007) configuration used by the organizers of this QE task. As features, we encode the perplexity of observed sequences with respect to the two models, or the ratio of these values. For DEP features, we es-timate a model that explicitly captures the difference between reference and automatic translations for the same sentence.
2.1 Sequential features (SEQ)
The simplest sequential models that we estimate are 3-gram language models2 on the following se-quences:
W: (Word), the sequence of words as they appear in the target sentence;
R: (Root), the sequence of the roots of the words in the target;
S: (Suffix) the sequence of the suffixes of the words in the target;
As features, for each automatic translation we en-code:
• The perplexity of the corresponding sequence according to automatic (sys) translations: for
2We also considered using longer histories, i.e., 5-grams, but
example, SEQ/sys/R and SEQ/sys/W are the root-sequence and word-sequence perplexities estimated on the corpus of automatic transla-tions;
• The ratio between the perplexities according the two sets of translations: for example,
SEQ/ref-sys/Sis the ratio between the perplex-ity of suffix-sequences on reference and auto-matic translations, andSEQ/sys-ref/S is its in-verse.3
We also estimate 3-gram language models on three variants of a sequence in which non-stop words (i.e., all words belonging to an open class) are re-placed with either:
RStop: the root of the word;
SStop: the suffix of the word;
PStop: the POS of the aligned source word(s).
This last model (PStop) is the only one that requires source/target pairs in order to be estimated. If the target word is aligned to more than one word, we use the ordered concatenation of the source words POS tags; if the word cannot be aligned, we replace it with the placeholder “*”, e.g.: “el NN de * VBZ JJ en muchos NNS .”. Also in this case, different features encode the perplexity with respect to au-tomatic translations (e.g., SEQ/sys/PStop) or to the ratio between automatic and reference translations (e.g.,SEQ/ref-sys/RStop).
Finally, a last class of sequences (Chains) col-lapses adjacent stop words into a single token. Content-words or isolated stop-words are not in-cluded in the sequence, e.g: “mediante la de los de la y de las y la a los”. Again, we consider the same set of variants, e.g. SEQ/sys/Chains or
SEQ/sys-ref/Chains.
Since there are 7 sequence types and 3 combinations (sys, sys-ref, ref-sys) we end up with 21 new fea-tures.
3
Features extracted solely from reference translations have been considered, but they were dropped during development since we could not observe a noticeable effect on prediction quality.
2.2 Dependency features (DEP)
These features are based on the assumption that by observing how dependency parses are projected from source to target we can gather clues concern-ing translation quality that cannot be captured by se-quential models. The features encode the extent to which the edges of the projected dependency tree are observed in reference-quality translations.
The model for DEP features is estimated on the same set of 150K English sentences and the corresponding reference and automatic translations, based on the following algorithm:
1. Initialize two mapsM+andM−to store edge counts;
2. Then, for each source sentences: parseswith a dependency parser;
3. Align the words ofswith the reference and the automatic translationsranda;
4. For each dependency relation hd, sh, smi
ob-served in the source, where d is the relation type andsh andsm are the head and modifier
words, respectively:
(a) Identify the aligned head/modifier words inranda, i.e.,hrh, rmiandhah, ami;
(b) If rh = ah and rm = am, then
incre-mentMh+d,a
h,amiby one, otherwise
incre-mentMh−d,a
h,ami.
In other terms,M+keeps track of how many times
a projected dependency is the same in the automatic and in the reference translation, whileM−accounts for the cases in which the two projections differ.
LetT be the set of dependency relations projected on an automatic translation. In the feature space we represent:
Coverage: The ratio of dependency edges found in
M−orM+over the total number of projected edges, i.e.
Coverage(T) =
P
D∈T MD++M
−
D
|T| ;
C+: The quantityC+ = |T1|P
C−: The quantityC−= |T1|P
D∈T MD− MD+−MD−.
Intuitively, high values ofC+ mean that most pro-jected dependencies have been observed in reference translations; conversely, high values ofC− suggest that most of the projected dependencies were only observed in automatic translations.
Similarly to SEQ features, also in this case we ac-tually employ three variants of these features: one in which we use word forms (i.e., DEP/Coverage/W,
DEP/C+/W and DEP/C−/W), one in which we look at roots (i.e., DEP/Coverage/R, DEP/C+/R
and DEP/C−/R) and one in which we only con-sider suffixes (i.e.,DEP/Coverage/S,DEP/C+/Sand
DEP/C−/S).
Moreover, we also estimate C+ in the top (Q4) and top two (Q34) fourths of edge scores, andC−in the bottom (Q1) and bottom two (Q12) fourths. As an example, the featureDEP/C+/Q4/Rencodes the value of C+within the top fourth of the ranked list of projected dependencies when only considering word roots, whileDEP/C−/W is the value ofC− on the whole edge set estimated using word forms.
3 Experiment setup
To extract the extended feature set we use an align-ment model, a POS tagger and a dependency parser. Concerning the former, we trained an unsupervised model with the Berkeley aligner4, an implementa-tion of the symmetric word-alignment model de-scribed by Liang et al. (2006). The model is trained on Europarl and newswire data released as part of WMT 2011 (Callison-Burch et al., 2011) training data. For POS tagging and semantic role annota-tion we use SVMTool5 (Jes´us Gim´enez and Llu´ıs M`arquez, 2004) and Swirl6 (Surdeanu and Turmo, 2005), respectively, with default configurations. To estimate the SEQ and DEP features we use refer-ence and automatic translations of the newswire sec-tion of WMT 2011 training data. The automatic translations are generated by the same configura-tion generating the data for the quality estimaconfigura-tion task. The n-gram models are estimated with the
4http://code.google.com/p/berkeleyaligner 5
http://www.lsi.upc.edu/˜nlp/SVMTool/
6http://www.surdeanu.name/mihai/swirl/
Feature set DeltaAvg MAE
[image:4.612.349.505.56.107.2]Baseline 0.4664 0.6346 Extended 0.4694 0.6248
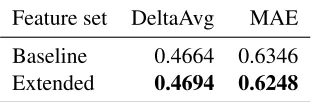
Table 2: Comparison of the baseline and extended feature set on development data.
SRILM toolkit7, with order equal to 3 and Kneser-Ney (Kneser and Kneser-Ney, 1995) smoothing.
As a learning framework we resort to Support Vector Regression (SVR) (Smola and Sch¨olkopf, 2004) and learn a linear separator using the SVM-Light optimizer by Joachims (1999)8. We represent feature values by means of their z-scores, i.e., the number of standard deviations that separate a value from the average of the feature distribution. We carry out the system development via 5-fold cross evaluation on the 1,832 development sentences for which we have quality assessments.
4 Evaluation
In Table 1 we show the absolute value of the Pear-son correlation of the features used in our model, i.e., the 17 baseline features (BL/*), the 21 sequence (SEQ/*) and the 18 dependency (DEP/*) features, with the human quality assessments. The more cor-related features are in the top (left) part of the ta-ble. At a first glance, we can see that 9 of the 10 features having highest correlation are already en-coded by the baseline. We can also observe that DEP features show a higher correlation than SEQ features. This evidence seems to contradict our ini-tial expectations, but it can be easily ascribed to the limited size of the corpus used to estimate the n -gram models (150K sentences). This point is also confirmed by the fact that the three variants of the *PStop model (based on sequences of target stop-words interleaved by POS tags projected from the source sentence and, hence, on a very small vocab-ulary) are the three sequential models sporting the highest correlation. Alas, the lack of lexical anchors makes them less useful as predictors of translation quality than BL/4 and BL/5. Another interesting
as-7
http://www-speech.sri.com/projects/ srilm
System DeltaAvg MAE
Baseline 0.55 0.69
Official Evaluation 0.22 0.84 Amended Evaluation 0.51 0.71
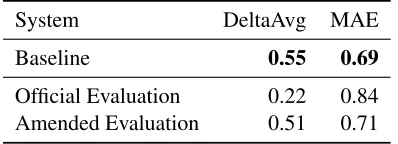
Table 3: Official and amended evaluation on test data of the extended feature sets.
pect is that DEP/C−features show higher correlation than DEP/C+. This is an expected behaviour, as be-ing indicators of possible errors they are intended to have discriminative power with respect to the human assessments. Finally, we can see that more than 50% of the included features, including five baseline fea-tures, have negligible (less than 0.1) correlation with the assessments. Even though these features may not have predictive power per se, their combination may be useful to learn more accurate models of quality.9
Table 2 shows a comparison of the baseline fea-tures against the extended feature set as the average DeltaAvg score and Mean Absolute Error (MAE) on the 10 most accurate development configurations. In both cases, the extended feature set results in slightly more accurate models, even though the improve-ment is hardly significant.
Table 3 shows the results of the official evaluation. Our submission to the final evaluation (Official) was plagued by a bug that affected the values of all the baseline features on the test set. As a consequence, the official performance of the model is extremely poor. The row labeledAmended shows the results that we obtained after correcting the problem. As we can see, on both tasks the baseline outperforms our model, even though the difference between the two is only marginal. Ranking-wise, our official submis-sion is last on the ranking task and last-but-one on the quality prediction task. In contrast, the amended model shows very similar accuracy to the baseline, as the majority of the systems that took part in the evaluation.
9
Our experiments on development data were not signifi-cantly affected by the presence or removal of low-correlation features. Given the relatively small feature space, we adopted a conservative strategy and included all the features in the final models.
5 Discussion and conclusions
We have described the system with which we par-ticipated in the WMT 2012 shared task on quality estimation. The model incorporates all the base-line features, plus two sets of novel features based on: 1)n-gram language models estimated on mixed sequences of target sentence words and linguistic annotations projected from the source sentence by means of automatic alignments; and 2) the likeli-hood of the projection of dependency relations from source to target.
On development data we found out that the ex-tended feature set granted only a very marginal im-provement with respect to the strong feature set of the baseline. In the official evaluation, our submis-sion was plagued by a bug affecting the generation of baseline features for the test set, and as a result we had an incredibly low performance. After fix-ing the bug, re-evaluatfix-ing on the test set confirmed that the extended set of features, at least in the cur-rent implementation, does not have the potential to significantly improve over the baseline features. On the contrary, the accuracy of the corrected model is slightly lower than the baseline on both the ranking and the quality estimation task.
During system development it was clear that im-proving significantly over the results of the base-line features would be very difficult. In our expe-rience, this is especially due to the presence among the baseline features of extremely strong predictors of translation quality such as the perplexity of the automatic translation. We could also observe that the parametrization of the learning algorithm had a much stronger impact on the final accuracy than the inclusion/exclusion of specific features from the model.
[image:5.612.87.286.55.127.2]Acknowledgments
This research has been partially funded by the Spanish Ministry of Education and Science (OpenMT-2, TIN2009-14675-C03) and the Euro-pean Community’s Seventh Framework Programme (FP7/2007-2013) under grant agreement numbers 247762 (FAUST project, FP7-ICT-2009-4-247762) and 247914 (MOLTO project, FP7-ICT-2009-4-247914).
References
[Callison-Burch et al.2007] Chris Callison-Burch, Philipp Koehn, Cameron Shaw Fordyce, and Christof Monz, editors. 2007. Proceedings of the Second Workshop on Statistical Machine Translation. ACL, Prague, Czech Republic.
[Callison-Burch et al.2011] Chris Callison-Burch, Philipp Koehn, Christof Monz, and Omar F. Zaidan, editors. 2011. Proceedings of the Sixth Workshop on Statistical Machine Translation. Association for Computational Linguistics, Edinburgh, Scotland, July. [Callison-Burch et al.2012] Chris Callison-Burch, Philipp Koehn, Christof Monz, Matt Post, Radu Soricut, and Lucia Specia. 2012. Findings of the 2012 workshop on statistical machine translation. In Proceedings of the Seventh Workshop on Statis-tical Machine Translation, Montreal, Canada, June. Association for Computational Linguistics.
[Jes´us Gim´enez and Llu´ıs M`arquez2004] Jes´us Gim´enez and Llu´ıs M`arquez. 2004. SVMTool: A general POS tagger generator based on Support Vector Machines. InProceedings of the 4th LREC.
[Joachims1999] Thorsten Joachims. 1999. Making large-Scale SVM Learning Practical. In B. Scho¨lkopf, C. Burges, and A. Smola, editors,Advances in Kernel Methods - Support Vector Learning.
[Kneser and Ney1995] Reinhard Kneser and Hermann Ney. 1995. Improved backing-off for m-gram lan-guage modeling. InIn Proceedings of the IEEE Inter-national Conference on Acoustics, Speech and Signal Processing, volume I, pages 181–184, Detroit, Michi-gan, May.
[Koehn et al.2007] Philipp Koehn, Hieu Hoang, Alexan-dra Birch, Chris Callison-Burch, Marcello Federico, Nicola Bertoldi, Brooke Cowan, Wade Shen, Chris-tine Moran, Richard Zens, Chris Dyer, Ondrej Bo-jar, Alexandra Constantin, and Evan Herbst. 2007. Moses: Open source toolkit for statistical machine translation. InProceedings of the 45th Annual Meet-ing of the Association for Computational LMeet-inguistics Companion Volume Proceedings of the Demo and
Poster Sessions, pages 177–180, Prague, Czech Re-public, June. Association for Computational Linguis-tics.
[Liang et al.2006] Percy Liang, Benjamin Taskar, and Dan Klein. 2006. Alignment by agreement. In HLT-NAACL.
[Smola and Sch¨olkopf2004] Alex J. Smola and Bernhard Sch¨olkopf. 2004. A tutorial on support vector regres-sion. Statistics and Computing, 14(3):199–222, Au-gust.