A Discourse-Aware Graph-Based Content-Selection Framework
Seniz Demir Sandra Carberry Kathleen F. McCoy Department of Computer Science
University of Delaware Newark, DE 19716
{demir,carberry,mccoy}@cis.udel.edu
Abstract
This paper presents an easy-to-adapt, discourse-aware framework that can be utilized as the content selection compo-nent of a generation system whose goal is to deliver descriptive texts in several turns. Our framework involves a novel use of a graph-based ranking algorithm, to itera-tively determine what content to convey to a given request while taking into account various considerations such as capturing a priori importance of information, convey-ing related information, avoidconvey-ing redun-dancy, and incorporating the effects of dis-course history. We illustrate and evaluate this framework in an accessibility system for sight-impaired individuals.
1 Introduction
Content selection is the task responsible for deter-mining what to convey in the output of a gener-ation system at the current exchange (Reiter and Dale, 1997). This very domain dependent task is extremely important from the perspective of users (Sripada et al., 2001) who have been ob-served to be tolerant of realization problems as long as the appropriate content is expressed. The NLG community has proposed various content selection approaches since early systems (Moore and Paris, 1993; McKeown, 1985) which placed emphasis on text structure and adapted planning techniques or schemas to meet discourse goals.
This paper proposes a domain-independent framework which can be incorporated as a content selection component in a system whose goal is to deliver descriptive or explanatory texts, such as the ILEX (O’Donnell et al., 2001), KNIGHT (Lester and Porter, 1997), and POLIBOX (Chiarcos and Stede, 2004) systems. At the core of our frame-work lies a novel use of a graph-based ranking
al-gorithm, which exploits discourse related consid-erations in determining what content to convey in response to a request for information. This frame-work provides the ability to generate successive history-aware texts and the flexibility to generate different texts with different parameter settings.
One discourse consideration is the tenet that the propositions selected for inclusion in a text should be in some way related to one another. Thus, the selection process should be influenced by the relevance of information to what has already been selected for inclusion. Moreover, we argue that if the information given in a proposition can be deduced from the information provided by any other proposition in the text, this would introduce redundancy and should be avoided.
Many systems (such as MATCH (Walker et al., 2004) and GEA (Carenini and Moore, 2006)) tain a user model which is employed to adapt con-tent selection to the user’s preferences (Reiter and Dale, 1997). Our framework provides a facility to model a stereotypical user by incorporating the a priori importance of propositions. This facility can also be used to capture the preferences of a particular user.
Section 2 describes our domain-independent methodology for determining the content of a re-sponse. Section 3 illustrates its application in an accessibility system for sight-impaired individuals and shows the generation flexibility provided by this framework. Finally, Section 4 discusses the results of user studies conducted to evaluate the effectiveness of our methodology.
2 A Graph-based Content Selection Framework
Our domain-independent framework can be ap-plied to any domain where there is a set of proposi-tions that might be conveyed and where a bottom-up strategy for content selection is appropriate. It is particularly useful when the set of propositions should be delivered a little at a time. For exam-ple, the ILEX system (O’Donnell et al., 2001) uses multiple descriptions to convey the available infor-mation about a museum artifact, since the length of the text that can be displayed on a page is lim-ited. In order to use our framework, an application developer should identify the set of propositions that might be conveyed in the domain, specify the relations between these propositions, and option-ally assess a priori importance of the propositions. Our framework uses a weighted undirected graph (relation graph), where the propositions are captured as vertices of the graph and the edges represent relations between these proposi-tions. While the number and kinds of relations represented is up to the developer, the frame-work does require the use of one specific rela-tion (Redundancy Relarela-tion) that is generalizable to any descriptive domain. Redundancy Relation must be specified between two propositions if they provide similar kinds of information or the infor-mation provided by one of the propositions can be deduced from the information provided by the other. For example, consider applying the frame-work to the ILEX domain. Since the proposition that “this jewelry is produced by a single crafts-man” can be deduced from the proposition that “this jewelry is made by a British designer”, these propositions should be connected with a Redun-dancy Relation in the relation graph.
There is at most one edge between any two ver-tices and the weight of that edge represents how important it is to convey the corresponding propo-sitions in the same text (which we refer to as the strength of the relation between these
proposi-tions). For example, suppose that once a museum artifact is introduced in ILEX, it is more impor-tant to convey its design style in the same descrip-tion as opposed to where it is produced. In this case, the weight of the edge between the proposi-tions introducing the artifact and its style should be higher than the weight of the edge between the propositions introducing the artifact and its pro-duction place.
The framework incorporates a
stereotyp-ical user model via an additional vertex
(priority vertex) in the relation graph. The priority vertex is connected to all other vertices in the graph. The weight of the edge between a vertex and the priority vertex represents the a priori importance of that vertex, which in turn specifies the importance of the corresponding proposition. For example, suppose that in the ILEX domain an artifact has two features that are connected to the proposition introducing the artifact by the “feature-of” relation. The a priori importance of one of these features over the other can be specified by giving a higher weight to the edge connecting this proposition to the priority vertex than is given to the edge between the other feature and the priority vertex. This captures a priori importance and makes it more likely that the important feature will be included in the artifact’s description.
2.1 Our Ranking Algorithm
With this graph-based setting, the most important thing to say is the proposition which is most cen-tral. Several centrality algorithms have been pro-posed in the literature (Freeman, 1979; Navigli and Lapata, 2007) for calculating the importance scores of vertices in a graph. The well-known PageRank centrality (Brin and Page, 1998) calcu-lates the importance of a vertex by taking into ac-count the importance of all other vertices and the relation of vertices to one another. This metric has been applied to various tasks such as word sense disambiguation (Sinha and Mihalcea, 2007) and text summarization (Erkan and Radev, 2004). We adopted the weighted PageRank metric (Sinha and Mihalcea, 2007) for our framework and therefore compute the importance score of a vertex (𝑉
𝑥) as:
𝑃 𝑅(𝑉𝑥) = (1−𝑑) +𝑑∗
∑
(𝑉𝑥,𝑉𝑦)∈𝐸
𝑤𝑦𝑥
∑
𝑤𝑦𝑧
(𝑉𝑧,𝑉𝑦)∈𝐸
𝑃 𝑅(𝑉𝑦)
where𝑤𝑥𝑦 is the weight associated with the edge
between vertices (𝑉
edges, and d is the damping factor, set to 0.85, which is its usual setting.
Once the propositions in a domain are captured in a relation graph with weights assigned to the edges between them, the straightforward way of identifying the propositions to be conveyed in the generated text would be to calculate the impor-tance of each vertex via the formula above and then select the k vertices with the highest scores. However, this straightforward application would fail to address the discourse issues cited earlier. Thus we select propositions incrementally, where with each proposition selected, weights in the graph are adjusted causing related propositions to be highlighted and redundant information to be re-pelled. Because our responses are delivered over several turns, we also adjust weights between re-sponses to reflect that discourse situation.
Our algorithm, shown in Figure 1, is run each time a response text is to be generated. For each new response, the algorithm begins by adjusting the importance of the priority vertex (making it high) and clearing the list of selected propositions. Step 2 is the heart of the algorithm for generating a single response. It incrementally selects proposi-tions to include in the current response, and ad-justs weights to reflect what has been selected. In particular, in order to select a proposition, im-portance scores are computed using the weighted PageRank metric for all vertices corresponding to propositions that have not yet been selected for in-clusion in this response (Step 2-a), and only the proposition that receives the highest score is se-lected (Step 2-b). Then, adjustments are made to achieve four goals toward taking discourse infor-mation into account (Steps 2-c thru 2-g) before the PageRank algorithm is run again to select the next proposition. Steps 3 and 4 adjust weights to reflect the completed response and to prepare for gener-ating the next response.
Our first goal is to reflect the a priori impor-tance of propositions in the selection process. For this purpose, we always assign the highest (or one of the highest) importance scores to the pri-ority vertex among the other vertices (Steps 1 and
2-g). This will make the priority vertex as
influen-tial as any other neighbor of a vertex when calcu-lating its importance.
Our second goal is to select propositions that are relevant to previously selected propositions, or in terms of the graph-based notation, to attract the
selection of vertices that are connected to the se-lected vertices. To achieve this, we increase the importance of the vertices corresponding to se-lected propositions so that the propositions related to them have a higher probability of being chosen as the next proposition to include (Step 2-g).
Our third goal is to avoid selecting propositions that preferably shouldn’t be communicated with previously selected propositions if other related propositions are available. To accomplish this, we introduce the term repellers to refer to the kinds of relations between propositions that are dispre-ferred over other relations once one of the propo-sitions is selected for inclusion. Once a proposi-tion is selected, we penalize the weights on the edges between the corresponding vertex and other vertices that are connected by a repeller (Step
2-d). We don’t provide any general repellers in the
framework, but rather this is left for the developer familiar with the domain; any number (zero or more) and kinds of relations could be identified as repellers for a particular application domain. For example, suppose that in the ILEX domain, some artifacts (such as necklaces) have as features both a set of design characteristics and the person who found the artifact. Once the artifact is introduced, it becomes more important to present the design characteristics rather than the person who found that artifact. This preference might be captured by classifying the relation connecting the proposition conveying the person who found it to the proposi-tion introducing the artifact as arepeller.
Our fourth goal is to avoid redundancy by dis-couraging the selection of propositions connected by a Redundancy Relation to previously selected propositions. Once a proposition is selected, we identify the vertices (redundant to selected
tices) which are connected to the selected
ver-tex by the Redundancy Relation (Step 2-e). For each redundant to selected vertex, we penalize the weights on the edges of the vertex except the edge connected to the priority vertex (Step 2-f) and hence decrease the probability of that vertex being chosen for inclusion in the same response.
previ-Figure 1: Our Ranking Algorithm for Content Selection.
ous discourse into account in order to identify and preferably select propositions that have not been conveyed before and to determine when repetition of a previously communicated proposition is ap-propriate. So once a proposition is included in a response, we have to reduce its ability to compete for inclusion in subsequent responses. Thus once a proposition is conveyed in a response, the weight of the edge connecting the corresponding vertex to the priority vertex is reduced (Step 2-c in Fig-ure 1). Once a response is completed, we penal-ize the weights of the edges of each vertex that has been selected for inclusion in the current re-sponse via a penalty factor (if they aren’t already adjusted) (Step 3 in Figure 1). We use the same penalty factor (which is used in Step 2-d in Fig-ure 1) on each edge so that all edges connected to a selected vertex are penalized equally. However, it isn’t enough just to penalize the edges of the ver-tices corresponding to the communicated proposi-tions. Even after the penalties are applied, a propo-sition that has just been communicated might re-ceive a higher importance score than an uncommu-nicated proposition1. In order to allow all propo-sitions to become important enough to be said at some point, the algorithm increases the weights of the edges of all other vertices in the graph if they haven’t already been decreased (Step 4 in Fig-ure 1), thereby increasing their ability to compete in subsequent responses. In the current implemen-tation, the weight of an edge is increased via a boost factor after a response if it is not connected to a proposition included in that response. The
1We observed that it might happen if a vertex is connected
only to the priority vertex.
boost factor ensures that all propositions will even-tually become important enough for inclusion.
3 Application in a Particular Domain
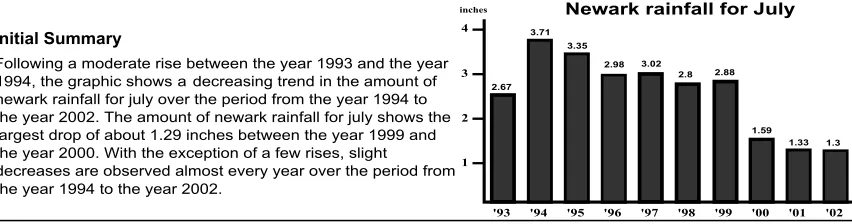
This section illustrates the application of our framework to a particular domain and how our framework facilitates flexible content selection. Our example is content selection in the SIGHT system (Elzer et al., 2007), whose goal is to pro-vide visually impaired users with the knowledge that one would gain from viewing information graphics (such as bar charts) that appear in popu-lar media. In the current implementation, SIGHT constructs a brief initial summary (Demir et al., 2008) that conveys the primary message of a bar chart along with its salient features. We enhanced the current SIGHT system to respond to user’s follow-up requests for more information about the graphic, where the request does not specify the kind of information that is desired.
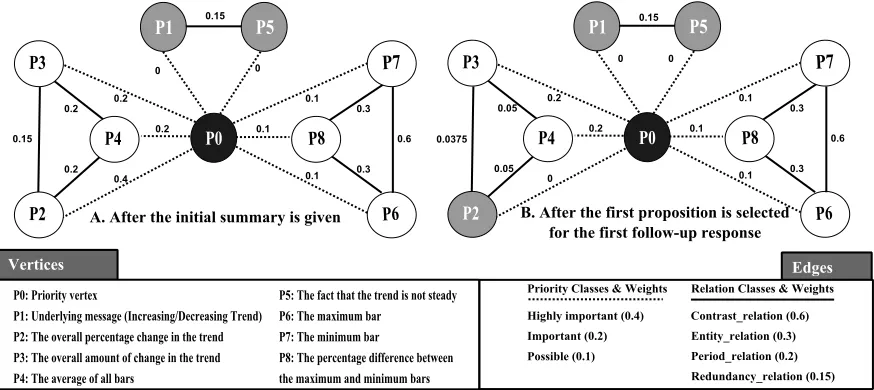
The first step in using our framework is deter-mining the set of propositions that might be con-veyed in this domain. In our earlier work (Demir et al., 2008), we identified a set of propositions that capture information that could be determined by looking at a bar chart, and for each message type defined in SIGHT, specified a subset of these propositions that are related to this message type. In our example, we use these propositions as can-didates for inclusion in follow-up responses. Fig-ure 2 presents a portion of the relation graph, where some of the identified propositions are rep-resented as vertices.
Figure 2: Subgraph of the Relation graph for Increasing and Decreasing Trend Message Types.
studies (Demir et al., 2008), we asked subjects to classify the propositions given for a message type into one of three classes according to their impor-tance for inclusion in the initial summary:
essen-tial, possible, and not important. We leverage
this information as the a priori importance of ver-tices in our graph representation. We define three priority classes. For the propositions that were not selected as essential by any participant, we clas-sify the edges connecting these propositions to the priority vertex into Possible class. For the propo-sitions which were selected as essential by a single participant, we classify the edges connecting them to the priority vertex into Important class. The edges of the remaining propositions are classified into Highly Important class. In this example in-stantiation, we assigned different numeric scores to these classes where Highly Important and Pos-sible received the highest and lowest scores re-spectively.
The third step requires specifying the relations between every pair of related propositions and de-termining the weights associated with these re-lations in the relation graph. First, we identi-fied propositions which we decided should be connected by the Redundancy Relation (such as the propositions conveying “the overall amount of change in the trend” and “the range of the trend”). Next, we had to determine other relations and as-sign relative weights. Instead of defining a unique relation for each related pair, we defined three re-lation classes, and assigned the rere-lations between related propositions to one of these classes:
∙ Period Relation: expresses a relation
be-tween two propositions that span the same time period
∙ Entity Relation: expresses a relation
be-tween two propositions if the entities in-volved in the propositions overlap
∙ Contrast Relation: expresses a relation
be-tween two propositions if the information provided by one of the propositions contrasts with the information provided by the other
We determined that it was very common in this domain to deliver contrasting propositions to-gether (similar to other domains (Marcu, 1998)) and therefore we assigned the highest score to the Contrast Relation class. For local focusing pur-poses, it is desirable that propositions involving common entities be delivered in the same response and thus the Entity Relation class was given the second highest score. On the other hand, two propositions which only share the same period are not very related and conveying such propositions in the same response could cause the text to appear “choppy”. We thus identified the Period Relation class as a repeller and assigned the second low-est score to relations in that class. Since we don’t want redundancy in the generated text, the lowest score was assigned to the Redundancy Relation class. The next section shows how associating particular weights with the priority and relation classes changes the behavior of the framework.
3.1 Generating Flexible Responses
The behavior of our framework is dependent on a number of design parameters such as the weights associated with various relations, the identification of repellers, the a priori importance of informa-tion (if applicable), and the extent to which con-veying redundant information should be avoided. The framework allows the application developer to adjust these factors resulting in the selection of different content and the generation of different re-sponses. For instance, in a very straightforward setting where the same numeric score is assigned to all relations, the a priori importance of infor-mation would be the major determining factor in the selection process. In this section, we will il-lustrate our framework’s behavior in SIGHT with three different scenarios. In each case, the user is assumed to post two consecutive requests for ad-ditional information about the graphic in Figure 3 after receiving its initial summary.
In our first scenario (which we refer to as “base-setting”), the following values have been given to various design parameters that must be specified in order to run the ranking algorithm. 1) The weights of the relations are set to the numeric scores shown in the text labelled Edges at the bottom (right side) of Figure 2. 2) The stopping criteria which speci-fies the number of propositions selected for inclu-sion in a follow-up response (Step 2 in Figure 1) is set to four. 3) The amount of decrease in the weight of the edge between the priority vertex and the vertex selected for inclusion (Step 2-c in Fig-ure 1) is set to that edge’s original weight. Thus, in our example, the weight of that edge is set to 0 once a proposition has been selected for inclusion. 4) The penalty and the redundancy penalty factors which are used to penalize the edges of a selected vertex and the vertices redundant to the selected vertex (Steps 2-d and 3, and 2-f in Figure 1) are set to the quotient of the highest numeric score initially assigned to a relation class divided by the lowest numeric score initially assigned to a rela-tion class. A penalized score for a relarela-tion class is computed by dividing its initial score by the penalty factor. The edges of a vertex are penalized by assigning the penalized scores to these edges based on the relations that they represent. This set-ting guarantees that the weight of an edge which represents the strongest relation cannot be penal-ized to be lower than the score initially assigned to the weakest relation. 5) The boost factor which
is used to favor the selection of previously uncon-veyed propositions for inclusion in subsequent re-sponses (Step 4 in Figure 1) is set to the square root of the penalty factor. Thus, the weights of the edges connected to vertices of previously com-municated propositions are restored to their initial scores slowly.
Since in our example, the initial summary has already been presented, we treat the propositions conveyed in that summary (P1 and P5 in Figure 2) as if they had been conveyed in a follow-up re-sponse and penalize the edges of their correspond-ing vertices (Steps 2-c and 3 in Figure 1). Thus, before we invoke the algorithm to construct the first follow-up response, the weights of edges of the graph are as shown in Figure 2-A. Within this base-setting, SIGHT generates the set of follow-up responses shown in Figure 3A.
In our first scenario (base-setting), we assumed that the user is capable of making mathematical deductions such as inferring “the overall amount of change in the trend” from “the range of the trend”; thus we identified such propositions as sharing a Redundancy Relation. Young read-ers (such as fourth gradread-ers) might not find these propositions as redundant because they are lack-ing in mathematical skills. In our second sce-nario, we address this issue by setting the re-dundancy penalty factor to 1 (Step 2-f in Fig-ure 1) and thus eliminate the penalty on the Re-dundancy Relation. Now, for the same graphic, SIGHT generates, in turn, the second alternative set of responses shown in Figure 3B. The re-sponses for the two scenarios differ in the second follow-up response. In the first scenario, a descrip-tion of the smallest drop was included. However, in the second scenario, this proposition is replaced with the overall amount of change in the trend. This proposition was excluded in the first sce-nario because the redundancy penalty factor made it drop in importance.
Figure 3: Initial Summary and Follow-up Responses.
are in a contrast relation (shown in bold), which changes the ranking of these propositions.
4 Evaluation
To determine whether our framework selects ap-propriate content within the context of an applica-tion, and to assess the contribution of the discourse related considerations to the selected content and their impact on readers’ satisfaction, we conducted two user studies. In both studies, the partici-pants were told that the initial summary should include the most important information about the graphic and that the remaining pieces of informa-tion should be conveyed via follow-up responses. The participants were also told that the informa-tion in the first response should be more important than the information in subsequent responses.
Our goal in the first study was to evaluate the effectiveness of our framework (base-setting) in determining the content of follow-up responses in SIGHT. To our knowledge, no one else has
gener-ated high-level descriptions of information graph-ics, and therefore evaluation using implementa-tions of existing content selection modules in the domain of graphics as a baseline is not feasible. Thus, we evaluated our framework by comparing the content that it selects for inclusion in a follow-up response for a particular graphic with the con-tent chosen by human subjects for the same re-sponse. Twenty one university students partici-pated in the first study and each participant was presented with the same four graphics. For each graphic, the participants were first presented with its initial summary and the set of propositions (18 different propositions) that were used to construct the relation graph in our framework. The partic-ipants were then asked to select the four propo-sitions that they thought were most important to convey in the first follow-up response.
frame-work for inclusion in the first follow-up response with respect to this ranking. The propositions se-lected by our framework were ranked by the par-ticipants as the 1st, 2nd, 3rd, and 5th in the first graphic, as the 1st, 3rd, 4th, and 5th in the sec-ond graphic, as the 1st, 2nd, 3rd, and 6th in the third graphic, and as the 2nd, 3rd, 4th, and 6th in the fourth graphic. Thus for every graph, three of the four propositions selected by our frame-work were also in the top four highly-rated propo-sitions selected by the participants. Therefore, this study demonstrated that our content selection framework selects the most important information for inclusion in a response at the current exchange.
We argued that simply running PageRank to se-lect the highly-rated propositions is likely to lead to text that does not cohere because it may con-tain unrelated or redundant propositions, or fail to communicate related propositions. Thus, our approach iteratively runs PageRank and includes discourse related factors in order to allow what has been selected to influence the future selections and consequently improve text coherence. To ver-ify this argument, we conducted a second study with four graphics and two different sets of follow-up responses (each consisting of two consecutive responses) generated for each graphic. We con-structed the first set of responses (baseline) by running PageRank to completion and selecting the top eight highly-rated propositions, where the top four propositions form the first response. The con-tent of the second set of responses was identified by our approach. Twelve university students (who did not participate in the first study) were pre-sented with these four graphics along with their initial summaries. Each participant was also pre-sented with the set of responses generated by our approach in two graphics and the set of responses generated by the baseline in other cases; the par-ticipants were unaware of how the follow-up sponses were generated. Overall, each set of re-sponses was presented to six participants.
We asked the participants to evaluate the set of responses in terms of their quality in convey-ing additional information (from 1 to 5 with 5 be-ing the best). We also asked each participant to choose which set of responses (from among the four sets of responses presented to them) best pro-vides further information about the correspond-ing graphic. The participants gave the set of re-sponses generated by our approach an average
rat-ing of 4.33. The average participant ratrat-ing for the set of responses generated by the baseline was
3.96. In addition, the lowest score given to the
set of responses generated by our approach was 3, whereas the lowest score that the baseline ceived was 2. We also observed that the set of re-sponses generated by our approach was selected as the best set by eight of the twelve participants. Three of the remaining four participants selected the set of responses generated by the baseline as best (although they gave the same score to a set of responses generated by our approach). In these cases, the participants emphasized the wording of the responses as the reason for their selection. Thus this study demonstrated that the inclusion of discourse related factors in our approach, in addi-tion to the use of PageRank (which utilizes the a priori importance of the propositions and their re-lations to each other), contributes to text coherence and improves readers’ satisfaction.
5 Conclusion
This paper has presented our implemented domain-independent content selection framework, which contains domain-dependent features that must be instantiated when applying it to a particu-lar domain. To our knowledge, our work is the first to select appropriate content by using an incre-mental graph-based ranking algorithm that takes into account the tendency for some information to seem related or redundant to other information, the a priori importance of information, and what has already been said in the previous discourse. Al-though our framework requires a knowledge engi-neering phase to port it to a new domain, it handles discourse issues without requiring that the devel-oper write code to address them. We have demon-strated how our framework was incorporated in an accessibility system whose goal is the genera-tion of texts to describe informagenera-tion graphics. The evaluation studies of our framework within that accessibility system show its effectiveness in de-termining the content of follow-up responses.
6 Acknowledgements
References
S. Brin and L. Page. 1998. The anatomy of a large-scale hypertextual Web search engine. Computer
Networks and ISDN Systems, 30(1-7):107–117.
G. Carenini and J. Moore. 2006. Generating and eval-uating evaluative arguments. Artificial Intelligence, 170(11):925–452.
C. Chiarcos and M. Stede. 2004. Salience-Driven Text Planning. In Proc. of INLG’04.
S. Demir, S. Carberry, and K. F. McCoy. 2008. Gener-ating Textual Summaries of Bar Charts. In Proc. of
INLG’08.
S. Elzer, E. Schwartz, S. Carberry, D. Chester, S. Demir, and P. Wu. 2007. A browser extension for providing visually impaired users access to the content of bar charts on the web. In Proc. of
WE-BIST’2007.
G. Erkan and D. Radev. 2004. LexRank:
Graph-based Lexical Centrality as Salience in Text Summa-rization. Journal of Artificial Intelligence Research, 22:457–479.
L. C. Freeman. 1979. Centrality in Social Networks: I. Conceptual Clarification. Social Networks, 1:215– 239.
J. Lester and B. Porter. 1997. Developing and empir-ically evaluating robust explanation generators: the KNIGHT experiments. Computational Linguistics, 23(1):65–101.
D. Marcu. 1998. The rhetorical parsing, summariza-tion, and generation of natural language texts. PhD.
Thesis, Department of Computer Science, University of Toronto.
K. McKeown. 1985. Discourse strategies for gener-ating natural-language text. Artificial Intelligence, 27(1):1–41.
J. Moore and C. Paris. 1993. Planning text for advisory dialogues: capturing intentional and rhetorical infor-mation. Computational Linguistics, 19(4):651–694.
J. Moore. 1993. Indexing and exploiting a discourse history to generate context-sensitive explanations.
In Proc. of HLT’93, 165–170.
R. Navigli and M. Lapata. 2007. Graph Connectiv-ity Measures for Unsupervised Word Sense Disam-biguation. In Proc. of IJCAI’07, 1683–1688.
M. O’Donnell, C. Mellish, J. Oberlander, and A. Knott. 2001. ILEX: an architecture for a dynamic hypertext generation system. In Natural Language
Engineer-ing, 7(3):225–250.
E. Reiter and R. Dale. 1997. Building applied natural language generation systems. In Natural Language
Engineering, 3(1):57–87.
R. Sinha and R. Mihalcea. 2007. Unsupervised Graph-based Word Sense Disambiguation Using Measures of Word Semantic Similarity. In Proc. of ICSC’07.
S. Sripada, E. Reiter, J. Hunter, and J. Yu. 2001. A
Two-Stage Model for Content Determination. In
Proc. of ENLGW’01.
M. Walker, S.J. Whittaker, A. Stent, P. Maloor, J. Moore, M. Johnston, and G. Vasireddy. 2004. Generation and evaluation of user tailored responses
in multimodal dialogue. In Cognitive Science,