Recent Demographic Developments
in Ireland
By C E V LESER
(Read before the Society on May 28th, \965) 1. INTRODUCTION
Seen from the demographic point of view, Ireland is well known to possess a number of unusual features m comparison with other countries of the Western world The effect on natural population increase of a high average age at marriage, together with a high proportion of men and women who never marry at all, was offset by a large family size for married couples, the natural population increase in turn was offset by a high emigration rate, resulting until recent years m a steady decline m popula-tion size
The Irish population characteristics and problems have attracted a good deal of attention In the report of P E P (1955), for example, a separate chapter is devoted to this country At home, various aspects of population have been studied by Geary (1935-36, 1940-41), by the Commission on Emigration and Other Population Problems (1954) and by Honohan (1960)
There have been some indications in recent years to the effect that the traditional population characteristics are at least being modified At the same time, the improved collection of vital statistics introduced m the 1950s now yields a good deal of material which is published in the Reports on Vital Statistics and which awaits more detailed analysis. In the light also of the results of the 1961 Population Census, it seems worthwhile to reassess the demographic position and prospects
2. MORTALITY
The crude death rate, representing the number of deaths in relation to population size, was m the neighbourhood of 14 per thousand from the 1920s until after the war, when it fell to a lower level of about 12 per 1,000, since the early 1950s there has been no noticeable further change However, the crude death rate is not a fully satisfactory measure of mortality, and it should not be concluded that mortality conditions have remained static in the last decade
The best way of measuring mortality is by means of the life table, showing the number of persons out of an initial total which, at existing mortality conditions, may be expected to reach various ages Official life tables have been published for the average of three years around each Population Census, the most recent one so far referring to the years 1950-52 Through the courtesy of the Central Statistics Office, however, particulars of the 1960-62 life tables, due to be published in the near future, have been made available to me In addition, unofficial abridged life tables for 1955-57 have been constructed for the purpose of this analysis Their accuracy is somewhat limited, not so much because of the method of construction as on account of their being based on an estimated age distribution of the population instead of an exact population count
The most important single indicator of mortality which may be derived from the life table is the expectation of life at birth, showing the arithmetic mean of the number of years which a new-born boy or girl will live under prevailing conditions The changes in this indicator which have taken place in the last thirty-five years are presented in Table 1
TABLE 1
EXPECTATION OF LIFE AT BIRTH (YEARS) 1925-27 TO 1960-62
Period 1925-27 1935-37 1940-42 1945-47 1950-52 1955-57 1960-62
Males 57 4 58 2 59 0 60 5 64 5 67 0 68 1
Females 57 9 59 6 610 62 4 67 1 70 1 719
Table 2, based on data given in the United Nations Demographic Year-book 1963, shows that both the levels of male and female life expectation and the differences between them in Ireland are very much in line with the experience of other European countries
TABLE 2
LIFE EXPECTATION AT BIRTH FOR VARIOUS EUROPEAN COUNTRIES ABOUT 1960
Country
Austria Czechoslovakia Denmark Finland France
Germany Dem Rep Fed Rep Hungary
Netherlands Poland Spam Sweden Switzerland
U K England and Wales Northern Ireland Scotland
Date
1960 1960-61 1956-60 1956-60 1962 1960-61 1959-60 1959-60 1956-60 1960-61 1960 1961 1959-61 1960-62 1960-62 1960-62
Males
65 0 67 6 70 4 64 9 67 3 67 3 66 7 65 2 7 1 4 64 8 67 3 71 6 69 5 68 0 67 6 66 2
Females
7 1 0 73 1 73 8 7 1 6 74 1 72 2 7 1 9 69 6 74 8 70 5 7 1 9 75 4 74 8 74 0 72 4 71 9
However useful a summary measure the life expectation at birth may be, it conceals some interesting features The improvement in mortality con-ditions which took place has not been evenly distributed over the various age groups, and moreover, even m age groups which have a substantial long-term improvement m common, the timing shows noticeable differ-ences A broad picture of these variations is presented in Table 3
Infant mortality remained practically constant between the 1920s and 1940s but fell then, and the fall has continued. In this age group the sex differential m mortality has, if anything, become narrower
Among children, young adults and middle-aged women, on the other hand, the reduction in mortality has been steady and substantial Seen in one way, the improvement is most spectacular in the case of children, 6 out of 100 children aged one were expected to die before reaching the age of fifteen in the 1920s, but only 1 out of 100 children is now so liable There was and is practically no difference between boys and girls in this respect Chances of survival used to be somewhat more favourable for young men than for young women, but the position has now been reversed
the scale there was actually a decline in survivor ratios between 1925-27 and 1945-47, which suggests that a large number of deaths postponed from the ages under 65 now took place between the ages of 65 and 80 More recently, the chances of old people to become octogenarians have improved, much more so for women than for men
TABLE 3
SURVIVOR RATIOS BETWEEN SELECTED AGES (%) 1925-27 TO 1960-62
Ages and Sex Oto 1
Males Females 1 to ^5
Males Females 15 to 45
Males Females 45 to 65
Males Females 65 to 80
Males Females
1925-27
92 3 93 7
94 3 94 0
85 2 83 9
70 2 70 3
37 6 40 8
1935-37
92 0 93 7
95 1 95 2
87 0 86 1
69 8 719
36 5 39 8
1940-42
91 9 93 6
96 1 96 5
87 7 86 7
712 73 8
34 6 38 8
1945-47
92 5 93 9
97 0 97 2
89 3 88 5
72 1 75 6
32 6 38 4
1950-52
95 1 96 1
98 2 98 4
92 3 92 4
74 1 79 3
34 0 40 3
1955-57
96 0 96 9
98 8 99 0
94 6 95 3
75 5 81 5
37 7 44 5
1960-62
96 9 97 6
99 0 99 2
95 2 96 3
76 2 83 2
37 6 46 9
The existing records permit, for recent years, an analysis of mortality not only by age but also by conjugal condition Since people pass on from one civil status group to another, this is conveniently done by standardisa-tion rather than by life tables For the years 1960-62 combined the ex-pected number of deaths among single, married and widowed males has been computed on the assumption that the death rate at each single year of age was the same for each conjugal condition group, and that the age structure of the three groups alone determined the number of deaths, the same has been done for females. Table 4 gives the comparison with actual deaths.
The number of deaths is higher for single and lower for married men and women than expected on the basis of their age structure A result of this kind is generally explained chiefly in terms of selection as the men and women who get married represent, on the whole, the healthier strata of the community which have a better chance of survival
predictable from her state of health than a man's, or else her health has less influence upon the chances of marriage than in the case of the man
Alternatively, it is possible that marriage itself has a beneficial effect in reducing mortality There is some support for this view in the fact that mortality is heavier for widowed than for married men and women, this is not easily explained otherwise
TABLE 4
EXPECTED AND ACTUAL DEATHS FOR EACH CONJUGAL CONDITION 1960-62
Sex and Conjugal Condition Males
Single Married Widowed
TOTAL Females
Single Married Widowed
TOTAL
Expected Number
17,785 25,551 11,253 54,589
13,553 12,539 20,580 46,672
Actual Number
20,239 22,615 11,735 54,589
14,806 11,131 20,735 46,672
Expected=100
113 8 88 5 "104 3 100 0
109 2 88 8 100 8 100 0
Incidentally, one effect of the sex differences in mortality is that almost one-half of the women who die are expected to die as widows, and do so, the same applies to little more than one-fifth of all men
3. NUPTIALITY
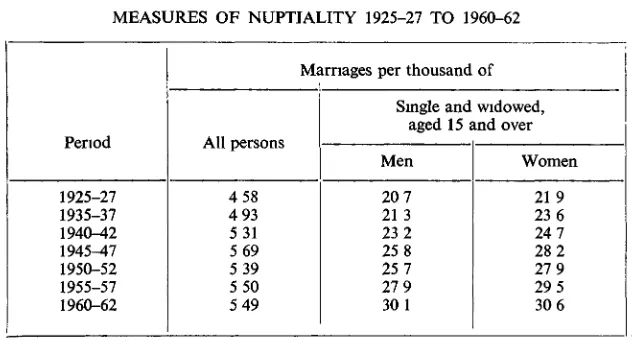
For the last few decades the number of marriages has kept fairly stable near the 15,000 mark, and the marriage rate at about 5 marriages per thousand persons. The marriage rate reached a peak of about 6 per 1,000 during the period 1942-46, after which time it settled down at a somewhat lower level, around 5.5 per 1,000
One might be tempted to conclude that the increasing inclination to marry evidenced by the marriage boom of the 1940s is a merely temporary phenomenon This overlooks the fact that the number of marriages in one period affects the number of marriageable persons, I e single and widowed adolescents and adults, remaining in the population and thus the number of marriages likely to result in subsequent periods with given marriage habits
crude marriage rate, are shown in Table 5 for the average of three years around each Census date
TABLE 5
MEASURES OF NUPTIALITY 1925-27 TO 1960-62
Period
1925-27 1935-37 1940-42 1945-47 1950-52 1955-57 1960-62
Marriages per thousand of
All persons
4 58 4 93 5 31 5 69 5 39 5 50 5 49
Single and widowed, aged 15 and over
Men
20 7 21 3 23 2 25 8 25 7 27 9 30 1
Women 219 23 6 24 7 28 2 27 9 29 5 30 6
It is seen that in relation to the number of marriageable men and women, the number of marriages has shown no sign of decline, but on the contrary the ratio is still increasing The ratio of marriages to marriage-able men has grown faster than the ratio to marriagemarriage-able women recently, on account of the fact that the surplus of single and widowed men over women has been reduced from 50,000 in 1951 to fewer than 10,000 m 1961. It has been said that single women used to emigrate to Britain to increase their chances of finding a husband, if so, it seems that with growing readiness of young men to enter the married state this is no longer an important consideration
The marriage rate varies considerably from area to area To some extent this is due to the celebration and registration of marriages outside the area of the groom's residence, particularly m the cities, however, data which have been corrected for this factor are now available.
Regional differences m sex, age and conjugal status structure may also be taken into consideration Over the three years 1960-62, the number of marriages recorded here for which the groom's residence was m Ireland (26 Counties) amounted to 41,579. From the groom's age distribution and the number of single and widowed males at various ages m each county or borough iri 1961 an expected number of marriages in each area has been computed, on the hypothesis that marriages of men m each age group were distributed over the various areas in proportion to the single and widowed men. In Table 6 the actual number of marriages is compared with the expected total for the area
Wicklow and the very urbanised County Louth with its two sizeable towns, Drogheda and Dundalk The Lemster counties of Carlow, Kildare, Meath, Westmeath and Wexford are also fairly high up the scale m this respect
Relatively few marriages took place in the Connaught and Ulster counties, m Clare and Kerry, as well as m Kilkenny, Laois and Longford. Offaly and most of the Munster counties, excluding their County Boroughs, occupy an intermediate position
The effect of the higher marriage rates has been to reduce the proportion of single persons and conversely to raise the proportion of married persons in the population Table 7 shows the proportions of ever married (married and widowed) among total males for various age groups at each Census date.
TABLE 6
EXPECTED AND ACTUAL
[ Area Carlow
Dublin County Borough Dun Laoghaire Borough Dublin County (remainder) Kildare
Kilkenny Laois Longford Louth Meath Offaly Westmeath Wexford Wicklow Clare
Cork County Borough Cork County
Kerry
Limerick County Borough Limerick County Tipperary North Riding Tipperary South Riding Waterford County Borough Waterford County Galway
Leitnm Mayo Roscommon Shgo Cavan Donegal Monaghan
IRELAND
MARRIAGES
Expected Number
527 6,616 491 1,430 1,009 1,025 802 506 947 980 854 810 1,195 779 1,274 986 4,055 1,870 587 1,328 919 1,091 345 698 2,514 616 1,849 1,013 845 1,028 1,740 850
41,579
IN EACH AREA 1960-62
Actual Number
507 11,777 803 1,621 980 760 602 336 1,117 913 707 744 1,170 929 848 1,629 3,493 1,303 787 1,051 750 910 500 608 1,575 354 1,137 552 583 687 1,224 622
41,579
Expected=100 96 178 164 113 97 74 75
66
118 93 83 92 98 119 67 165 86 70 134 79 82 83 145 87 63 57 61 54 69 67 70 73
TABLE 7
EVER MARRIED AS % OF ALL MALES BY AGE 1926-61
Age group 15-19 20-24 25-29 30-34 35-39 40-44 45-49 50-54 55-59 60-64 65-69 70-74 75-79 80-84 85 and over 15 and over All ages
1926 01 4 0 20 2 37 6 50 4 59 8 66 5 70 7 73 7 74 0 76 6 78 8 817 84 7 88 3 43 8 310
1936 01 38 177 36 5 51 6 60 7 65 3 67 8 71 1 72 5 73 9 75 2 79 4 83 2 86 4 43 2 31 4
1946 0 2 50 20 3 39 0 52 7 62 1 66 6 69 5 69 7 70 4 72 0 73 9 76 9 80 3 82 9 44 9 32 3
1951 0 1 51 23 4 42 1 55 3 64 1 68 0 70 0 714 710 70 7 72 1 76 1 79 1 82 0 47 1 33 5
1961 0 2 7 5 32 8 50 8 61 1 66 4 69 5 71 3 71 8 72 0 72 6 717 72 9 76 7 80 5 51 6 35 3
The proportion of males who are married or widowed has risen steadily since 1936 for each age group under 55 as well as all ages combined, though there have been some declines m the upper age groups The increase in nuptiahty for men between 40 and 55, such as it was, had already been evident by 1951 For the lower age groups the rising propensity to marry is more marked but is largely of more recent origin
Since a sharp differential in nuptiahty between largely urban and largely rural areas has been noted, it may be surmised that the observed increase in nuptiality is to some extent related to the increasing degree of urbanisation Table 8 throws some light upon this point
TABLE 8
PROPORTION OF MALES IN TOWN AREAS AND PROPORTION OF EVER MARRIED MALES IN TOWN AND RURAL AREAS 1926-1961
Year
1926 1936 1946 1951 1961
Males in town areas as % of all males
30 0 33 1 34 5 38 7 43 2
Ever married as % of all males Town Areas
32 9 33 8 34 6 35 6 37 7
187
The proportion of males ever married has risen steadily both in urban and in rural areas, the rise has been somewhat more marked in the former than in the latter. Also the town areas have gained in numerical importance, and this fact coupled with the somewhat higher nuptiahty in the town areas must have made a slight contribution to the general increase m the married and widowed section of the male population
It may seem surprising that the ratios of ever married to all males differ so little between the two types of areas This is, however, explained by differences in age structure Whilst the rural areas contain the predominant share of older family men and women, internal migration brings a con-stant influx of young, largely unmarried, men and women into the towns, who keep the marriage rate at a high level but meanwhile reduce the proportions actually married Table 8 thus cannot help to assess con-clusively the extent to which urbanisation has contributed towards raising nuptiahty, a more sophisticated approach is called for when attempting to answer this question
When individual age groups are analysed the difference in marriage habits between urban and rural areas is shown up very clearly. The largest discrepancy is found m the age group 30-34 years In 1926 the proportion of males who are married was 53 6 % m town areas but only 29.4 % in rural areas, the corresponding 1961 figures are 66 8 % for towns and 36 2 % for rural areas
TABLE 9
ANALYSIS OF CHANGES IN PROPORTIONS EVER MARRIED FOR SELECTED AGE GROUPS, 1926-1951 AND 1951-1961
Age Group
20-24 25-29 30-34 35-39 40-44 45-49
Ever married as % of all males in age group
1926 4 0 20 2 37 6 50 4 59 8 66 5
1951
Expected
4 5 216 38 8 51 3 60 7 67 5
Actual 51 23 4 42 1 55 3 64 1 68 0
1961
Expected
54 24 7 44 3 57 1 64 6 67 9
Actual 75 32 8 50 8 61 1 66 4 69 5
urban-188
isation has been eliminated The analysis has been carried out for each 5-year age group between 20 and 50, which are those of main interest here, and has been repeated starting with 1951 data to give a comparison between 1951 and 1961
The conclusion to be drawn from Table 9 is that the population move-ment from rural to town areas does not in itself explain more than a small fraction of the increase in the proportion of married men The mam explanation must be sought in changing marriage habits which have taken place in both types of areas, particularly during the last decade
From the point of view of population growth, of course, the, key figure is the number of married women under 50 (or perhaps under 45) in the population The proportion which this number bears to the total size of the female population is influenced by changes m both age structure and marriage habits These two factors and their joint influence are shown in Table 10
TABLE 10
PROPORTION OF WOMEN AGED 15-49 AND PROPORTION MARRIED 1926-1961
Year 1926 1936 1941 1946 1951 1956 1961
Women aged 15-49 as % of all females
48 4 47 9 48 7 48 2 46 1 44 6 42 7
Married women aged 15-49 as % of
All women 15-49
38 5 38 5 38 3 42 1 45 1 47 5 50 4
All females
18 6 18 5 18 6 20 4 20 8 21 2 21 5
Both the proportion of the female population m the reproductive age group and the proportion of this section who are married remained practically constant between 1926 and 1941, but since then they have moved m opposite directions The relative decline in the number of women aged 15-49 was largely brought about by emigration Its effect on the number of married women of childbeanng age m relation to population size was, however, more than offset by the change in marriage habits
TABLE 11
PROPORTION OF MARRIED WOMEN IN 12 EUROPEAN COUNTRIES ABOUT 1961
Country Hungary Czechoslovakia Poland Norway Denmark France Netherlands Sweden
Germany (Fed. Rep) Spam
Portugal Ireland
Year 1960 1961 1960 1960 1960 1962 1960 1960 1961 1960 1960 1961
Married women 15-49 as % of All women 15-49
70 8 70 7 69 7 66 6 65 0 64 8 64 0 63 9 62 9 57 4 57 0 50 4
All females 34 2 32 1 32 0 30 1 30 6 27 8 29 6 30 1 29 5 28 6 27 8 21 5
Ireland is clearly seen to be at the bottom of the "league table", which-ever of the two series is used Thus the proportion of married women is likely to rise further in Ireland if the country comes closer to the demo-graphic patterns which prevail m Europe
4. NATALITY AND REPRODUCTION
Simple measures of natality are the crude birth rate, the general fertility rate and the legitimate fertility rate, I e. the ratio of births to total popu-lation or to number of women aged 15-49, or the ratio of legitimate births to married women 15-49. Since these measures take the age and civil status distribution of the population into account to a different extent each tells a somewhat different story, as seen from Table 12
TABLE 12
MEASURES OF NATALITY 1925-27 TO 1960-62 (3-YEAR AVERAGES)
Period 1925-27 1935-37 1940^2 1945-47 1950-52 1955-57 1960-62
Total births per 1,000 Total
Population 20 6 19 4 20 0 23 0 21 5 21 1 21 6
Women aged 15-49
86 2 83 1 83 0 96 5 95 1 95 5 101 6
Legitimate births per 1,000 married women 15-49
Until the end of the last war the three indicators moved very closely together, showing a decline m births in the 1930s followed by a recovery During the first ten years following the end of the war, the number of births per married woman of childbearmg age declined by about one-tenth, this was partly offset by higher nuptiahty, but unfavourable changes in age structure helped to reduce the crude birth rate More recently, the decline m legitimate fertility appears to have been arrested and the rising proportion of married women made up for the changes in age distribution, thus keeping the crude birth rate stable
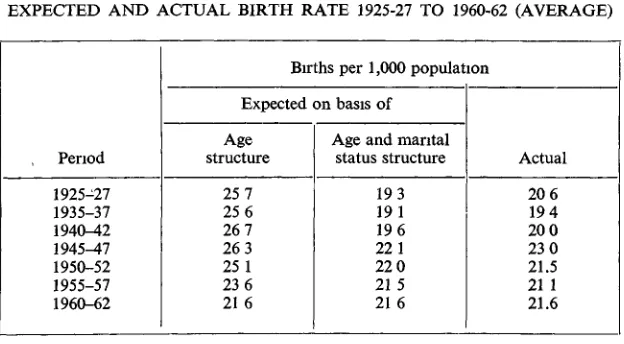
[image:12.415.58.370.345.517.2]For a more rigorous analysis, it is necessary to take into account changes in age distribution withm the group of women aged 15-49 For 1960-62 the age distribution of mothers at birth is available and with its help it is possible to derive two sets of expected birth rates per thousand population for previous dates One set of figures is based on the assumption that the 1960-62 age-specific fertility rates for each 5-year age group had applied to women of each age group at the previous Census dates. The second set of expected figures uses the 1960-62 legitimate and illegitimate age-specific fertility rates, applied to married and to single or widowed women of each age group separately. In Table 13 the results are compared with the actual birth rate
TABLE 13
EXPECTED AND ACTUAL BIRTH RATE 1925-27 TO 1960-62 (AVERAGE)
, Period 1925-27 1935-37 1940^42 1945^7 1950-52 1955-57 1960-62
Births per 1,000 population Expected on basis of
Age structure
25 7 25 6 26 7 26 3 25 1 23 6 21 6
Age and marital status structure
19 3 19 1 19 6 22 1 22 0 21 5 21 6
Actual 20 6 19 4 20 0 23 0 21.5 21 1 21.6
The actual course of the crude birth rate diverges sharply from that of the rate expected on the basis of age structure alone but very little from that expected on account of age and civil status distribution This may be interpreted as saying that the birth rate is largely explained by the number of married women in the various childbeanng age groups, changes in number of children born per married woman of a given age group appear to be minor in character.
TABLE 14
EXPECTED 0AND ACTUAL BIRTH RATE BY AREA 1960-62
(3-YEAR AVERAGE)
Area Carlow
Dublin County Borough Dun Laoghaire Dublin Co (remainder) Kildare
Kilkenny Laois Longford Louth Meath Offaly Westmeath Wexford Wicklow Clare
Cork County Borough Cork County Kerry
Limerick County Borough Limerick County Tipperary North Riding Tipperary South Riding Waterford Co Borough Waterford County Galway
Leitnm Mayo Roscommon Shgo Cavan Donegal Monaghan
IRELAND
Births per 1,000 population Expected
Age structure
20 07 26 99 25 47 27 11 20 42 19 19 19 87 18 25 23 49 19 96 19.95 20 46 19 91 21 89 17.79 24 83 20 18 18 10 24 82 18 56 19 98 19 31 25 22 19 57 18 50 16 43 16 90 17 39 18 75 18 01 18 39 19 35 2157
on basis of Age and marital
status structure 2171 26 16 24.12 30 63 23 96 19 21 20 65 17 95 23 51 2139 2196 2128 21 13 23 61 17 03 24 58 19 98 17 46 26 46 17.59 19.87 20 40 26 59 20 20 17 55 15 44 16 47 16 97 18 02 17 67 17 39 18 95 21 57
Actual 24 91 2419 22.84 27 10 24 40 19 49 2192 20 05 23 64 2171 23 46 23 11 2125 22 40 18 46 25 33 20 12 18 30 26 14 19 70 2196 22 61 24 66 19 85 19 50 17 00 17 27 16 28 18 63 18 62 17 10 20 32 21 57
192
actual birth rate is 900 for the first set and .945 for the second set of expected figures Thus local variations in age and conjugal condition distribution account to a large extent for regional differences in the birth rate
On the other hand, if the second set of expected birth rates is compared with the difference between actual and expected birth rates, an inverse association becomes evident, the rank correlation coefficient is —454 Thus local variations in fertility of married women go some way towards counteracting variations m nuptiahty As a result, regional birth rate differentials are somewhat smaller than suggested by age distribution and proportion of married women in each area
Seen by themselves, birth rates have little meaning, and it is of interest to look at the level of births in relation to the number required for re-placement of the population For this purpose, gross and net reproduction rates may be computed The gross reproduction rate indicates the number of baby girls to whom, together with a corresponding number of baby boys, the average woman will give birth to in the course of her life at existing age-specific fertility rates and in the absence of any deaths suffered by females before the age of 50 The net reproduction rate measures the same thing but with due allowance made for deaths occurring to potential mothers both in childhood and in the childbeanng period
Neither the gross nor the net reproduction rate is a perfect measure of reproduction and m particular they suffer from the defect that the effects of marital fertility and nuptiahty are confounded Nevertheless they provide useful measures, a figure of 1 indicating exact population replace-ment and a difference from 1 multiplied by 100 the theoretical percentage increase or decrease within a generation
For the average of the years 1960-62 the gross reproduction rate works out as 1 877 and the net reproduction rate as 1 794, thus indicating, with certain qualifications, a natural population increase of 80% withm a generation The figures are considerably above the 1955-57 level which is estimated as 1 675 for the gross and 1 580 for the net reproduction rate They are also considerably higher than corresponding figures for England and Wales which for 1960-62 are 1.347 and 1 305 respectively
A striking contrast with England and Wales is also found for the timing of the births If a group of women are followed throughout their lifetime it is estimated that the median age at birth, i.e the age at which they will have given birth to half of the children whom they will ultimately have borne, is 26 83 for England and Wales, but 31 00 for Ireland. Thus English women will have completed far more than half but Irish women less than half their family formation by the time they reach the age of 30
TABLE 15
MEASURES OF REPRODUCTION BY AREA 1960-62
Area
Dublin County Borough Dublin County and Louth Remainder of Leinster
Cork, Limerick and Waterford County Boroughs
Cork, Limerick and Waterford Counties
Remainder of Munster Connaught
Ulster (3 Counties)
IRELAND
Reproduction rate Gross
1 683 1 865 2 072 1 925 1 825 1997 1 889 1 843 1 877
Net
1 609 1784 1981 1 841 1744 1908 1 805 1761 1794
Median age of mother at birth
(years) 30 71 30 43 30 71 30 45 31 33 3120 3172 3146 3100
The highest reproduction rates occur in Leinster outside Dublin and Louth and in Munster outside Cork, Limerick and Waterford, in these areas a high nuptiahty is combined with a fairly high fertility In Dublin city, on the other hand, where the proportion of married women is only moderately high and fertility well below the national average, the repro-duction rates are at a somewhat lower level than for the country as a whole The median age of mother at birth is somewhat lower in Leinster and m the Munster boroughs than in the rest of the country
On the whole, however, what is striking is not that differences between areas exist but that they are so small So far, the large mter-area variations in character of economic activity and degree of economic development which exist have not produced any very considerable variations in family formation and population replacement In view of the contrast with the experience of neighbouring countries, exemplified here by England and Wales, it still makes sense to speak of an Irish pattern of large families
5. LABOUR FORCE AND EMIGRATION
In studying socio-economic population characteristics, long-term trends are less important and short-term movements more important than m a purely demographic analysis The present analysis will, therefore, be confined to the decade 1951-1961, some attention being given to annual changes
being in gainful occupations The unfavourable implications of this high dependency burden have been recently examined by Kaim-Caudle (1964)" Altogether, the labour force thus lost 163,900 members between 1951 and 1961. This number may be split up into five components indicating respectively the effect of changes in total population size, sex composition, age composition, conjugal condition structure of the female population, and changes in work participation rates, I e proportions occupied in various population groups
For this purpose four hypothetical totals of gainfully occupied have been calculated for 1961, based on 1951 work participation rates (a) for the population as a whole, (b) for all males and all females, (c) for males and females of each age group, (d) for males and females of each age group, but separating single, married and widowed women The age groups used are individual ages from 14 to 19 (combined for married and widowed women), the five-year age groups 20-24, 25-29, , 40-44, the ten-year age groups 45-54, 55-64, then 65-69, 70-74, 75 and over From these totals the contribution of each factor to the decline in the labour force is obtained by difference, thus yielding the figures in Table 16
TABLE 16
ANALYSIS OF CHANGES IN NUMBER GAINFULLY OCCUPIED 1951-61
Effect of changes in Total population size
Sex structure Age structure
Conjugal status structure Specific work participation rates
COMBINED
Change in No (thousand)
—61 1 — 7 1 —60 0 —17 4 —18 3 —163 9
The major part of the explanation thus may be said to lie in the popula-tion decline and in the falling representapopula-tion of the working ages in the population The increases in the ratio of women to men and m the propor-tion of married women were further contributory factors, as were also changes in work participation rates
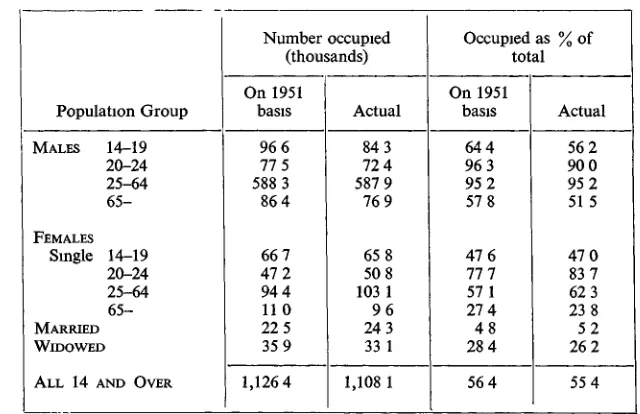
The changes which the work participation rates have undergone are not uniform and do not even all point m the same direction. In Table 17 these changes which by themselves tended to reduce the labour force by
labour force and that of men over 65 who have retired, is higher than previously, the work force is thus reduced by about 27,000 men This is partly offset by higher work participation rates for single women between 20 and 65 which added 12,000 to the labour force. Minor upward changes in work participation rates for married women and downward changes for single women under 20 and over 65 only have a fractional effect
[image:17.416.40.360.235.442.2]TABLE 17
EXPECTED AND ACTUAL WORK PARTICIPATION FOR VARIOUS POPULATION GROUPS 1961
Population Group
MALES 14-19 20-24 25-64 6 5
-FEMALES Single 14-19
20-24 25-64 6 5
-MARRIED WIDOWED
ALL 14 AND OVER
Number occupied (thousands) On 1951
basis 96 6 77 5 588 3 86 4
66 7 47 2 94 4 11 0 22 5 35 9 1,126 4
Actual 84 3 72 4 587 9 76 9
65 8 50 8 103 1 9 6 24 3 33 1 1,108 1
Occupied as % of total On 1951
basis 64 4 96 3 95 2 57 8
47 6 111 57 1 27 4 4 8 28 4 56 4
Actual 56 2 90 0 95 2 5 1 5
47 0 83 7 62 3 23 8 5 2 26 2 55 4
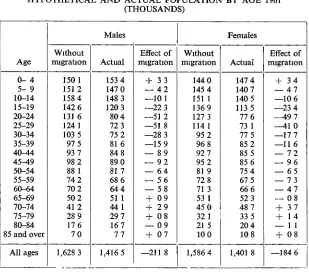
Changes in population size and age distribution, with their reper-cussions on the labour force, may likewise be considered as the joint effect of two factors, one of them being the natural ageing process com-bined with births and deaths, the other one external migration.
TABLE 18
HYPOTHETICAL AND ACTUAL POPULATION BY AGE 1961 (THOUSANDS)
Age
0 - 4 5- 9 10-14 15-19 20-24 25-29 30-34 35-39 40-44 45-49 50-54 55-59 60-64 65-69 70-74 75-79 80-84 85 and over
All ages Without migration 150 1 1512 158 4 142 6 131 6 124 1 103 5 97 5 93 7 98 2 88 1 74 2 70 2 50 2 412 28 9 17 6 70 1,628 3 Males Actual 153 4 147 0 148 3 120 3 80 4 72 3 75 2 81 6 84 8 89 0 817 68 6 64 4 51 1 44 1 29 7 167 77 1,416 5 Effect of migration + 33
— 4 2 —10 1 —22 3 —512 —51 8 —28 3 —15 9 — 89 — 92 — 64 — 56 — 58 + 09 + 29 + 08 — 09 + 07 —211 8 Females Without migration 144 0 145 4 151 1 136 9 127 3 114 1 95 2 96 8 92 7 95 2 8 1 9 72 8 7 1 3 53 1 45 0 32 1 21 5 10 0 1,586 4 Actual 147 4 140 7 140 5 113 5 77 6 73 1 77 5 85 2 85 5 85 6 75 4 67 5 66 6 52 3 48 7 33 5 20 4 10 8 1,401 8 Effect of migration + 34
— 4 7 —10 6 —23 4 —49 7 —41 0 —17 7 —11 6 — 7 2 — 9 6 — 65 — 73 — 4 7 — 0 8
+ 37 + 14
— 1 1
+ 08
—184 6
Thus net migration appears to have reduced the size of the population by about 396,000 during the last decade, males accounting for more than half of the loss The number of young people in their twenties has been most drastically reduced, the loss amounting to more than 40% of all men between 25-29 in the most extreme case, men and women aged 20-29 accounted for almost half of the outward migration All age groups from 5 to 65 share the loss of members in various degrees On the other hand, it appears that on balance some men and women of retiring age have returned to Ireland, there also seems to be a small inward balance in the number of couples with small children
In 1951 the total population of the country was 2,960,600 persons In the absence of migration the number would thus have increased by 253,800 to 3,214,400, m actual fact it fell by 142,300 to 2,818,300. It is also esti-mated that, assuming the additional labour supply arising from demo-graphic causes could have been absorbed in the economy, the labour force would have risen from 1,272,000 by about 96,300 to 1,368,300 instead of declining by 163,900 to 1,108,100, and the overall work participation rate which was 43 0% in 1951 would have merely fallen to 42 6% instead of, as actually happened, falling to 39 3 %
about 409,000 persons This is somewhat higher than the total of 396,000 shown in Table 18 The discrepancy is explained by the fact that emigration tended to reduce the number of deaths occurring in the country by about 13,000, these would have been lost to the country even in the absence of migration
From the recorded natural population increase and the estimates of total population, the estimated migration each year may be deduced, the figures obtained differ from those given for net passenger movement The split-up of change in population size is shown in Table 19, together with changes in the labour force as estimated in "Economic Statistics", these are likewise split up into changes in number at work and in unem-ployment The figures are based on a revised labour force estimate for 1951, and the total for the decade thus differs somewhat from that pre-viously quoted
[image:19.414.49.360.268.469.2]TABLE 19
POPULATION AND LABOUR FORCE CHANGES EACH YEAR APRIL 1951—APRIL 1961 (THOUSANDS)
Year 1951-52 1952-53 1953-54 1954-55 1955-56 1956-57 1957-58 1958-59 1959-60 1960-61 1951-61
Population change
Total — 8 — 4 — 8 —20 —23 —13 —32 — 7 —14 —14
—143
Natural +27 +29 +28 +25 +25 +28 +26 +25 +27 +26 +266
Net migration
—35 —33 —36 —45 —48 —41 —58 —32 —41 —40
—409
Labour force change
Total — 8 —23 — 3 —20 —20 —26 —21 —12 —11 —10
—154
At work —22 —29 — 3 —17 —21 —41 —16 — 8 — 5 — 3 —165
Un-employed
+ 14 + 6
0
^ + 1 + 15
— 5 — 4 — 6 — 7
+ 11
Assuming that the labour force estimates are reasonably accurate, an interesting problem poses itself The change m the labour force may be considered as made up by two components, viz the domestic change and net migration of the labour force, the domestic change being the balance of intake into and withdrawals from the occupied population Is it possible to estimate the two components7
For the period 1951-61 it has previously been estimated that without migration the labour force would have increased by 143,600 persons, working with adjusted 1951 labour force figures, this figure comes to about 150,000 persons. As in fact the labour force declined by 154,000 persons it seems that 304,000 potential workers emigrated
emigration each year Instead, we may assume that the net domestic intake into the labour force is closely related to changes in numbers at work and that migration of workers is closely correlated with total migration The problem then reduces to one of regression analysis
Given three variables xl5 x2 and y, all measured as differences from their
means y is to be split up into two additive components, yx and y2, such
that
y1= B1x1+ s1
The maximum likelihood values for yx and y2 are sought, given a series
of observations for x1? x2 and y Assuming that the errors % and E2 have
equal variances, the solution is Yi=(y+bi b2 x2)/2
b2 x2)/2
where bx and b2 are the partial regression coefficients of y on x± and x2
In this instance xx refers to change in number at work, x2 to net migration
and y to total change in labour force Computation yields b i = 0 4620
b2= 0 3646
thus for the variables x / , x2', y'? yxf and y2' which are not deviations from
means
y1/= 19 0 6 + 0 5 y ' + 0 231 Ox/—0.1823x2'
ya'=—19 0 6 + 0 5y'—0 2310x1'+0 1823x2'
Table 20 shows the result in numerical form. TABLE 20
ANALYSIS OF LABOUR FORCE CHANGE EACH YEAR 1951-1961 (THOUSANDS)
Period 1951-52 1952-53 1953-54 1954-55 1955-56 1956-57 1957-58 1958-59 1959-60 1960-61 1951-61
Total — 8 —23 — 3 —20 —20 —26 —21 —12 —11 —10 —154
Net domestic intake
+ 16 + 7 +23 + 13 + 13 + 4 + 16 + 17 +20 +21 + 150
The results lean heavily on data and assumptions which may not be perfectly accurate Nevertheless the tentative conclusion is that not only does migration of workers vary from year to year, largely in response to the employment situation, but there are also considerable fluctuations in the extent to which marginal workers such as married women and old people enter or leave the labour force
6. OUTLOOK
The period analysed here ends in 1961 In one sense this is an advantage since that year may well mark a turning point m Irish population history For the first time since 1948 the total population began to increase again after 1961, and it is possible that the total of 2,818,000 persons in 1961 will be the lowest one recorded for time to come The population size is estimated to have risen in each of the three years following April 1961, the total rise up to April 1964 amounting to 31,000 persons
During this three-year period average annual births amounted to 61,700 which is the same as the average over the decade 1951-60, but the number of deaths, about 33,000 per annum, was well below the level of the pre-ceding decade With a natural increase of 86,000 persons, the total net emigration which is implied in the population estimates amounts to 55,000 for the three years, or an annual emigration rate somewhat above 18,000
In the light of what has been shown for the immediate past, it is possible to arrive at a reasonable assessment of what is likely to happen during the whole of the current decade and thus at a population projection for 1971 Assumptions for births, deaths and migration are of course required
For male and female births it will simply be assumed that the annual average between 1961 and 1971 is the same as that observed in the first three years of the decade Whilst the current high marriage rates and low emigration make for an increased number of births, this may be offset by some reduction in marital fertility For a long-term projection alter-native fertility assumptions and their implications would need to be carefully considered, but with a forecast for 1971 the level of births is not of outstanding importance
Mortality is likely to fall further, but the reduction is assumed to be only half of what it was between 1951 and 1961 The precise assumption made is that the survivor ratios between five-year age groups deduced from the 1960-62 life table apply to the five years 1961-1966, but that m the following quinquennium higher survivor ratios operate Denoting these ratios for 1951, 1961 and 1971 by r51, r61 and r71 respectively the assumption
is that
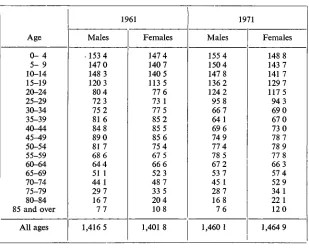
of this migrating population is assumed to be the same as that estimated for 1951-1961 and given in Table 18 This may not be quite realistic, as some of the age groups recently depleted by emigration may be less likely to furnish substantial numbers for emigration than others which are more intact, but it is difficult to see how a better hypothesis could be devised Table 21 gives the result of the calculations
TABLE 21
POPULATION 1961 AND PROJECTED POPULATION 1971 BY SEX AND AGE (THOUSANDS)
Age
0- 4 5- 9 10-14 15-19 20-24 25-29 30-34 35-39 40-44 45-49 50-54 55-59 60-64 65-69 70-74 75-79 80-84 85 and over
All ages
Males . 153 4 147 0 148 3 120 3 80 4 72 3 75 2 81 6 84 8 89 0 8 1 7 68 6 64 4 51 1 44 1 29 7 167
7 7
1,416 5 1961
Females 147 4 140 7 140 5 1135 77 6 73 1 77 5 85 2 85 5 85 6 75 4 67 5 66 6 52 3 48 7 33 5 20 4 10 8 1,401 8
Males 155 4 150 4 147 8 136 2 124 2 95 8 66 7 64 1 69 6 74 9 77 4 78 5 67 2 53 7 45 1 28 7 16 8 7 6
1,460 1 1971
Females
148 8 143 7 141 7 129 7 1175 94 3 69 0 67 0 73 0 78 7 78 9 77 8 66 3 57 4 52 9 34 1 22 1 12 0 1,464 9
Whilst too much reliance should not be put upon the figures for in-dividual age groups, the broad implications of the assumptions made are clear Total population size may be expected to grow by more than 100,000 m the current decade, to reach a total of over 2,900,000 by 1971 and thus to return to the 1955 level
The excess of men over women in the population which has been of long standing should be wiped out by 1971 There should be a surplus of women over men in each age group over 30 and in the population as a whole
At 1961 work participation rates for each sex and age group, the total labour force may be expected to rise from 1,108,000 to about 1,175,000, of whom 849,000 are men and 326,000 worren The gainfully occupied proportion of the total population should then'nse from 39 3 % to 40 2 % It is also of interest to note that the greater part of the net inflow into the labour force should be supplied by women
Whilst a study of the kind that has been made here answers some questions, it is realised that it poses new ones which cannot be answered in the present framework For a full study of population changes, an approach not only from the statistical angle but also from the viewpoint of the historian, the sociologist, the medical statistician and above all the economist is called for In Ireland the influence of economic factors has left its mark upon population in the form of a protracted decline in size and an unbalanced age structure Current prospects are towards a modi-fication of these tendencies The more distant future may bring further developments but also further problems in the field of population, and there is much scope for further studies which will throw light upon these questions
REFERENCES
Commission on Emigration and Other Population Problems (1954), Reports, Dublin
Geary, R C (1935-36), "The Future Population of Saorstat Eireann and Some Observations on Population Statistics", / SSI SI, 89th session, pp 15-30
Geary, R C (1940-41), "Irish Population Prospects considered from the Viewpoint of Reproduction Rates",/ S S IS 1,94th session, pp 1-28. Honohan, W A (1960), "The Population of Ireland", Journal of the Institute of Actuaries, vol 86, pp 30-68
Kaim-Caudle, P R (1964), Social Security in Ireland and Western Europe, E R I Paper No 20, Dublin
Political and Economic Planning (1955), World Population and Resources, London Allen and Unwm
DISCUSSION
Mr. Honohan, proposing a vote of thanks to Professor Leser, said the Society was fortunate to be the recipient of such a paper from a dis-tinguished Research Professor of the Economic Research Institute who has thrown himself wholeheartedly into the affairs of this country since coming to it a few years ago The Institute had recently embarked upon studies in the field of Irish demography and it is to be hoped and expected that much useful work will emerge.
1954 There is of course a steady stream of publications from the Central Statistics Office, but it is valuable to have from time to time an "outside" appraisal of trends and a general stocktaking
There is no doubt that many are bemused at the virtually unchanging broader features of Irish demography—a virtually unchanging total population, heavy emigration, low marriage rates, high fertility within marriage and a high proportion of never-marneds—and there is some lsk that one may feel that things are likely always to remain so It is also true that the high emigration rate, itself difficult to measure directly, inhibits certain lines of research in depth, as many demographic features tend to be swept away by this very unpredictable and in a way somewhat extraneous factor in demography The study of Irish demography indeed often becomes the study of Irish emigration which in turn becomes the study of Irish economics Indeed, one may compare the very title of the "Commission on Emigration and other Population Problems" with the title of the British "Royal Commission on Population" Does this special character of our demographic position, however, not present a special challenge in providing virgin ground for serious research and perhaps the evolution of new techniques ?
Professor Leser tells us that there are some indications that the tradi-tional population characteristics are at least being modified As regards mortality, the expectations of life at birth are still increasing although the increase has been slowing down. The female expectation at birth is 71 9, being greater by 3 8 years than 68 1 for males, these figures having in-creased by 10 7 and 14 0 respectively in the period of 35 years between 1926 and 1961 These expectations are among the highest in Europe for men and well up to the average for women, it may be added that the male rate is substantially greater than that for either the United States (66 5) or the U S.S R (64 4) An interesting point is that the difference between the male and female rates in this country is among the lowest recorded The fact that this advantage of the female over the male is so widespread is curious and deserving of closer study than appears to have been given to it, especially as it is on the increase
Professor Leser expresses the view that the Irish population seems geared to a higher rate of national population increase than before, but the international comparisons given in Table 11 show that the "take-off" is not yet imminent as we are firmly at the bottom of the list whether we look at the proportions which married women aged 15-49 bear to all women of those ages or to women of all ages It is however true that the decline in legitimate fertility which became evident some years ago (and which was commented upon by the Emigration Commission) seems to have been averted, and our high reproduction rates have since increased. They remain well above those for England and Wales
emphasis here is on the effect which trends in the gainfully occupied sections of the population are likely to have on the future of production, bedevilled as this subject will necessarily be by disturbances arising from emigration More study of this kind will be needed also m regard to the problems of regional development and the availability of manpower. Forecasting on a regional basis is increasingly desirable, not only in regard to those gainfully occupied but in regard to regional population structures generally.
What I have found most revealing is that in the short period of 10 years from 1951 to 1961 no fewer than 304,000 potential workers emigrated and that the "working population" (those aged 15-64) fell by no less than 164,000, a figure which outstrips by a long-distance the corresponding figures m any such period since 1926 This brings into sharp relief the fact that the percentage of retired persons (those over 65) to the working population has increased substantially, it is now 19 4% as compared with 17 7 % in 1951 If the number of persons under 15 (and these have increased steadily since 1936) are added to the "pensioner dependants" the total dependency ratio goes up from 65% m 1951 to 73% in 1961. In other words, every four persons of "working age" are in effect required to support three other persons as well as themselves It seems scarcely necessary to add that this, m fact, is an understatement in as much as those of working age include not only many ill and disabled persons (and unemployed) but non-gainfully-occupied categories such as housewives.
With regard to the problem of ageing, two distinct problems are often confused, namely, the ageing of the individual (increasing longevity) and the ageing of the population structure These may be measured respectively, e g by the increase in the proportion of young people surviving to old age and by the increase in the proportion of elderly people in the popula-tion The expectapopula-tions of life and the survivorship ratios help us to form some impression of increasing longevity We have seen that the expecta-tions of life at birth have increased, but we have no direct information, in this paper at least, as to how the expectations of life at older ages are going In my paper to this Society dated 13th May 1960 entitled "Providing for Old Age through Private Channels" I pointed out that contrary to general belief the expectations of life at age 65 had m fact decreased rather than increased since 1926, so that while people are reaching what may be considered pension ages m larger numbers, and generally speaking m a healthier and fitter condition, they are not enjoying their pensions for any greater length of time It would be interesting to know what the 1961 figures are, if they are available Judging from the survivorship ratios between ages 65 and 80 at least, some improvement would appear to have been made, although the males are tending again to slip back
only in the higher age groups In the 10-year age group 65-75 there was in fact a fall from 207,664 m 1951 to 196,278 m 1961 and this 10-year span covers almost two-thirds of those over age 65 An important point m this connection is that there has been a very serious decline m the numbers at working-ages so that one must not necessarily conclude that the total number of old persons will be constantly increasing. The reverse may well, m fact, be the case at any rate m the longer future (e g after about 20 years or so), because it is m the age-group 15 to 45 that the greater part of the fall has taken place
The importance of demographic studies cannot be overrated. They form an essential foundation for all forms of policy-making and planning in this era Professor Leser is to be congratulated on his paper
Arnold Marsh, seconding, said he was glad Dr Leser had not carried his prognostics beyond 1971, because demographers had so often gone completely wrong in making predictions of future trends on the basis of recent ones People's attitudes and habits of thought changed for no known reason Dr Leser's figures indicated a likely growth of 3.8 % m the population from 1961 to 1971 At that rate about twenty decades would be needed to double the figure, or get it back to what it had been a century earlier His impression was that this doubling would come a good deal sooner. The declining sector had been the agricultural one, but the decline there had been so heavy that it could not continue at the same rate Industry and services were advancing and with the steadying in the drop in agriculture the overall rise should accelerate
In any case a change was taking place in the direction of normality In the nineteenth century the only normal part of the country had been the north-east in an age of industrialisation it had been industrialised With a normal state of mind the same should have happened all along the east and south coasts, but there had been a psychological obstacle Lack of confidence inhibited enterprise This had changed strikingly in the last forty years, and there was no reason to think the new condition would not continue, but it would be unwise to pretend to any certainty
INSURED EMPLOYEES AGED 15 AND OVER, MID-JUNE 1961
MIS
o £
ORDERS
1. Agriculture, Forestry, Fishing 2 Food, Drink and Tobacco 3 Mining and Quarrying 4 Chemicals and Allied Industries 5 Metal Manufacture
6 Engineering and Electric Goods 7 Shipbuilding and Marine Engineering
(l) Shipbuilding (n) Marine Engineering 8. Vehicles
9 Metal Goods not elsewhere classified 10 Textiles
11 Leather Leather Goods and Fur 12 Clothing and Footwear
13 Bricks, Pottery, Glass, Cement 14 Timber, Furniture, etc 15 Paper Printing and Publishing 16 Other Manufacturing Industries 17 Construction
18. Gas, Electricity and Water 19 Transport and Communications 20 Distributive Trades
21 Insurance Banking Finance 22 Professional and Scientific Services 23 Miscellaneous Services
24. Public Administration—Defence Not classified by Industry or Service
TOTAL COLERAINE M 928 560 216 44 112 28 464 24 40 92 36 1555 201 656 888 60 410 728 533 16 7591 F 44 193 20 12 4 248 308 12 44 5 137 748 32 1125 1005 176 4113 T 972 753 236 44 124 32 712 332 40 104 36 1599 206 793 1636 92 1535 1733 709 16 11704 LONDONDERRY M 796 772 92 628 24 1072 164 24 12 172 28 580 96 72 72 4 2180 252 1623 2156 180 749 845 1914 8 15315 F 20 230 52 92 44 16 6360 12 48 12 61 5 124 1164 76 1416 927 367 11026 T 816 1002 92 680 24 1164 164 24 12 216 44 6940 96 84 120 16 3041 257 1747 3320 256 2165 1772 2281 8 26341 LlMAVADY M 761 32 28 48 8 16 4 4 1114 49 91 128 20 78 124 490 F 12 12 8 4 676 12 2 6 116 95 200 33 T 773 44 28 48 8 8 4 692 4 4 1126 57 97 244 20 173 324 523
2995 1176 4171 M 1393 248 112 4 24 4 8 8 544 20 4 776 91 186 522 56 117 164 267 4 4540 F 67 172 844 348 24 2 19 333 4 260 456 27 2491 T 1460 420 112 4 24 4 8 8 1388 368 4 800 93 205 855 60 377 621 291 1 7031
U
I!
3 2 CDP h-t t"V C/3
12
H
p CS *
CD ^
IS
P -S -» 3 Y O\ ON p3o g*
00
g*
OCCUPATIONAL ANALYSIS OF REGISTERED WHOLLY UNEMPLOYED ADULTS (INCLUDING NON-CLAIMANTS) AGED 18 AND OVER AT 10th DECEMBER, 1962
OCCUPATIONS (Abbreviated)
Farm Workers, Fishermen, etc Electrical and Electronic Workers Engineering and Allied Trades Workers Wood Workers
Leather Workers Textile Workers Clothing, etc , Workers Food, Drink and Tobacco Construction
Painters and Decorators
Drivers, etc , of Stationary Engines, Cranes, etc Transport and Communication
Warehousemen, Packers, etc Chemical Workers
Shop Assistants
Services, Sports and Recreation General Labourer (Heavy) General Labourer (Light) Factory Hands Other Labourers TOTALS COLERAINE M 91 9 30 11 2 1 14 14 27 5 67 4 27 27 40 171 105 47 F 4 18 59 17 4 5 31 54 123 6 T 95 9 30 11 2 19 59 31 14 27 5 71 9 58 81 163 171 105 6 47
696 344 1040
LONDONDERRY M 130 18 290 43 14 4 12 23 70 27 16 136 34 47 60 114 687 280 41 254 F 1 1 1 3 258 3 6 8 69 65 102 T 131 18 291 43 15 7 270 26 70 27 16 142 42 116 125 216 687 280 41 254
2343 551 2894
LlMAVAD M 122 3 11 9 1 2 14 1 12 3 2 5 6 67 71 55 F 2 71 1 4 1 8 21 36 Y T 124 3 11 9 1 71 3 14 1 16 4 10 26 42 67 71 55
359 154 543
STRABANE M 301 23 16 2 17 2 10 19 9 7 40 10 17 19 22 164 75 17 154 F 1 1 47 46 5 11 15 25 61 11 T 302 23 16 3 64 48 15 19 9 7 40 21 32 44 83 164 75 28 154
931 267 1198
O ON
UNEMPLOYMENT AND ACTIVITY RATES BY REGIONS—MID-JUNE 1961
REGION
Northern Wales Scotland Northern Ireland U K
Londonderry Coleraine Limavady Strabane
LABOUR FORCE
ODDS 1,302
570
2,155 483
22,973
26 3 11 7 4 2
7 0
ACTIVITY MALES 75 0 69 6 76 6 63 0 77 1
79 1 (71 6) 75 3 (67 6) 66 5 (51 4) 67 7 (45 5)
RATES % FEMALES 32 4 27 5 37 6 33 6 38 4
49 7 (48 7) 37 6 (35 2) 23 6 (22 8) 28 4 (27 3)
UNEMPLOYMENT % AVERAGE
Male
18 8 7 8
14 0 22 8
2 5
2 6
3 2
7 5
1 6
Female
8 9
4 4
6 1
11 5
UNEMPLOYMENT NUMBERS
Male
2,888 592 419 1,037
Female
984 179 72 286
to o
[image:29.685.202.617.67.329.2]UNEMPLOYMENT — ACCORDING TO AGE AND DURATION Ministry of Labour Areas Coleraine, Londonderry, Limavady and Strabane
10th December, 1962
MALES
Spell
Over 5 yrs 4-5 yrs 3-4 yrs 2-3 yrs 1-2 yrs 39 wks -1 yr 26-39 wks 13-26 wks 8-13 wks 6-8 wks 4-6 wks 2-4 wks
U p to and inci 2 wks
T O T A L S
under 18 0 0 0 0 1 4 13 29 42 45 32 52 55 273 18-24 0 2 2 22 58 48 46 125 141 128 116 134 138 960 25-34 7 3 19 23 80 50 49 122 125 127 100 117 135 957 35-44 22 2 18 44 106 59 69 82 118 95 98 118 121 952 45-54 36 19 35 57 103 62 49 79 87 78 87 73 115 880 55-64 66 20 53 62 102 56 41 70 69 77 67 58 83 824 65 + 0 0 0 1 2 0 0 3 3 2 0 0 3 14 Total 131 46 127 209 452 279 267 510 585 552 500 552 650 4860
F E M A L E S
LEVELS OF EMPLOYMENT
YOUNG PERSONS ENTERING EMPLOYMENT 1961 AND 1962 —NORTHERN IRELAND
1.
2.
3
4
5.
Level of Employment entered
Apprenticeship to skilled occupation
Employment leading to recognised professional qualifications Chemical employment not included
above
Employment with training for one year or more
Entering other employment
TOTAL
1961 1962 1961 1962 1961 1962 1961 1962 1961 1962 1961 1962
BOYS
15
930 1,242 9 7 334 248
170
5,640 5,381 6,913 7,048
16
314 419 29 30 134 114 not avc
4 678 557 1,155 1,124
Age of Entry
17
85 103 32 30 121 121 ulable
2 219 186 457 442
Total
1,329 1,784 70 67 589 483
176
6,537 6,124 8,525 8,614
into Employment GIRLS
15
127 170 14 18 1,005 871
185
5,618 5,571 6,764 6,815
16
35 27 34 21 625 585 not 10 594 438 1,288 1,081
avc 17
25 23 80 86 401 451 ul able
2 280 218 786 780
Total
187 220 128 123 2,031 1,907
197 6,452 6,227 8,838 8,676
to
[image:31.687.109.605.106.336.2]