Classification of Histopathological Images based on
Modified Clump Splitting Approach
Anand Raj Ulle
Department of Information science and Engineering Sri Jayachamarajendra College of Engineering, Mysuru, India
T. N. Nagabhushan
Department of Information science and Engineering Sri Jayachamarajendra College of Engineering, Mysuru, India
Nandini Manoli
Department of Pathology
JSS Medical College and Hospital, Mysuru, India
ABSTRACT
The current research work aims to propose an improved clump splitting approach to classify breast cancer lesion based on extract-ing shape features. Identifyextract-ing the number of benign and malignant nuclei in a given area of histopathological tissue is very important for the automated grading system. This process becomes difficult due to irregular size and shape of the nuclei leading to clump for-mation. Therefore, a major challenge lies in accurately separating these nuclei for further processing. Towards this end, there has been a well-focused research on accurate identification and extraction of nuclei based on concavity analysis. From exhaustive experimenta-tions, it is observed that concavity based approaches pose several limitations: like identifying the concave point pair and selecting the valid split lines. Further, It is also observed from the litera-ture that either region or edge based segmentation is the most com-monly used method for segmenting nuclei. Experimental analysis showed that under or over-segmentation is the common problem with region-based methods. Since poor, unclear edges, noise and other artefacts are inevitable in histopathological images, the edge based method does not perform well. Therefore in this research work, a combination of both edge and region-based nuclei seg-mentation is proposed. The performance measure of the proposed method is evaluated on a dataset consisting of 1820 histopatholog-ical images. Further, in comparison with the existing methods, the proposed method showed the improved accuracy of 86%. Also, it is clearly seen from the ROC curve that the non-linear SVM out-performs other classifying methods.
Keywords
Histopathological Images, clumps, Shape features, nuclei extrac-tion, Digital Pathology
1. INTRODUCTION
One of the recent articles on cancer statistics shows an alarming rate of increase in cancer cases during 2015 [1]. There has been a rough estimate of 1.6 million new cancer cases diagnosed and 0.6 million cancer deaths in the US, alone. In India, Breast cancer (BC) is one of the major cause of morbidity and mortality in women. Recent trends in [2] have shown a significant rise in the number
of BC patients, in India, especially in the younger age group. The statistics show that nearly a quarter of all cancers cases in females are BC. Therefore an early diagnosis and accurate cancer grading help oncologists schedule a suitable treatment plan.
Traditionally, pathologists grade tissue slides by observing char-acteristic changes at both the cellular and tissue level. Further, important biomarkers are identified that best discriminate benign from the malignant samples. Recently, several research groups [3, 4, 5, 6] have identified gene expression biomarkers for grading tissue samples. However, there are some issues related to gene expression test: tests are not universally available for clinical prac-tice, and the tests are expensive and time-consuming. Therefore, traditional H&E stained tissue slide is still a gold standard for the pathologists to accurately grade tissue samples. Unfortunately, H&E stained tissue sample presents inter and intraobserver vari-ability. Ref [7] suggest several factors that affect the pathologist while grading. The important amongst them are the degree of overlap among cells, poor contrast, and other artefacts like blood, and mucus. Authors in their research work [8], identified staining error that induces inter-observer variability. Also, they showed that the variability agreement depends on the staining duration, stain concentration, thickness of the tissue specimen, and staining done on the same tissue specimen on different days in a week. Authors in their research work [9] showed that the inter-observer variability also depends on the experience of the pathologists.
2. MAJOR CHALLENGES IN NUCLEI SEGMENTATION
[image:2.595.55.291.247.288.2]Identifying the number of cells in a given area of the histopatholog-ical image is a standard process for the automated grading system. An excellent review [16] of histopathological image analysis sug-gests that nuclear segmentation poses a great challenge even though several attempts have been made to solve it. Fig 1 clearly shows the complexities present in the histopathological images. One of the major challenges lies in the appearance of the nucleus. Poor or missing edges are inevitable due to variability in the concentra-tion of staining dyes across several pathological laboratories lead-ing to clump formation. Since clumps are inevitable due to irreg-ularly shaped cells there exist a great challenge in splitting these clumps. There exist a dedicated research work on clump splitting from histopathological images by various groups. Most important and noted works are listed below.
Fig. 1: Complexities in nuclei segmentation
3. RELATED WORKS ON NUCLEI
SEGMENTATION AND CLUMP SPLITTING
A marker-controlled watershed [11] based nuclei segmentation was proposed for breast cancer tissue images. Colour deconvolution and morphological operators were used as pre-processing steps to remove irrelevant objects from the tissue images. Kumar et al [17] proposed a rule-based clump splitting. In their research work, deep concave points were identified as the candidate for clump splitting and a concave-concave alignment features were identified for finding the correct split lines. Xiangzhi Bai et al [18] proposed clump splitting based on concave points and fitting ellipse. Wang et al [19] proposed clump splitting on binarized imaged based on polygon approximation and concavities. Samma et al [20] proposed clump splitting based on concave points. In their research work, concave points are identified by combining boundary and skeleton information. Wang and Hao [21] proposed clump splitting based on polygon approximation and medial axis transform. A Delaunays triangulation based overlapping nuclei was proposed by Quan Wen et al [22]. Authors in their research work, identify concave points based on maximum positive curvature and a Delaunay triangulation method is used to construct the potential split lines. Further, a rule-based edge selection algorithm is developed to prune redundant edges.
It has been observed by experimental analysis on several histopathological images that the method proposed by Quan Wen et al [22] performs well in case of the simple split but fails when there exist multiple splits in the clump. Qufa Zhong et al [23] proposed a segmentation algorithm for splitting slender particles. In their research work, a circular mask with orientation is used to identify concave points. Further, concaveness is measured as the ratio of arc length inside the object to the perimeter of the circular mask. Hui Wang et al [24] proposed clump splitting via bottleneck detection. In their research work, bottlenecks (concave points) are
identified by defining the cost function. Farhan et al [25] proposed a novel clump splitting algorithm based on image intensity.
LaTorre et al [26] proposed a two-step binarization and clump splitting based on identifying concave points. In their proposed work, the authors have applied the watershed transform and intensity gradient to identify the clumped cells. Further, concave vertex graph is constructed to perform clump splitting. Zhe JI et al [27] have proposed concavity based clump splitting on titanium alloy. Recently, Wesley et al [28] proposed an automatic system for counting cells. In their research work, automatic counting of cells is achieved using Kmeans as initial segmentation followed by ellipse fitting. W. Xiong et al [29] proposed clump splitting and automatic quantification of the area in the blood smears. Oliver Schmitt et al [30] proposed a morphological multi-scale decomposition of clustered cells. An n-fold morphological open-ing and closopen-ing operators are used to split the clumps. A new approach towards clump separation was proposed by M. Veta et al [11]. Foreground markers were extracted based on radial symmetry transform. Finally, the watershed algorithm was used for separating the clumped nuclei from the tissue image. In another method proposed by Sonal Kothari et al [31,?] proposed concave points identification by ellipse fitting. Eric Cosatto et al [32] proposed a classification of nuclei based on the analysis of stain color after segmenting nuclei from the histopathological images. Hui Kong et al [33] proposed clump splitting based on the identification of concave points. Hussain Fatakdawala et al [34] proposed Expectation Maximization approach towards identifying and extracting the nuclei. In their work, authors have proposed a heuristic method for splitting the overlapping objects. Makkapati et al [35] proposed a geometric based clump splitting. Hong Song et al [36] proposed concave based clump splitting. In this work, authors have identified more common concave points and an improved the watershed algorithm to identify less likely concave points. Recently, Dhanya et al [37] proposed a newer approach towards clump splitting of blood cells for detecting malaria parasites. In this work, authors identify the concave points based on estimating the major axis of the ellipse and navigating in both directions until any notable changes are found at the boundary.
There exist several studies on clump splitting for nuclei segmen-tation. On carefully observing the works published by several re-searchers we found that concavity based methods were widely used for splitting the clumps. Further, there exists a great challenge in identifying accurate concave points. Also, mapping the concave-concave point pair also presents several issues. From the literature, it is observed that clump slitting was performed on the binary image overlooking the colour information present in the histopathological image. In this research work, a mixture of Gaussian model is pro-posed to estimate the co-variation of stain colour present at each clump. An improved edge selection algorithm is proposed based on identifying the centroid of each clumped object.
4. MATERIALS AND METHODS
centroid detection method is proposed based on the ultimate mor-phological erosion. Valid edges are selected based on the number of centroids identified by the proposed method in each clump. The complete workflow of the proposed method is shown in Fig 2.
Fig. 2: The proposed method for nuclei segmentation and classification
4.1 Pre processing
Pre-processing is an important step to extract nuclei (ROI) from the histopathological images. Since the quality of image acquisi-tion and staining procedure affects the segmentaacquisi-tion accuracy pre-processing the histopathological images before segmentation be-comes inevitable.
Pre-processing from a histopathological image (HP image) in-volves the following steps as shown in Fig 3. The RGB colour model presents interdependencies between the colour channels. Therefore we convert RGB to CIELab to remove such dependen-cies. From our observations on several HP images, we found that Luminance (L channel) preserves more characteristic details of the cellular regions more than other channels. Noise present in the HP
Fig. 3: Pre-processing steps
images greatly influences the accuracy of extracting ROI. There ex-ist several filtering techniques to remove noise but in this research work, Weiner filtering method is used since it filters noise preserv-ing the edges. Poor contrast and illumination are common prob-lems in most of the HP images. Therefore, histopathological im-ages are subjected to contrast enhancement before further process-ing. LaTorre et al [26] have used contrast enhancement technique (CLAHE) to remove the noise. On experimentation, we found that CLAHE performed uniform contrast enhancement over the entire image. But in the current research work, contrast enhancement is done only if the contract for the particular pixel is less than some predefined threshold. In this work, the mean contrast of all the HP images is used as a threshold. Fig 4 shows the comparisons of con-trast enhancement techniques.
[image:3.595.53.295.130.211.2](a) The proposed approach (b) CLAHE technique
Fig. 4: Comparison of Contrast Enhancement techniques
4.2 Extract Region of Interest (Nuclei)
Extracting ROI from HP images is an important and challeng-ing task for high-level image interpretation and analysis. There exist several segmentation algorithms in the literature to extract ROI each having its own merits and demerits. Image segmenta-tion methods can be grouped into three types: thresholding based approach, edge-based, and cluster-based. Generally, the watershed approach is the most popular segmentation method for extracting ROI. On several experimentations, it is observed that the water-shed algorithm works well when the blob (ROI) is simple and non-clumped. Since clumping of cells in HP image is inevitable Water-shed method resulted in poor extraction of ROI (Fig 5). The accu-racy of Watershed method depends on identifying accurate seed points called foreground markers. Due to noise and staining er-rors Watershed approach finds false regional maxima as foreground markers thus resulting in over-segmentation.
Fig. 5: Extraction of Region of interest (ROI) using Watershed method
[image:3.595.315.557.387.492.2] [image:3.595.51.291.462.497.2]computed that maps the membership values to spatial coordinates. (Using equation 1)
Jm= n X
i=1
c X
j=1
(µi,j)m||xi−cj||2 (1)
Where m is any real number greater than 1, xi is the ith d-dimensional data,µi,j is the the membership function and Fuzzy centroidcj
µi,j=
1
c X
k=1
||xi−cj|| ||xi−ck||
2
m−1
cj= n X
i=1
um i,j.xi n X
i=1
umi,j
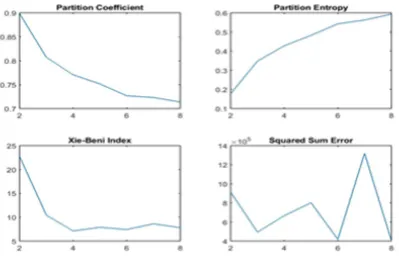
[image:4.595.317.556.166.230.2]It is well known that the accuracy of the clustering depends on the prior knowledge of the number of clusters. Further, It is difficult to assess the accurate number of clusters present in Histopathological images. Recently, Yang, Shuling, et al [39] have introduced differ-ent cluster validity index. In this research work, we have used the partition coefficient, partition entropy, Xie-Beni index, and the sum of squared error are used for validating the number of clusters. Fig 6 shows the cluster validity measure. It can be clearly seen in Fig 6 that, entropy, and the sum of squared error increase beyond cluster index k=3. Hence, in the current research work, we have fixed the cluster to 3.
Fig. 6: Cluster validity measure
4.3 Post processing
The binary image after segmentation is still far from quantifying the features of a single cell due to clumping of cells. The binarized image contains small objects (noise) that must be removed before further processing. Due to improper staining, the binarized image at certain regions will be hollow. Thus creating multiple false re-gions. Recently, Hui Kong et al [40] proposed a method to differ-entiate the clumped cells and non-clumped cells. Given a connected region,Riauthors find the radial symmetry centre ri and geomet-rical centre gi. The connected region is identified as clump if the ratio ofri /giis greater than some threshold. On several exper-imentations, it is found that fixing a threshold was very difficult. In this research work, an improved approach towards pruning un-wanted regions from the histopathological image is proposed. Lets consider S={o1, o2, , on}to be a set of N connected objects. Let A
={a1, a2, , an}be the set of areas of each object of interest. The
connected component (cc) is deemed to be clump if the area of cc is greater than the average area of all the connected components in an image. Histopathological images after segmentation have rough boundaries. These irregularities make it difficult to identify valid concave points. In this research work, a simple low pass filter is used to smooth the boundary points. Fig 8 shows the process of binarization and contour smoothing done on sample histopatholog-ical image.
Fig. 7: Extract Region of Interest from HP image: The first image shows the original image, the next image shows the binarized version of the original image, and the last image shows the contours identified after morphological operations and boundary smoothing
4.4 Concavity Analysis
Detection of the valid concave points is a main step for separating the overlapping nuclei. In this direction there are many research articles on identifying concave points. On experimentations with several histopathological images with varying shapes, it is found that curvature-based method identifies shallow concave points with many invalid (convex) points. Further, convex hull based approach identifies only deep concave points missing out shallow concave points. In this research work, an ensemble of curvature and convex hull approach is proposed to extract all the concave points
Extracting Shallow concave points
The shallow concave points are extracted based on the curvature along the boundaries of the connected regions. The theoretically suggestions made by Attneave tells that information gain is mostly found in the regions of high curvature. Further, Jacob Feldman [41] proposed signed curvature extending Attneaves claim. The exper-imental analysis shows that for any connected region with closed boundary, negative curvature signifies concave regions and positive curvature signifies convex regions. There several methods to iden-tify the curvature of a 2D curve. In this research work, we have applied the second order derivative as proposed by Hermann et al [42] to estimate the curvature of a point on a curve.
k=2(αp1β2−α2β1)
α2 1+β21
(2)
α1=
Xi−Xprev
2 α2=
Xi+Xprev
2 −Xnex
β1=
Yi−Yprev
2 β2=
Yi+Yprev
2 −Ynex
[image:4.595.75.275.350.484.2]Extracting Deep concave points
The extraction of deep concave points are done based on the convex hull approach. Equation 3 is used to identify and extract concave regions. In this approach we find the maximum distance from the convex Hull to the concave regions to extract deep concave points.
Bdistk=
kBiy−(Sh
i ∗ Bix)−B(S h i ∗A)k p
1 + (Sh i)2
(3)
where,Bdistk represents distance map from all thekboundary point, (Bix, Biy) represent the co-ordinates of boundary points, (A,B) represents the convex hull points andsh
i represent the slope of convex hull.
4.5 Edge Pruning
In this step we identify the valid concave pair. Since the accurate number of splits present in each of the clumps are not known in ad-vance it becomes difficult to identify the accurate concave pair. In this research work, concave point paring is done based on the De-launay Triangulation method proposed by Quan et al [22]. There exist redundant edges after Delaunays Triangulation. Redundant edges can be grouped into two classes. Edges outside the clumps, and edges that do not make a pair. We propose an algorithm to identify and prune redundant edges.
Remove edges that are outside the clump
Let suppose that P ={p1, p2, p3, , pk}be the set of k edge points
and V ={v1, v2, vj}be the set of vertex points from Delaunays
Triangulation. An edgePi is retained if every interpolated point between(vi, vj)lies within the scope of the boundary.
Remove edges that do not make a pair
The concavity depth and saliency feature proposed by Kumar et al [17] finds concave pairs. But there exist a possibility of grouping concave points on the same region. In this research work, an im-proved edge pruning algorithm is proposed. A complete algorithm for edge pruning is shown below.
4.6 Clump splitting and edge selection based on Gaussian mixture model
After edges are pruned, valid edges are selected based on estimat-ing the parameters of the Gaussian mixture model from each of the potential edge. In this work, a circular mask of fixed radius r=10 is used to extract the colour pixels from every potential edge. Covari-ance and mean are estimated using equation 5. From an exhaustive empirical study on several clumps from different histopathological images, valid split edges are selected based on the lowest eigenval-ues of the covariance matrix. Since there exists no apriori knowl-edge on the number of clumps present in each of the occluded ob-ject of interest, we propose a novel method of edge selection based on centroid detection. In this research work, ultimate morphologi-cal erosion is applied to each blob. Ultimate erosion of a blob b is expressed as the union of regional maxima of the distance function of b. The ultimate erosion finds the set of possible centroids for each clumped objects. In this research work, valid centroids are identi-fied by applying the k-means algorithm. The proposed method for centroid detection is shown in algorithm 5.
N(x|µ,Σ) = 1
2π|Σ|1/2exp−
1 2(x−µ)
TΣ−1(x−µ)
(4)
5. DATASET & NUCLEI FEATURES
To illustrate the methodology of nuclei segmentation and classifica-tion, histopathological images from the Pathological Anatomy and Cytopathology, Parana, Brazil [43] is considered. This dataset con-sists of 9,109 microscopic images of breast tumour tissue collected from 82 patients using different magnifying factors (40X, 100X, 200X, and 400X). The dataset presents 2,480 benign and 5,429 ma-lignant images with 700 X 460 resolution, RGB with 8-bit depth in each channel. Since the ground truth data was not available, a small subset containing 1820 samples with 400x magnification out of which 588 were benign and rest were malignant are considered.
Table 1. : Shape Features
Type Features
cellular features Area, Major axis, Minoraxis, Eccentricity Orientation Equi-diameter, Solidity, Extent Shape Concave Area Perimeter, Filled Area Concave point ratio.
from the segmented image. The classifier uses these features in pre-dicting the class for an unknown sample. Irshad et al [16] presented a survey on different feature extraction methods available for the histopathological image. Recently, Rekha et al and Cherath et al [44, 45] proposed a modified scoring system for breast cancer grad-ing. Authors in their research works have suggested six morpholog-ical features like cellular pleomorphism, cellular arrangement, my-oepithelial cells, anisonucleosis, nucleoli, and chromatin clumping. Pathologists observe these feature for grading the tissue sample. In this direction, the current research focuses on identifying morpho-logical changes at the cellular level. Therefore, a total of 48 features are extracted from the ROI by considering the mean, standard devi-ation, minimum and maximum for all the shape features shown in Table 1.
6. RESULTS & DISCUSSION
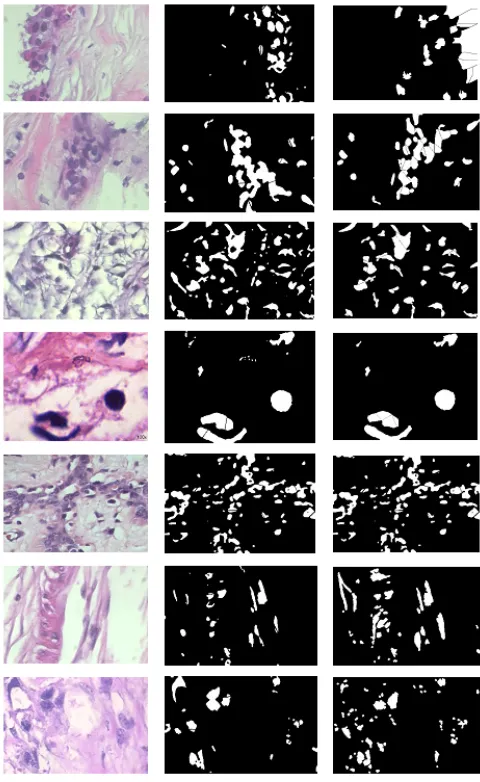
In this section, an exhaustive experimental analysis of segmentation and classification of histopathological images is presented. Fig 8 shows the qualitative results of segmentation and clump splitting while Table 2 shows the classification accuracy.
Qualitative analysis of classifiers
The performance of the classifier is measured based on shape fea-tures extracted after nuclei segmentation. In this research, 1820 histopathological images were considered for segmenting nuclei. In comparison with the existing method [46], the method presented in this research work performed well in accurately delineating all the nuclei. The results show improvements in the F-measure, from 0.65 to 0.70. From the table 2, it is evident that the performance of SVM is better compared to other classifiers. Fig 9. Shows the ROC curve of the three classifiers. It can be clearly seen that the false positive rate (FPR) for SVM is better compared to another classifier. Also, the SVM model outperformed all others methods in classifying benign and malignant nucleus.
7. CONCLUSION
In this research work, an improved clump splitting approach to clas-sifying breast cancer nuclei based on extracting nuclear features is presented. Identifying the morphological changes in the nuclei, given the histopathological images is of greatest importance in pre-dicting the progression of a breast tumour and hence, the present study assumes importance. Segmentation of breast cancer nuclei poses a great challenge owing to irregular size, shape, and non-homogenous pixel intensity present in the nuclei. Even though there exists a well-studied research on nuclei segmentation by several re-searchers yet, the existing methods lack in accurately extracting the nuclei. From the qualitative and quantitative analysis, it is clear that the proposed clump splitting method performed well on sep-arating several nontrivial clumps present in the histopathological images. To validate the performance of nuclei segmentation, shape features are extracted from the segmented nuclei for classification. The proposed method was evaluated on 1820 images. In compar-ison to the existing method, the proposed method showed an
im-Fig. 8: Qualitative nuclei segmentation: The first column shows the original image, the next column shows the binarized version of the original image based on the improved clump splitting, and the last column shows the nuclei segmentation, and clump splitting based on hardy et al [46] and Farhan et al [25]
proved accuracy of 86% in classifying benign vs malignant tissue images. Also, the proposed method showed an improved F-measure of 0.7 in comparison to 0.65 for the existing method.
Disclosures
[image:6.595.55.300.87.129.2]Table 2. : Quantitative performance measure of different classifiers
Method Classifier Acc Sen Spe F-m MCC AUC
SVM 0.825 0.825 0.825 0.638 0.85 0.825
hardy et al [46] KNN 0.795 0.788 0.802 0.580 0.795 0.795
and Farhan et al [25] TB 0.831 0.833 0.826 0.650 0.833 0.831
SVM 0.863 0.895 0.823 0.708 0.858 0.859
Proposed Method KNN 0.842 0.816 0.876 0.674 0.845 0.846
TB 0.850 0.879 0.815 0.683 0.846 0.847
Acc- accuracy, Sen- sensitivity, Spe- specificity, F-m- F-measure, AUC-Area under the curve, MCC-Matthews correlation coefficient, SVM - Sup-port vector machine, KNN - K nearest neighbour, TB - Tree Bagger
Fig. 9: Receiver operating characteristics (ROC) for different classifiers on the test data
8. REFERENCES
[1] “Breast cancer statistics,” https://www.breastcancer.org/ symptoms/understand bc/statistics.
[2] “Breast cancer statistics:indian scenario,” http://cancerindia. org.in/statistics/.
[3] D. M. Hyams, E. Schuur, J. Angel Aristizabal, J. E. Bar-gallo Rocha, C. Cabello, R. Elizalde, L. Garc´ıa-Est´evez, H. L. Gomez, A. Katz, and A. Nu˜nez De Pierro, “Selecting post-operative adjuvant systemic therapy for early stage breast cancer: a critical assessment of commercially available gene expression assays,” Journal of surgical oncology, vol. 115, no. 6, pp. 647–662, 2017.
[4] M. Kwa, A. Makris, and F. J. Esteva, “Clinical utility of gene-expression signatures in early stage breast cancer,”Nature Re-views Clinical Oncology, vol. 14, no. 10, p. 595, 2017. [5] J. A. Sinnott, S. Peisch, S. Tyekucheva, T. A. Gerke, R. T.
Lis, J. R. Rider, M. Fiorentino, M. J. Stampfer, L. A. Mucci,
M. Lodaet al., “Prognostic utility of a new mrna expression signature of gleason score,” Clinical Cancer Research, pp. clincanres–1245, 2016.
[6] T. Gutschner, G. Richtig, M. Haemmerle, and M. Pichler, “From biomarkers to therapeutic targetsthe promises and per-ils of long non-coding rnas in cancer,”Cancer and Metastasis Reviews, vol. 37, no. 1, pp. 83–105, 2018.
[7] J. L. Connolly, S. J. Schnitt, H. H. Wang, J. A. Longtine, A. Dvorak, and H. F. Dvorak, “Role of the surgical pathol-ogist in the diagnosis and management of the cancer patient,” 2003.
[8] M.-C. Rousselet, S. Michalak, F. Dupr´e, A. Crou´e, P. Be-dossa, J.-P. Saint-Andr´e, and P. Cal`es, “Sources of variability in histological scoring of chronic viral hepatitis,”Hepatology, vol. 41, no. 2, pp. 257–264, 2005.
[9] T. A. Ozkan, A. T. Eruyar, O. O. Cebeci, O. Memik, L. Oz-can, and I. Kuskonmaz, “Interobserver variability in gleason histological grading of prostate cancer,”Scandinavian journal of urology, vol. 50, no. 6, pp. 420–424, 2016.
[10] A. Madabhushi, “Digital pathology image analysis: opportu-nities and challenges,” 2009.
[11] M. Veta, J. P. Pluim, P. J. Van Diest, and M. A. Viergever, “Breast cancer histopathology image analysis: A review,” IEEE Transactions on Biomedical Engineering, vol. 61, no. 5, pp. 1400–1411, 2014.
[12] A. Laurinavicius, A. Laurinaviciene, D. Dasevicius, N. Elie, B. Plancoulaine, C. Bor, and P. Herlin, “Digital image analy-sis in pathology: benefits and obligation,”Analytical cellular pathology, vol. 35, no. 2, pp. 75–78, 2012.
[13] M. N. Gurcan, L. Boucheron, A. Can, A. Madabhushi, N. Ra-jpoot, and B. Yener, “Histopathological image analysis: A re-view,”IEEE reviews in biomedical engineering, vol. 2, p. 147, 2009.
[14] A. Madabhushi and G. Lee, “Image analysis and machine learning in digital pathology: Challenges and opportunities,” 2016.
[15] G. St˚alhammar, N. F. Martinez, M. Lippert, N. P. Tobin, I. Mølholm, L. Kis, G. Rosin, M. Rantalainen, L. Pedersen, J. Berghet al., “Digital image analysis outperforms manual biomarker assessment in breast cancer,”Modern Pathology, vol. 29, no. 4, p. 318, 2016.
[16] H. Irshad, A. Veillard, L. Roux, and D. Racoceanu, “Methods for nuclei detection, segmentation, and classification in digital histopathology: a reviewcurrent status and future potential,” IEEE reviews in biomedical engineering, vol. 7, pp. 97–114, 2014.
[17] S. Kumar, S. H. Ong, S. Ranganath, T. C. Ong, and F. T. Chew, “A rule-based approach for robust clump splitting,”Pattern Recognition, vol. 39, no. 6, pp. 1088–1098, 2006.
[18] X. Bai, C. Sun, and F. Zhou, “Splitting touching cells based on concave points and ellipse fitting,” Pattern recognition, vol. 42, no. 11, pp. 2434–2446, 2009.
[19] W. X. Wang, “Binary image segmentation of aggregates based on polygonal approximation and classification of concavi-ties,” Pattern Recognition, vol. 31, no. 10, pp. 1503–1524, 1998.
[image:7.595.64.252.266.426.2]on Computer Graphics, Imaging and Visualization. IEEE, 2010, pp. 113–117.
[21] W. Wang and H. Song, “Cell cluster image segmentation on form analysis,” inNatural Computation, 2007. ICNC 2007. Third International Conference on, vol. 4. IEEE, 2007, pp. 833–836.
[22] Q. Wen, H. Chang, and B. Parvin, “A delaunay triangulation approach for segmenting clumps of nuclei,” in Biomedical Imaging: From Nano to Macro, 2009. ISBI’09. IEEE Inter-national Symposium on. IEEE, 2009, pp. 9–12.
[23] Q. Zhong, P. Zhou, Q. Yao, and K. Mao, “A novel segmenta-tion algorithm for clustered slender-particles,”Computers and Electronics in Agriculture, vol. 69, no. 2, pp. 118–127, 2009. [24] H. Wang, H. Zhang, and N. Ray, “Clump splitting via
bottle-neck detection,” inImage Processing (ICIP), 2011 18th IEEE International Conference on. IEEE, 2011, pp. 61–64. [25] M. Farhan, O. Yli-Harja, and A. Niemist¨o, “A novel method
for splitting clumps of convex objects incorporating image in-tensity and using rectangular window-based concavity point-pair search,”Pattern Recognition, vol. 46, no. 3, pp. 741–751, 2013.
[26] A. LaTorre, L. Alonso-Nanclares, S. Muelas, J. Pe˜na, and J. DeFelipe, “Segmentation of neuronal nuclei based on clump splitting and a two-step binarization of images,”Expert Systems with Applications, vol. 40, no. 16, pp. 6521–6530, 2013.
[27] H. Li, Z. Ji, and H. Yang, “Quantitative characterization of lamellar and equiaxed alpha phases of (α+β) titanium alloy using a robust approach for touching features splitting,” Ma-terials Characterization, vol. 76, pp. 6–20, 2013.
[28] W. N. Gonc¸alves and O. M. Bruno, “Automatic system for counting cells with elliptical shape,” arXiv preprint arXiv:1201.3109, 2012.
[29] W. Xiong, S.-H. Ong, J.-H. Lim, K. W. Foong, J. Liu, D. Racoceanu, A. G. Chong, and K. S. Tan, “Automatic area classification in peripheral blood smears,”IEEE Transactions on Biomedical Engineering, vol. 57, no. 8, pp. 1982–1990, 2010.
[30] O. Schmitt and M. Hasse, “Morphological multiscale decom-position of connected regions with emphasis on cell clusters,” Computer Vision and Image Understanding, vol. 113, no. 2, pp. 188–201, 2009.
[31] S. Kothari, Q. Chaudry, and M. D. Wang, “Automated cell counting and cluster segmentation using concavity detection and ellipse fitting techniques,” inBiomedical Imaging: From Nano to Macro, 2009. ISBI’09. IEEE International Sympo-sium on. IEEE, 2009, pp. 795–798.
[32] E. Cosatto, M. Miller, H. P. Graf, and J. S. Meyer, “Grading nuclear pleomorphism on histological micrographs,” in Pat-tern Recognition, 2008. ICPR 2008. 19th InPat-ternational Con-ference on. IEEE, 2008, pp. 1–4.
[33] H. Kong, M. Gurcan, and K. Belkacem-Boussaid, “Partition-ing histopathological images: an integrated framework for su-pervised color-texture segmentation and cell splitting,”IEEE transactions on medical imaging, vol. 30, no. 9, pp. 1661– 1677, 2011.
[34] H. Fatakdawala, J. Xu, A. Basavanhally, G. Bhanot, S. Gane-san, M. Feldman, J. E. Tomaszewski, and A. Madabhushi, “Expectation–maximization-driven geodesic active contour
with overlap resolution (emagacor): Application to lympho-cyte segmentation on breast cancer histopathology,” IEEE Transactions on Biomedical Engineering, vol. 57, no. 7, pp. 1676–1689, 2010.
[35] V. V. Makkapati and S. K. Naik, “Clump splitting based on detection of dominant points from contours,” inAutomation Science and Engineering, 2009. CASE 2009. IEEE Interna-tional Conference on. IEEE, 2009, pp. 197–201.
[36] H. Song, Q. Zhao, and Y. Liu, “Splitting touching cells based on concave-point and improved watershed algorithms,” Fron-tiers of Computer Science, vol. 8, no. 1, pp. 156–162, 2014. [37] D. Bibin and P. Punitha, “Stained blood cell detection and
clumped cell segmentation useful for malaria parasite diag-nosis,” in Multimedia processing, communication and com-puting applications. Springer, 2013, pp. 195–207.
[38] S. K. Adhikari, J. K. Sing, D. K. Basu, and M. Nasipuri, “A spatial fuzzy c-means algorithm with application to mri image segmentation,” inAdvances in Pattern Recognition (ICAPR), 2015 Eighth International Conference on. IEEE, 2015, pp. 1–6.
[39] S. Yang, K. Li, Z. Liang, W. Li, and Y. Xue, “A novel cluster validity index for fuzzy c-means algorithm,”Soft Computing, vol. 22, no. 6, pp. 1921–1931, 2018.
[40] H. Kong, M. Gurcan, and K. Belkacem-Boussaid, “Split-ting touching-cell clusters on histopathological images,” in Biomedical Imaging: From Nano to Macro, 2011 IEEE In-ternational Symposium on. IEEE, 2011, pp. 208–211. [41] J. Feldman and M. Singh, “Information along contours and
object boundaries.”Psychological review, vol. 112, no. 1, p. 243, 2005.
[42] S. Hermann and R. Klette, “A comparative study on 2d cur-vature estimators,” inComputing: Theory and Applications, 2007. ICCTA’07. International Conference on. IEEE, 2007, pp. 584–589.
[43] F. A. Spanhol, L. S. Oliveira, C. Petitjean, and L. Heutte, “A dataset for breast cancer histopathological image classifica-tion,”IEEE Transactions on Biomedical Engineering, vol. 63, no. 7, pp. 1455–1462, 2016.
[44] T. Rekha, N. Nandini, and M. Dhar, “Expansion of masood’s cytologic index for breast carcinoma and its validity,”Journal of Cytology/Indian Academy of Cytologists, vol. 30, no. 4, p. 233, 2013.
[45] S. K. Cherath and S. M. Chithrabhanu, “Evaluation of ma-soods and modified mama-soods scoring systems in the cytolog-ical diagnosis of palpable breast lump aspirates,”Journal of clinical and diagnostic research: JCDR, vol. 11, no. 4, p. EC06, 2017.