Page 1 of 28 Significant Cognitive Delay among 3-4 Year Old Children in Low and Middle Income Countries: Prevalence Estimates and Potential Impact of Preventative Interventions
Eric Emerson, Centre for Disability Research and Policy, Faculty of Health Sciences, University of Sydney, NSW1825, Australia (corresponding author email [email protected], please only use email as I split my time between the UK and Australia)
Amber Savage, Family and Disability Studies Initiative, Faculty of Rehabilitation Medicine, University of Alberta, Edmonton, TG6 2G4, Canada
Gwynnyth Llewellyn, Centre for Disability Research and Policy, Faculty of Health Sciences, University of Sydney, NSW1825, Australia
Word count (including references): 4,732 Word count (excluding references): 3,762
Page 2 of 28 Abstract
Background: We sought to: (1) estimate the prevalence of significant cognitive delay (a marked delay in the development of general cognitive functioning) among nationally representative samples of young children in middle and low income countries; (2) estimate the total number of children under five years of age with significant cognitive delay living in low and middle income countries; and (3) estimate the potential impact of five preventative interventions.
Methods: Secondary analysis of data collected in Rounds 4 and 5 of UNICEF’s Multiple Cluster Indicators Surveys in 51 countries involving 163,293 3-4 year old children. Adjusted population attributable fractions were used to estimate the potential impact of five interventions based on Sustainable Development Goals (SDGs).
Results: The prevalence of significant cognitive delay in 3-4 year old children in middle and low income countries was 10.1% (95% CI 9.7%-10.4%). Prevalence was strongly inversely related to country economic wealth. The estimated total number of children under 5 with significant
cognitive delay living in low and middle income countries was just under 55 million. This number could be reduced by over 60% if three separate SDGs were achieved; every mother had secondary level education, every household had access to improved water and sanitation, every child had an acceptable level of home stimulation.
Page 3 of 28 Key Messages:
Little is known about the prevalence or predictors of significant cognitive delay in low and middle income countries.
Our estimates suggest that just under 55 million children living in low and middle income countries under age 5 have significant cognitive delay
This disproportionate loss of developmental potential could be meaningfully reduced by implementing specific preventative interventions in early childhood
Prevalence of significant cognitive delay in children under 5 could be reduced by over 60% if: 1) every mother had secondary level education, 2) every household had access to improved water and sanitation, and 3) every child had an acceptable level of home stimulation.
Page 4 of 28 Introduction
It has been estimated that 250 million children under the age of 5 years who live in low or middle-income countries do not reach their developmental potential.(1) Loss of developmental potential largely arises from exposure to a range of nutritional, environmental and social risks that are typically associated with growing up in poverty.(1-8) A proportion of this group of young children are likely to have delayed a developmentaldelay in relation to their general cognitive functioning as evidenced by delays in expressive and receptive language, literacy, numeracy and independence.(9) Marked delays in general cognitive functioning demonstrated at an early age may that persist across middle childhood and consequently may be associated with either intellectual disability (ID: typically defined as an IQ below 70) or borderline intellectual functioning (BIF: typically defined as an IQ between 70 and 84 inclusive).(10, 11) Indeed, most approaches to screening for children in low or middle-income countries who may be at risk of ID
are based on either the direct or indirect assessment of language, literacy, numeracy and
independent functioning in young children.(12)Both ID and BIF of these conditions are associated with poor educational attainment, unemployment, social exclusion, poor health and reduced life expectancy.(10, 11, 13-15)
Little is known about the prevalence or predictors of significant cognitive delay or intellectual disabilityIDor BIF in low and middle income countries. For example, a recent WHO
commissioned review of the prevalence of intellectual disabilities identified 26 studies that used regional, provincial or national sampling frames.(16) All but one of these studies were
Page 5 of 28 status. However, the available evidence on between-country variation in the risk of exposure to established determinants of significant cognitive delayIDor BIF (e.g., household poverty, undernutrition) suggests that the incidence of ID significant cognitive delay is likely to be much higher in lower income countries.(1, 5, 7) Although methodologically limited, the sparse
available evidence on prevalence supports this hypothesis.(16)
The aims of the present paper were: (1) to estimate the prevalence of significant cognitive delay among nationally representative samples of young children in a range of middle and low income countries; (2) to use these estimates to provide global estimates of the prevalence of significant cognitive delay; and (3) to estimate for low and middle income countries the potential impact of a range of preventative interventions specified in the Sustainable Development Goals
(SDGs).(17)
Method
We undertook secondary analysis of data collected in Rounds 4 and 5 of UNICEF’s Multiple Cluster Indicators Surveys (MICS).(18) The MICS programme seeks to generate robust country-specific data on the wellbeing of young children and mothers. It has formed the basis of
measuring progress toward the achievement of the Millennium Development Goals and the Sustainable Development Goals.(18) Following approval by UNICEF, MICS data were
downloaded from http://mics.unicef.org/. At the end of the download period (January 2018), data from nationally representative surveys were available for 55 countries.
MICS contains a number of questionnaire modules. Data used in the present paper were
Page 6 of 28 http://mics.unicef.org/. Countries used cluster sampling methods to derive samples representative of the national population of mothers and young children.
Identification of children with significant cognitive delay
The child under five module contained the Early Child Development Index (ECDI), a ten item scale based on milestones that children are expected to achieve by ages 3 and 4.(19) The ECDI contains four domains; literacy-numeracy, physical, social emotional, and learning. ECDI data wereas collected on children in the age range 36-59 months. We used all five items from the literacy-numeracy and learning domains to identify children with significant cognitive delay. All items are based on key informant (primarily maternal) report with simple binary (yes/no)
response options.
Literacy-numeracy: Can the child: (1) identify/name at least ten letters of the alphabet; (2) read at least four simple, popular words; (3) name and recognize the symbols of all numbers from 1 to 10?
Learning: Can the child: (4) follow simple directions on how to do something correctly; (5) when given something to do, do it independently?
Previously, McCoy and colleagues used just the two ECDI learning items to identify children with cognitive delay, defining delay in terms of the reported inability to complete either or both items.(9) We adopted a significantly more stringent approach to identifying cognitive delay, defining delay in terms of the reported inability to complete all five items. Our decision to , hence the use of the prefix ‘significant’ to describe the extent of cognitive delay was driven by our concern to highlight the difference between our approach to operationalising cognitive delay
Page 7 of 28 an acceptable degree of internal consistency across the whole sample (alpha=0.66), although there was some marked between country variation (alpha range 0.38-0.77). This variation was unrelated to country economic status (see below). Percentage of missing data on individual ECDI items ranged from 1.5%-1.7%. Complete data to determine sSignificant cognitive delay based on complete data was were available for 96.8% of children. In the majority of these cases in which data were incomplete (2.1% of the total) data wereas missing on only one or two of the ECDI items. As a result, we used linear regression methods to impute missing ECDI data (with present ECDI data as the predictor variables) for all children for whom data was were available on the majority of ECDI items. Significant cognitive delay classification based on the collected and imputed items was available for 98.9% of participants. Four countries were excluded as ECDI items were not collected. Analyses were undertaken on the remaining 51 countries.
Country Economic Status
Given the commonly reported association between child wellbeing and national wealth in low and middle income countries,(20) we used World Bank criteria as of July 2016 to classify countries as upper middle income, lower middle income and low income.(21) These
classifications are based on per capita Gross National Income (pcGNI; expressed as current US$ rates) using the World Bank’s Atlas Method. We downloaded 2015 Atlas Method pcGNI from the World Bank.(22, 23) For one country (the State of Palestine) these data were not available. In this instance pcGNI was estimated from 2011 pcGNI data reported in the 2015 Human
Page 8 of 28 below the country for which pcGNI was not available and estimating pcGNI as the mid-point between the countries immediately above and below in country rankings.
In addition we downloaded country level World Bank GINI Index, a measure of income inequality, for 2015 or, if not available, the most recent year since 2010. These data were available for 39 of the 51 countries. Level of income inequality has been associated with
variations in health and wellbeing, including among children, in higher income countries.(25)
Potential Interventions
We identified five risk factors for cognitive delay in young children about which data wereare available in the MICS and which are related to specific SDG goals: these were 1) relative household poverty, 2) maternal education, 3) access to improved water and improved sanitation, 4) stunting, and 5) child stimulation.
Relative Household Poverty
Relative household poverty is likely to also be associated with variations in children’s health and wellbeing. MICS data includes a wealth index for each household. To construct the wealth index, principal components analysis is performed by using information on the ownership of consumer goods, dwelling characteristics, water and sanitation, and other characteristics that are related to the household’s wealth, to generate weights for each item. Each household is assigned a wealth score based on the assets owned by that household weighted by factors scores. The wealth index is assumed to capture underlying long-term wealth through information on the household
Page 9 of 28 Intervening to change relative household poverty is relevant to SDG 1 (end poverty in all its forms everywhere).(28)
Maternal Education
The highest level of education received by the child’s mother was recorded using
country-specific categories. These data were available for all 51 countries. Data were missing for 0.9% of children. We recoded these data into a binary measure of receipt of secondary or higher level education. Increasing level of maternal education is associated with child wellbeing. Intervention for girls education is relevant to SDG 4.1 (ensure that all girls and boys complete free, equitable and quality primary and secondary education).(28)
Stunting
Child weight and height data was were collected by direct measurement using anthropometric equipment recommended by UNICEF. Following WHO, UNICEF and World Bank procedures, height for age data were transformed into z scores from the median reference population; WHO growth standards.(29-32) These data were available for 43 countries. Data were missing for 0.4% of children in these countries. Stunting (as an indicator of likely undernutrition) was defined as scoring more than two standard deviations below the reference population median score.
Page 10 of 28 Access to Improved Water & Improved Sanitation
Access to improved water was defined as the main source of drinking water being piped, public tap/standpipe, tube well/borehole, protected well, protected spring or rainwater collection (MICS4 indicator 4.1). Access to improved sanitation was defined as sanitation facilities which are not shared and are based on flush to piped sewer system/septic tank/pit(latrine), ventilated improved pit latrine, pit latrine with slab, composting toilet (MICS4 indicator 4.3). These data were available for 43 countries. Data were missing for 0.7% of children in these countries. We recoded these data into a simple binary measure of the household having access to both
improved water and improved sanitation. SDG Goal 6 is ensure availability and sustainable management of water and sanitation for all.(28)
Child Stimulation
Respondents were asked ‘In the past 3 days, did you or any household member over 15 years of ageengage in any of the following activities with (name): (a) read books to or looked at picture books with (name)?; (b) told stories to (name)?; (c) sang songs to (name) or with (name), including lullabies?; (d) took (name) outside the home, compound, yard or enclosure?; (e) played with (name)?; (f) named, counted, or drew things to or with (name)? Support for learning was defined as an adult having engaged in four or more activities to promote learning and school readiness in the past 3 days (MICS4 indicator 6.1).
Page 11 of 28 or objects found outside (such as sticks, rocks, animal shells or leaves)?’. An adequate number of books (MICS4 indicator 6.3) was defined as having three or more children’s books. An adequate number of playthings (MICS4 indicator 6.4) was defined as having two or more playthings. These two items were combined into a single item of having adequate books and having adequate playthings. We defined low child stimulation as the presence of either low support for learning or inadequate books and playthings in the home. These data were available for 49 countries. Data were missing for 1.1% of children in these countries. Level of child stimulation is relevant to SDG 4.2 (ensure that all girls and boys have access to quality early childhood
development, care and pre-primary education).(28)
Approach to Analysis
Page 12 of 28 In the final stage of analysis we applied pooled prevalence ratios for each country income group to current global population estimates of the number of children under five living in upper middle, lower middle and low income countries.(33) We then estimated for each country group the adjusted population attributable fraction (PAF) of significant cognitive delay associated with the five SDG interventions described above. The PAF is commonly considered an estimate of either (1) the proportion of instances of a health condition or impairment causally explained by, or attributable to, the risk factor(s) being considered, or (2) the proportion of instances of a health condition or impairment that could be eliminated from the population if exposure to the risk factor were eliminated (or if exposure was were no longer associated with any increased risk).(34) As such, PAFs can provide estimates of the potential impact of interventions in reducing the prevalence of health conditions or impairments in a given population. Given the potential of confounding between risk factors we used multivariate statistical techniques
(Poisson regression) to estimate the adjusted prevalence rate ratio for significant cognitive delay associated with each risk factor.(35, 36) The statistical modelling was undertaken in Stata v12 using the generalised linear modelling procedures with svyset and syv commands to take account of the clustering of observations by country and within country sampling clusters. Finally, we used the results of the multivariate analysis to estimate for each country the adjusted PAF for each risk factor using the formula (proportion of children exposed)*(adjusted prevalence ratio – 1)/ (adjusted prevalence ratio).(37)
Page 13 of 28 complete ECDI data to determine significant cognitive delay classification and including all enumerated 3-4 year old children; (3) using imputed ECDI data to determine significant cognitive delay classification but including only the first enumerated child for each household. The latter set of analyses were undertaken in order to estimate the potential impact of including multiple children per household on the adjusted prevalence rate ratios (more than one child was enumerated in 14.6% of households). Unless specified all results are based on the first set of data (imputed ECDI data including all enumerated 3-4 year old children).
Results
The total sample included information on 163,293 3-4 year old children (59,137 in 22 upper middle income countries, 53,243 in 18 lower middle income countries and 50,413 in 11 low income countries). Overall, 49.5% of the children were 4 years of age (95%CI 48.9%-50.2%). The percentage of 4 year olds was lower in poorer countries as follows: 52.1% (50.4%-53.7%) in upper middle income countries, 49.4% (48.7%-50.2%) in lower middle income countries and 46.3% (45.7%-46.9%) in low income countries. Overall, 49.7% (49.1%-50.4%) of the children were girls. There was no clear association between gender balance and national income
groupings (girls 50.8% (49.1%-52.5%) in upper middle income countries, 49.0% (48.2%-49.9%) in lower middle income countries and 50.1% (49.5%-50.7%) in low income countries). For detailed age and gender prevalence rates by country, please see Supplementary Table 1.
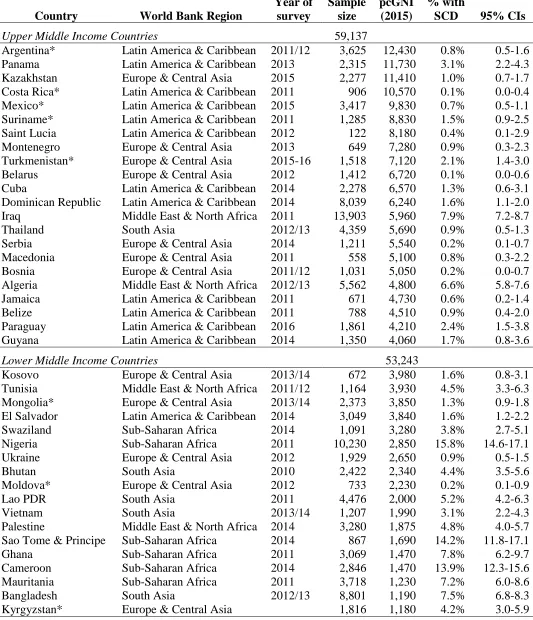
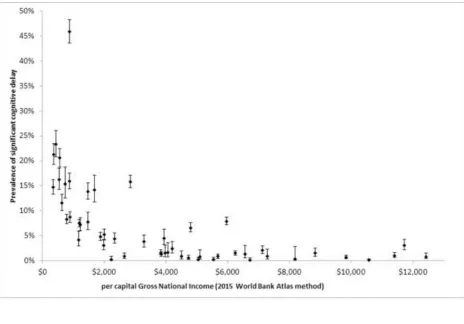
Information on the prevalence of significant cognitive delay is presented in Table 1 and Figure 1.
[insert Table 1]
Page 14 of 28 In analyses pooled across countries, the overall prevalence of significant cognitive delay was 10.1% (95%CI 9.7%-10.4%). Prevalence rates varied by: (1) country economic status, 2.7% (2.5%-3.0%) in upper middle income countries, 10.6% (10.0%-11.2%) in lower middle income countries and 19.1% (18.4%-19.9%) in low income countries; (2) child age, 12.9% (12.4%-13.4%) among three year old children, 7.2% (6.8%-7.6%) among four year old children; and (3) child sex, 10.5% (10.1%-11.0%) among boys, 9.6% (9.1%-10.1%) among girls.
Inspection of the association between country pcGNI and prevalence of significant cognitive delay (Figure 1) suggests that the association is non-linear and the data for Chad wais a marked outlier. The rank-order correlation between country pcGNI and prevalence of significant
cognitive delay was -0.79 (95%CI -0.66 - -0.88) for all countries and -0.78 (95%CI -0.64 - -0.87) if Chad were excluded. Given the association between country economic groupings and child age (see above), we used ordered logistic regression to estimate the strength of association between country pcGNI and prevalence of significant cognitive delay before and after controlling for the percentage of four year old children (before regression coefficient -0.510 (-0.304 - -0.706), after -0.485 (-0.279 - - 0.691). As can be seen, the association between pcGNI and prevalence of significant cognitive delay was only marginally affected when controlling for between-country variation in the percentage of four year old children.
Page 15 of 28 We applied pooled prevalence estimates to the estimated number of children under five living in upper middle, lower middle and low income countries,(33) applying the more conservative estimate for low income countries (by excluding Chad) and rounding results to the nearest 10,000 children. This exercise suggested that 54.4 million children under five living in low and middle income countries have significant cognitive delay. Of these, 4.66 million (9%) live in upper middle income countries, 33.40 million (61%) live in low middle income countries and 16.34 million (30%) live in low income countries.
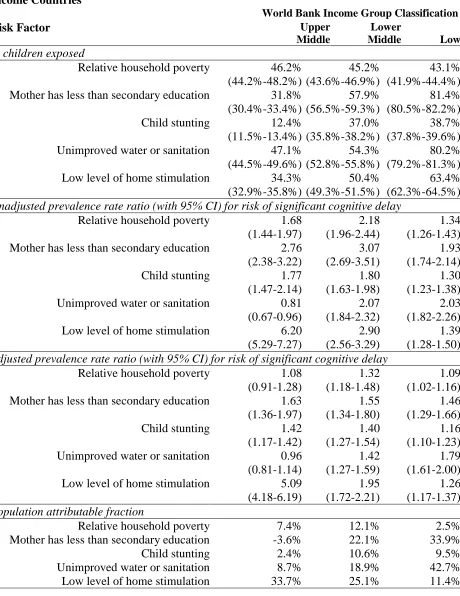
[insert Table 2]
Page 16 of 28 Analyses undertaken on participants in which we had complete ECDI data to determine
significant cognitive delay classification reduced the estimated number of children with significant cognitive delay from 54.4 to 53.9 million and the total potential prevention
percentage from 80% to 79%. Analyses undertaken using imputed ECDI data but including only the first enumerated child for each household reduced the estimated number of children with significant cognitive delay from 54.4 to 52.2 million and increased the total potential prevention percentage from 80% to 82%.
Discussion
Our analysis of 51 nationally representative surveys undertaken in low and middle income countries indicates that: (1) the prevalence of significant cognitive delay in young children is strongly inversely related to country economic wealth; and (2) the estimated global prevalence of significant cognitive delay in children under 5 living in low and middle income countries could be reduced by 80% if five separate goals were achieved, that is, every mother had secondary level education, every household had access to improved water and sanitation, every child had an acceptable level of home stimulation, household poverty were eliminated, and child stunting were eliminated.
Page 17 of 28 interventions in early childhood to reduce the loss of developmental potential among children in low and middle income countries.(1, 4-8, 17)
The primary limitations of our study lie in the unknown validity of our use of the five selected ECDI items as a screening measure of significant cognitive delay and the association between significant cognitive delay and later intellectual disability or borderline intellectual functioning. However, circumstantial evidence of the potential validity of the measure is provided by the strength and direction of association between significant cognitive delay and three well-established correlates of intellectual disability and/or borderline intellectual
functioningsignificant cognitive delay; male gender; household poverty; and evidence of undernutrition.(1, 5, 7, 16) As has been argued previously by McCoy and colleagues, while use of the ECDI and similar instruments should be considered an asset in epidemiological research in low and middle income countries, future research is needed ‘to develop additional, more
detailed, and age-specific measures of early childhood development that can more accurately capture children’s capacity across a wide range of cultures and local contexts’.(9)
Acknowledgements
Page 18 of 28 References
1. Black MM, Walker SP, Fernald LCH, Andersen CT, DiGirolamo AM, Lu C, et al. Early childhood development coming of age: science through the life course. Lancet. 2016;389:77-90. 2. Shonkoff JP, Garner AS. The lifelong effects of early childhood adversity and toxic stress. Pediatrics. 2012;129:e232-46.
3. Grantham-McGregor S, Cheung YB, Cueto S, Glewe P, Richter L, Strupp B, et al. Developmental potential in the first 5 years for children in developing countries. Lancet. 2007;369:60-70.
4. Engle PL, Black MM, Behrman JR, de Mello MC, Gertler PJ, Kapiriri L, et al. Strategies to avoid the loss of developmental potential in more than 200 million children in the developing world. Lancet. 2007;369:229-42.
5. Walker SP, Wachs TD, Gardner JM, Lozoff B, Wasserman GA, Pollitt E, et al. Child development: Risk factors for adverse outcomes in developing countries. Lancet. 2007;369:145-57.
6. Engle PL, Fernald LCH, Alderman H, Behrman J, O’Gara C, Yousafzai A, et al. Strategies for reducing inequalities and improving developmental outcomes for young children in low-income and middle-income countries. Lancet. 2011;378 1339–53.
7. Walker SP, Wachs TD, Grantham-McGregor S, Black MM, Nelson CA, Huff man SL, et al. Inequality in early childhood: risk and protective factors for early child development. Lancet. 2011;378:1325–38.
8. Grantham-McGregor SM, Fernald LCH, Kagawa RM, Walker S. Effects of integrated child development and nutrition interventions on child development and nutritional status. Annals of the New York Acadamy of Sciences. 2014;1308:11-32.
9. McCoy DC, Peet ED, Ezzati M, Danaei G, Black MM, Sudfeld CR, et al. Early Childhood Developmental Status in Low- and Middle-Income Countries: National, Regional, and Global Prevalence Estimates Using Predictive Modelling. PLoS Medicine. 2016;13 (6):e1002034.
10. Peltopuro M, Ahonen T, Kaartinen J, Seppala H, Narhi V. Borderline intellectual functioning: A systematic literature review Intellectual & Developmental Disabilities. 2014;52:419-43.
11. Harris JC. Intellectual Disability: Understanding Its Development, Causes, Evaluation, and Treatment. Oxford: Oxford University Press; 2005.
12. Robertson J, Emerson E, Hatton C, Yasamy MT. The identification of children with, or at significant risk of, intellectual disabilities in low- and middle-income countries: A Review. Journal of Applied Research in Intellectual Disabilities. 2012;25:99-118.
13. Emerson E, Hatton C. Health Inequalities and People with Intellectual Disabilities. Cambridge: Cambridge University Press; 2014.
14. Salvador-Carulla L, García-Gutiérrez JC, Gutiérrez-Colosía MR, Artigas-Pallarès J, Ibánez JC, Pérez JG, et al. Borderline Intellectual Functioning: Consensus and good
practiceguidelines. Revista Psiquiatria y Salud Mental. 2013;6:109-20.
15. World Health Organization. Autism spectrum disorders & other developmental disorders: From raising awareness to building capacity. Geneva: World Health Organization; 2013.
Page 19 of 28 17. Yousafzai A, Lynch P, Gladstone M. Moving beyond prevalence studies: screening and interventions for children with disabilities in low-income and middle-income countries. Archives of disease in childhood. 2014;99:840-48.
18. UNICEF. Monitoring the Situation of Children and Women for 20 Years: The Multiple Indicator Cluster Surveys (MICS) 1995–2015. New York: UNICEF; 2015.
19. UNICEF. The formative years: UNICEF’s work on measuring early childhood development. New York: UNICEF; 2014.
20. World Health Organization. Closing the gap in a generation: Health equity through action on the social determinants of health. Final report of the Commission on the Social Determinants of Health. Geneva: World Health Organization; 2008.
21. World Bank. World Bank Country and Lending Groups.
<https://datahelpdeskworldbankorg/knowledgebase/articles/906519-world-bank-country-and-lending-groups> accessed 08/19/2017. 2017.
22. World Bank. The World Bank Atlas method - detailed methodology.
<https://datahelpdeskworldbankorg/knowledgebase/articles/378832-what-is-the-world-bank-atlas-method> accessed 08/19/2017. 2017.
23. World Bank. GNI per capita, Atlas method (current US$).
<http://dataworldbankorg/indicator/NYGNPPCAPCD?view=chart> accessed 08/19/2017. 2017. 24. United Nations Development Programme. Human Development Report 2015: Work for Human Development. New York: United Nations; 2015.
25. Pickett KE, Wilkinson RG. Child wellbeing and income inequality in rich societies: Ecological cross sectional study. British Medical Journal. 2007;335:1080-6.
26. Rutstein SO. The DHS Wealth Index: Approaches for Rural and Urban Areas. DHS Working Papers No. 60. Calverton, Maryland: Macro International Inc; 2008.
27. Rutstein SO, Johnson K. The DHS Wealth Index: DHS Comparative Reports No. 6. Calverton, Maryland: ORC Macro 2004.
28. United Nations. Transforming our world: the 2030 Agenda for Sustainable Development New York: United Nations; 2015.
29. United Nations Children’s Fund, World Health Organization, The World Bank. Levels and Trends in Child Malnutrition: UNICEF-WHO-The World Bank Joint Child Malnutrition Estimates. Geneva: World Health Organization; 2012.
30. Black RE, Allen LH, Bhutta ZA, Caulfield LE, de Onis M, Ezzati M, et al. Maternal and child undernutrition: global and regional exposures and health consequences. Lancet.
2008;371:243–60.
31. Black RE, Victora CG, Walker SP, Bhutta Z, Christian P, de Onis M, et al. Maternal and child undernutrition and overweight in low-income and middle-income countries. Lancet. 2013;382:427-51.
32. WHO Multicentre Growth Reference Study Group. WHO Child Growth Standards: Length/height-for-age, weight-for-age, weight-for-length, weight-for-height and body mass index-for-age: Methods and development. Geneva: World Health Organization; 2006
33. United Nations Department of Economic and Social Affairs. World Population Prospects: The 2015 Revision. New York: United Nations Department of Economic and Social Affairs; 2015.
34. Levine B. What does the population attributable fraction mean? . Preventing Chronic Disease [serial online] 2007;4:1-5. Available from:
Page 20 of 28 35. Knol MJ, Le Cessie S, Algra A, Vandenbroucke JP, Groenwold RHH. Overestimation of risk ratios by odds ratios in trials and cohort studies: alternatives for logistic regression.
Canadian Medical Association Journal. 2012;184:895-9. DOI:10.1503/cmaj.101715.
36. Zocchetti C, Consonni D, Bertazzi P. Relationship between prevalence rate ratios and odds ratios in crosssectional studies. International Journal of Epidemiology. 1997;26(1):220-3. 37. Rockhill B, Newman B, Weinberg C. Commentary: Use and misuse of population attributable fractions. American Journal of Public Health. 1998;88:15-9.
38. Tomlinson M, Yasamy MT, Emerson E, Officer A, Richler D, Saxena S. Setting research priorities for intellectual disabilities and autism: A priority setting exercise. Journal of
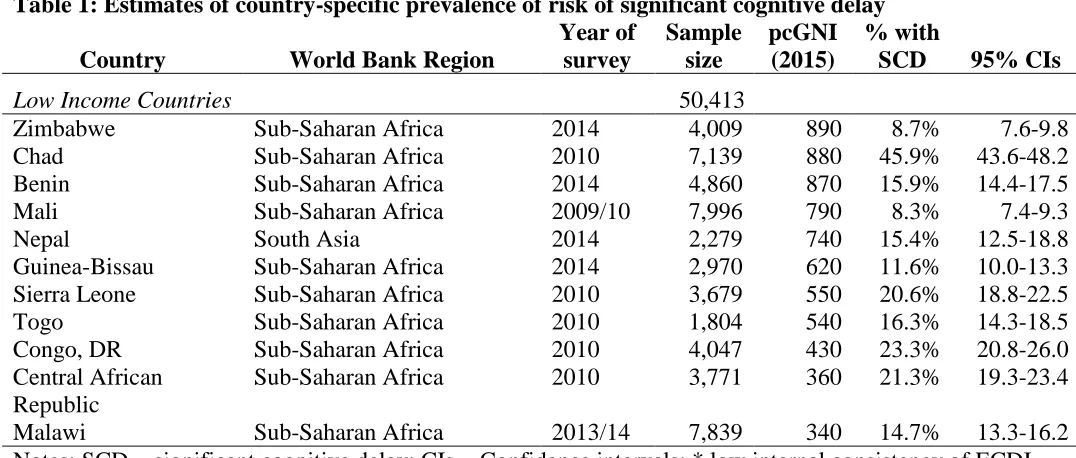
Page 21 of 28 Table 1: Estimates of country-specific prevalence of risk of significant cognitive delay
Country World Bank Region
Year of survey
Sample size
pcGNI (2015)
% with
SCD 95% CIs Upper Middle Income Countries 59,137
Argentina* Latin America & Caribbean 2011/12 3,625 12,430 0.8% 0.5-1.6 Panama Latin America & Caribbean 2013 2,315 11,730 3.1% 2.2-4.3 Kazakhstan Europe & Central Asia 2015 2,277 11,410 1.0% 0.7-1.7 Costa Rica* Latin America & Caribbean 2011 906 10,570 0.1% 0.0-0.4 Mexico* Latin America & Caribbean 2015 3,417 9,830 0.7% 0.5-1.1 Suriname* Latin America & Caribbean 2011 1,285 8,830 1.5% 0.9-2.5 Saint Lucia Latin America & Caribbean 2012 122 8,180 0.4% 0.1-2.9 Montenegro Europe & Central Asia 2013 649 7,280 0.9% 0.3-2.3 Turkmenistan* Europe & Central Asia 2015-16 1,518 7,120 2.1% 1.4-3.0 Belarus Europe & Central Asia 2012 1,412 6,720 0.1% 0.0-0.6 Cuba Latin America & Caribbean 2014 2,278 6,570 1.3% 0.6-3.1 Dominican Republic Latin America & Caribbean 2014 8,039 6,240 1.6% 1.1-2.0 Iraq Middle East & North Africa 2011 13,903 5,960 7.9% 7.2-8.7
Thailand South Asia 2012/13 4,359 5,690 0.9% 0.5-1.3
Serbia Europe & Central Asia 2014 1,211 5,540 0.2% 0.1-0.7
Macedonia Europe & Central Asia 2011 558 5,100 0.8% 0.3-2.2 Bosnia Europe & Central Asia 2011/12 1,031 5,050 0.2% 0.0-0.7 Algeria Middle East & North Africa 2012/13 5,562 4,800 6.6% 5.8-7.6 Jamaica Latin America & Caribbean 2011 671 4,730 0.6% 0.2-1.4 Belize Latin America & Caribbean 2011 788 4,510 0.9% 0.4-2.0 Paraguay Latin America & Caribbean 2016 1,861 4,210 2.4% 1.5-3.8 Guyana Latin America & Caribbean 2014 1,350 4,060 1.7% 0.8-3.6 Lower Middle Income Countries 53,243
Kosovo Europe & Central Asia 2013/14 672 3,980 1.6% 0.8-3.1 Tunisia Middle East & North Africa 2011/12 1,164 3,930 4.5% 3.3-6.3 Mongolia* Europe & Central Asia 2013/14 2,373 3,850 1.3% 0.9-1.8 El Salvador Latin America & Caribbean 2014 3,049 3,840 1.6% 1.2-2.2
Swaziland Sub-Saharan Africa 2014 1,091 3,280 3.8% 2.7-5.1
Nigeria Sub-Saharan Africa 2011 10,230 2,850 15.8% 14.6-17.1
Ukraine Europe & Central Asia 2012 1,929 2,650 0.9% 0.5-1.5
Bhutan South Asia 2010 2,422 2,340 4.4% 3.5-5.6
Moldova* Europe & Central Asia 2012 733 2,230 0.2% 0.1-0.9
Lao PDR South Asia 2011 4,476 2,000 5.2% 4.2-6.3
Vietnam South Asia 2013/14 1,207 1,990 3.1% 2.2-4.3
Palestine Middle East & North Africa 2014 3,280 1,875 4.8% 4.0-5.7 Sao Tome & Principe Sub-Saharan Africa 2014 867 1,690 14.2% 11.8-17.1
Ghana Sub-Saharan Africa 2011 3,069 1,470 7.8% 6.2-9.7
Cameroon Sub-Saharan Africa 2014 2,846 1,470 13.9% 12.3-15.6
Mauritania Sub-Saharan Africa 2011 3,718 1,230 7.2% 6.0-8.6
Bangladesh South Asia 2012/13 8,801 1,190 7.5% 6.8-8.3
Page 22 of 28 Table 1: Estimates of country-specific prevalence of risk of significant cognitive delay
Country World Bank Region
Year of survey
Sample size
pcGNI (2015)
% with
SCD 95% CIs Low Income Countries 50,413
Zimbabwe Sub-Saharan Africa 2014 4,009 890 8.7% 7.6-9.8
Chad Sub-Saharan Africa 2010 7,139 880 45.9% 43.6-48.2
Benin Sub-Saharan Africa 2014 4,860 870 15.9% 14.4-17.5
Mali Sub-Saharan Africa 2009/10 7,996 790 8.3% 7.4-9.3
Nepal South Asia 2014 2,279 740 15.4% 12.5-18.8
Guinea-Bissau Sub-Saharan Africa 2014 2,970 620 11.6% 10.0-13.3 Sierra Leone Sub-Saharan Africa 2010 3,679 550 20.6% 18.8-22.5
Togo Sub-Saharan Africa 2010 1,804 540 16.3% 14.3-18.5
Congo, DR Sub-Saharan Africa 2010 4,047 430 23.3% 20.8-26.0
Central African Republic
Sub-Saharan Africa 2010 3,771 360 21.3% 19.3-23.4
Malawi Sub-Saharan Africa 2013/14 7,839 340 14.7% 13.3-16.2
Page 23 of 28 Table 2: Population Attributable Fractions for Risk Factors of Significant Cognitive Delay among 3-4 Year Old Children in Upper Middle Income, Lower Middle Income and Low Income Countries
World Bank Income Group Classification
Risk Factor Upper
Middle
Lower
Middle Low
% children exposed
Relative household poverty 46.2% (44.2%-48.2%)
45.2% (43.6%-46.9%)
43.1% (41.9%-44.4%) Mother has less than secondary education 31.8%
(30.4%-33.4%)
57.9% (56.5%-59.3%)
81.4% (80.5%-82.2%) Child stunting 12.4%
(11.5%-13.4%)
37.0% (35.8%-38.2%)
38.7% (37.8%-39.6%) Unimproved water or sanitation 47.1%
(44.5%-49.6%)
54.3% (52.8%-55.8%)
80.2% (79.2%-81.3%) Low level of home stimulation 34.3%
(32.9%-35.8%)
50.4% (49.3%-51.5%)
63.4% (62.3%-64.5%) Unadjusted prevalence rate ratio (with 95% CI) for risk of significant cognitive delay
Relative household poverty 1.68 (1.44-1.97)
2.18 (1.96-2.44)
1.34 (1.26-1.43) Mother has less than secondary education 2.76
(2.38-3.22)
3.07 (2.69-3.51)
1.93 (1.74-2.14)
Child stunting 1.77
(1.47-2.14)
1.80 (1.63-1.98)
1.30 (1.23-1.38) Unimproved water or sanitation 0.81
(0.67-0.96)
2.07 (1.84-2.32)
2.03 (1.82-2.26) Low level of home stimulation 6.20
(5.29-7.27)
2.90 (2.56-3.29)
1.39 (1.28-1.50) Adjusted prevalence rate ratio (with 95% CI) for risk of significant cognitive delay
Relative household poverty 1.08 (0.91-1.28)
1.32 (1.18-1.48)
1.09 (1.02-1.16) Mother has less than secondary education 1.63
(1.36-1.97)
1.55 (1.34-1.80)
1.46 (1.29-1.66)
Child stunting 1.42
(1.17-1.42)
1.40 (1.27-1.54)
1.16 (1.10-1.23) Unimproved water or sanitation 0.96
(0.81-1.14)
1.42 (1.27-1.59)
1.79 (1.61-2.00) Low level of home stimulation 5.09
(4.18-6.19)
1.95 (1.72-2.21)
1.26 (1.17-1.37) Population attributable fraction
Relative household poverty 7.4% 12.1% 2.5%
Mother has less than secondary education -3.6% 22.1% 33.9%
Child stunting 2.4% 10.6% 9.5%
Unimproved water or sanitation 8.7% 18.9% 42.7%
Page 24 of 28 Global estimate of number of children under 5 for who risk could potentially be eliminated if …
Relative household poverty was eliminated 160,000 3,675,000 590,000 Every mother had secondary level education 575,000 6,850,000 4,185,000 Child stunting was eliminated 170,000 3,540,000 865,000 Every household had improved water or
sanitation
0 5,380,000 5,785,000 Every child had an acceptable level of home
stimulation
Page 25 of 28 Figure Caption
Page 26 of 28 Supplementary Table 1: Estimates of country-specific prevalence (% with 95% CIs) of risk of
significant cognitive delay by age and gender
Country Boys Girls
children aged 36-47 months
Children aged 48-59 months Upper Middle Income Countries
Argentina* 1.0%
(0.7%-1.6%) 0.5% (0.3%-1.0%) 0.9% (0.6%-1.5%) 0.7% (0.4%-1.2%)
Panama 2.3%
(1.5%-3.4%) 4.1% (2.4%-6.7% 5.3% (3.6%-7.7%) 1.0% (0.6%-1.6%)
Kazakhstan 1.0%
(0.8%-1.8%) 1.0% (0.6%-1.8%) 0.9% (0.5%-1.7%) 1.1% (0.6%-1.9%)
Costa Rica* 0.1%
(0.0%-0.7%) 0.1% (0.0%-0.4%) 0.1% (0.0%-0.8%) 0.1% (0.0%-0.4%)
Mexico* 1.0%
(0.6%-1.7%) 0.5% (0.3%-1.0%) 1.1% (0.7%-1.8%) 0.5% (0.3%-0.9%)
Suriname* 1.3%
(0.7%-2.5%) 1.7% (0.8%-3.4%) 1.4% (0.7%-2.8%) 1.6% (0.7%-3.4%)
Saint Lucia 0.8%
(0.1%-5.4%) 0.0% (0.0%-5.7%) 0.7% (0.1%-5.0%) 0.0% (0.0%-6.1%)
Montenegro 0.6%
(0.2%-2.4%) 1.2% (0.3%-4.8%) 0.5% (0.1%-2.3%) 1.2% (0.3%-4.4%)
Turkmenistan* 2.4%
(1.4%-4.0%) 1.7% (0.9%-3.3%) 4.0% (2.7%-5.9%) 0.2% (0.0%-1.6%)
Belarus 0.2%
(0.0%-0.8%) 0.1% (0.0%-0.7%) 0.3% (0.1%-1.0%) 0.0% (0.0%-0.6%)
Cuba 2.0%
(0.7%-5.1%) 0.5% (0.2%-1.2%) 1.5% (0.7%-3.0%) 1.1% (0.2%-5.9%)
Dominican Republic 1.3%
(1.0%-1.7%) 1.9% (1.5%-2.4%) 2.4% (2.0%-3.0%) 0.9% (0.6%-1.2%)
Iraq 8.6%
(7.7%-9.6%) 7.2% (6.4%-8.1%) 10.2% (9.3%-11.3%) 5.5% (4.8%-6.2%)
Thailand 0.7%
(0.4%-1.3%) 1.0% (0.5%-1.8%) 1.6% (1.0%-2.6%) 0.2% (0.1%-0.5%)
Serbia 0.2%
(0.1%-0.9%) 0.2% (0.1%-1.0%) 0.3% (0.1%-1.2%) 0.2% (0.0%-0.7%)
Macedonia 0.9%
(0.2%-3.4%) 0.8% (0.2%-3.0%) 1.7% (0.6%-4.4%) 0.0% (0.0%-1.3%)
Bosnia 0.2%
(0.0%-1.2%) 0.2% (0.0%-1.2%) 0.3% (0.1%-1.3%) 0.0% (0.0%-0.9%)
Algeria 7.1%
(5.9%-8.6%) 6.1% (5.2%-7.2%) 9.2% (7.8%-10.8%) 4.0% (3.2%-5.0%)
Jamaica 0.5%
(0.1%-1.9%) 0.7% (0.2%-2.4%) 1.3% (0.5%-3.4%) 0.0% (0.0%-1.0%)
Belize 0.9%
Page 27 of 28 Supplementary Table 1: Estimates of country-specific prevalence (% with 95% CIs) of risk of
significant cognitive delay by age and gender
Country Boys Girls
children aged 36-47 months
Children aged 48-59 months
Paraguay 2.4%
(1.6%-3.6%) 2.4% (1.6%-3.6%) 3.0% (2.2%-4.6%) 1.8% (1.1%-2.9%)
Guyana 2.5%
(1.0%-6.2%) 0.9% (0.4%-1.9%) 3.0% (1.3%-6.7%) 0.5% (0.2%-1.3%) Lower Middle Income Countries
Kosovo 2.7%
(1.4%-5.4%) 0.4% (0.1%-2.7%) 2.4% (1.1%-5.35) 0.9% (0.3%-2.9%)
Tunisia 5.4%
(3.6%-7/8%) 3.7% (2.2%-6.0%) 7.3% (5.1%-10.3%) 1.5% (0.8%-2.6%)
Mongolia* 1.7%
(1.1%-2.6%) 1.0% (0.5%-1.7%) 1.9% (1.2%-2.9%) 0.8% (0.4%-1.5%)
El Salvador 1.8%
(1.2%-2.7%) 1.4% (0.8%-2.4%) 1.8% (1.2%-2.8%) 1.4% (0.8%-2.4%)
Swaziland 5.7%
(3.9%-8.1%) 1.9% (1.0%-3.5%) 4.8% (3.2%-7.0%) 2.8% (1.7%-4.7%)
Nigeria 16.5%
(15.0%-18.1%) 15.1% (13.7%-16.7%) 19.4% (17.7%-21.2%) 12.0% (10.7%-13.5%)
Ukraine 1.1%
(0.6%-1.9%) 0.7% (0.3%-1.4%) 1.7% (1.1%-2.8%) 0.1% (0.0%-0.5%)
Bhutan 4.9%
(3.7%-6.6%) 3.9% (2.8%-5.4%) 6.2% (4.8%-8.0%) 2.6% (1.7%-3.9%)
Moldova* 0.2%
(0.0%-1.3%) 0.3% (0.0%-1.9%) 0.2% (0.0%-1.6%) 0.2% (0.0%-1.5%)
Lao PDR 5.4%
(4.2%-6.8%) 4.9% (3.8%-6.3%) 6.7% (5.4%-8.3%) 3.5% (2.4%-4.9%)
Vietnam 3.1%
(1.8%-5.0%) 3.1% (1.9%-5.0%) 4.0% (2.6%-6.1%) 2.3% (1.3%-4.2%)
Palestine 5.3%
(4.3%-6.6%) 4.3% (3.3%-5.4%) 5.6% (4.5%-6.9%) 4.0% (3.1%-5.2%) Sao Tome & Principe 15.6%
(12.2%-19.7%) 12.9% (9.8%-16.8%) 18.4% (15.0%-22.4%) 10.2% (7.1%-14.5%)
Ghana 7.4%
(5.7%-9.6%) 8.1% (6.0%-10.8%) 9.9% (7.7%-12.8%) 5.3% (3.9%-7.2%)
Cameroon 14.5%
(12.2%-17.1%) 13.2% (11.1%-15.7%) 19.4% (17.0%-22.1%) 7.8% (6.1%-10.0%)
Mauritania 7.6%
(6.2%-9.4%) 6.7% (5.3%-8.4%) 8.2% (6.8%-9.9%) 6.1% (4.7%-7.8%)
Bangladesh 7.6%
(6.7%-8.7%) 7.4% (6.4%-8.5%) 9.6% (8.5%-10.8%) 5.5% (4.7%-7.8%)
Kyrgyzstan* 5.4%
Page 28 of 28 Supplementary Table 1: Estimates of country-specific prevalence (% with 95% CIs) of risk of
significant cognitive delay by age and gender
Country Boys Girls
children aged 36-47 months
Children aged 48-59 months Low Income Countries
Zimbabwe 9.2%
(8.0%-10.6%) 8.1% (7.0%-9.4%) 11.4% (10.1%-12.9%) 5.6% (4.7%-6.8%)
Chad 45.9%
(43.1%-48.7%) 45.9% (43.1%-48.7%) 50.9% (48.2%-53.6%) 40.7% (38.1%-43.4%)
Benin 17.1%
(15.2%-19.1%) 14.7% (12.9%-16.8%) 20.8% (18.7%-23.1%) 11.0% (9.4%-12.8%)
Mali 8.7%
(7.6%-10.1%) 7.8% (6.8%-9.1%) 11.5% (10.1%-12.9%) 4.1% (3.3%-5.1%)
Nepal 15.5%
(12.4%-19.3%) 15.3% (11.7%-19.8%) 19.1% (15.2%-23.9%) 11.8% (8.7%-15.6%)
Guinea-Bissau 13.6%
(11.4%-16.1%) 9.6% (8.0%-11.5%) 16.7% (14.2%-19.4%) 6.4% (5.0%-8.2%)
Sierra Leone 18.7%
(16.5%-21.1%) 22.5% (20.0%-25.1%) 23.1% (20.7%-25.8%) 17.5% (15.4%-19.9%)
Togo 16.2%
(13.5%-19.3%) 16.4% (13.8%-19.3%) 21.5% (18.4%-25.0%) 10.1% (8.1%-12.4%)
Congo, DR 24.6%
(21.5%-27.9%) 22.0% (19.0%-25.4%) 26.8% (23.9%-30.0%) 18.7% (15.9%-21.8%) Central African Republic 22.8% (20.3%-25.5%) 19.9% (17.7%-22.3%) 25.4% (22.8%-28.1%) 16.3% (14.0%-19.0%)
Malawi 15.6%
(13.8%-17.5%) 13.8% (11.0%-15.9%) 18.4% (16.6%-20.4%) 10.8% (9.3%-12.5%) Notes:
SCD = significant cognitive delay CIs = Confidence intervals