CLASSIFICATION OF FINANCIAL RATIOS OF PUBLIC SECTOR BANKS IN INDIA USING
MULTIVARIATE STATISTICAL ANALYSIS
*Chandrasekaran
Department of Statistics, Madras Christian College, Chennai 600 059, Tamil Nadu, India
ARTICLE INFO ABSTRACT
In the face of growing competition, the policy changes and the operational environment in respect of the Indian banking system, there has been an increased focus on profitability despite other social objectives being important. Moreover, the setting up of
banks to retain their shares. Keeping this in mind, the present study was undertaken to examine the classification pattern of financial ratios of all public sector banks in
corporate offices in three different regions of the country.
and makes use of secondary data. The relevant secondary data have been collect a period of 10 years from 2000
profitability ratios are considered for the study. Based on the head office, all the 27 public sector banks i categorized into location of three different regions
eastern region (NER). The northern and eastern region banks are jointly presented for the analysis, since it is observed that the ban
they are clubbed, a balanced study among the regions can be conveniently attempted. to examine the classification pattern of financial rat
sector banks in India
been used. Factor Analysis on 19 variables (Financial ratios) resulted in four u
factor is named in an appropriate manner considering the factor loadings and constituent variables (ratios). Representative ratios are identified for each such factor. To validate the result of factor analysis and to re conclusion regarding the representative ratios, Cluster analysis is performed. Multivariate Discriminant Analysis is performed for the original variables and using
Perceptual mapping was d
Copyright © Chandrasekaran, R. and Madhanagopal, R.
unrestricted use, distribution, and reproduction in any medium, provided the original work
INTRODUCTION
Indian banking industry which has Reserve Bank of India as it is regulatory authority, is a mix of public, private sector, and foreign banks. Due to arrival of new private, foreign banks and non
financial services, presently banking sector faces
changing regulations, intensified competition from non
financial services firms, spreading inter-nationalization of markets and continuing innovations in technology and automation. Due to this, analyzing the banks performance has been an important issue particularly in developing countries because these banks are the dominant financial institutions and represent the major source of financial intermediation. Also evaluating banks profitability, overall performance and monitoring their financial condition is important to many parties such as, Investors, Managers, Creditors, auditors, financial analysts and others (Bendell, 1998). Financial ratio
is a useful measure to provide a snapshot of a firm’s financial position at any particular moment of time or to provide a comprehensive idea about the financial performance of the firm’s or company over a particular period of time (Muresan and Wolitzer, 2004). It is also a useful tool for comparing a firm’s or company financial position and performance with respect to others in the same or different industry to pinpoint problem areas or to identify areas of further improvements. These financial ratios are computed from financial statements of a firm’s or company, viz., Balance Sheet, Profit and Loss Account or
*Corresponding author: R. Chandrasekaran (Retd.), Department of Statistics, Madras Christian College, Chennai 600 059, Tamil Nadu, India
ISSN: 0975-833X
Article History:
Received 05thJuly, 2013
Received in revised form 24th August, 2013
Accepted 29th August, 2013
Published online 14th September, 2013
Key words:
Financial ratios, Factor analysis,
Multivariate discriminant analysis, Cluster analysis,
Perceptual mapping.
RESEARCH ARTICLE
CLASSIFICATION OF FINANCIAL RATIOS OF PUBLIC SECTOR BANKS IN INDIA USING
MULTIVARIATE STATISTICAL ANALYSIS
Chandrasekaran, R. (Retd.)
and Madhanagopal, R.
Department of Statistics, Madras Christian College, Chennai 600 059, Tamil Nadu, India
ABSTRACT
In the face of growing competition, the policy changes and the operational environment in respect of the Indian banking system, there has been an increased focus on profitability despite other social objectives being important. Moreover, the setting up of a new competitive environment has resulted in new challenges for the public sector banks to retain their shares. Keeping this in mind, the present study was undertaken to examine the classification pattern of financial ratios of all public sector banks in India, and a comparative analysis of the banks with their corporate offices in three different regions of the country. The present study is diagnostic and exploratory in nature and makes use of secondary data. The relevant secondary data have been collect
a period of 10 years from 2000-2001 to 2009-2010. Out of many possible financial ratios, the fifteen consistent profitability ratios are considered for the study. Based on the head office, all the 27 public sector banks i
categorized into location of three different regions viz., Southern region (SR), Western region (WR) and North eastern region (NER). The northern and eastern region banks are jointly presented for the analysis, since it is observed that the bank with their head offices in northern and eastern regions are few in number and only when they are clubbed, a balanced study among the regions can be conveniently attempted.
examine the classification pattern of financial ratios that contribute to the overall performance of the public sector banks in India. For this purpose, Factor analysis (FA), Discriminant analysis (DA) and perceptual maps have been used. Factor Analysis on 19 variables (Financial ratios) resulted in four u
factor is named in an appropriate manner considering the factor loadings and constituent variables (ratios). Representative ratios are identified for each such factor. To validate the result of factor analysis and to re conclusion regarding the representative ratios, Cluster analysis is performed. Multivariate Discriminant Analysis is performed for the original variables and using Standardized Canonical Discriminant Function Coefficients Perceptual mapping was drawn.
Chandrasekaran, R. and Madhanagopal, R.This is an open access article distributed under the Creative Commons Attribution License, which permits unrestricted use, distribution, and reproduction in any medium, provided the original work is properly cited.
Indian banking industry which has Reserve Bank of India as it is regulatory authority, is a mix of public, private sector, and foreign banks. Due to arrival of new private, foreign banks and non – banking many pressures from changing regulations, intensified competition from non-banking nationalization of markets and continuing innovations in technology and automation. Due to this, s been an important issue particularly in developing countries because these banks are the dominant financial institutions and represent the major source of financial intermediation. Also evaluating banks profitability, overall their financial condition is important to many parties such as, Investors, Managers, Creditors, auditors, Financial ratio analysis is a useful measure to provide a snapshot of a firm’s financial position at any particular moment of time or to provide a comprehensive idea about the financial performance of the firm’s or company over a itzer, 2004). It is also a useful tool for comparing a firm’s or company financial position and performance with respect to others in the same or different industry to pinpoint problem areas or to identify areas of further improvements.
ios are computed from financial statements of a ., Balance Sheet, Profit and Loss Account or
Department of Statistics, Madras Christian College, Chennai 600 059, Tamil Nadu, India
Income Statement, and Cash Flow Analysis (De
Therefore, the present study was focused only on public sector banks in India and attempts to examine the classification pattern of financial ratios that contribute to the overall performance of the public sector banks in India and comparative analysis of
corporate head offices in the three different specified regions of the country was determined.
Commercial banking system in India
The banking system is an integral sub The Reserve Bank of India (RBI
body for all matters relating to the banking system.
all other banks. The Indian banking industry, with Reserve Bank of India as its regulatory authority, is a blend of public, private and foreign banks. The private sector banks are again further split into old and new banks. The organization of this paper is as follows. Section 2 deals with the literature review. Section 3 describes the variable and sample selection for this study. Sections 4 desc
method used for the analysis; section 5 presents and discusses the empirical findings. Conclusions are formulated in section 6.
Review of literature
To analysis the banks performance financial ratios where used as one of the factor, these ratios are calculated or obtained from banks balance sheet, profit and loss statements.
person to study the bankruptcy of the firms using
International Journal of Current Research
Vol. 5, Issue, 09, pp.2557-2562, September,2013
CLASSIFICATION OF FINANCIAL RATIOS OF PUBLIC SECTOR BANKS IN INDIA USING
R.
Department of Statistics, Madras Christian College, Chennai 600 059, Tamil Nadu, India
In the face of growing competition, the policy changes and the operational environment in respect of the Indian banking system, there has been an increased focus on profitability despite other social objectives being important. a new competitive environment has resulted in new challenges for the public sector banks to retain their shares. Keeping this in mind, the present study was undertaken to examine the classification India, and a comparative analysis of the banks with their The present study is diagnostic and exploratory in nature and makes use of secondary data. The relevant secondary data have been collected from Capita online database for 2010. Out of many possible financial ratios, the fifteen consistent profitability ratios are considered for the study. Based on the head office, all the 27 public sector banks in India are ., Southern region (SR), Western region (WR) and North-eastern region (NER). The northern and North-eastern region banks are jointly presented for the analysis, since it is
k with their head offices in northern and eastern regions are few in number and only when they are clubbed, a balanced study among the regions can be conveniently attempted. The underlying objective is ios that contribute to the overall performance of the public For this purpose, Factor analysis (FA), Discriminant analysis (DA) and perceptual maps have been used. Factor Analysis on 19 variables (Financial ratios) resulted in four underlying categories (factors). Each factor is named in an appropriate manner considering the factor loadings and constituent variables (ratios). Representative ratios are identified for each such factor. To validate the result of factor analysis and to reach final conclusion regarding the representative ratios, Cluster analysis is performed. Multivariate Discriminant Analysis is Standardized Canonical Discriminant Function Coefficients
This is an open access article distributed under the Creative Commons Attribution License, which permits
Income Statement, and Cash Flow Analysis (De et al., 2010). Therefore, the present study was focused only on public sector banks in India and attempts to examine the classification pattern of financial ratios that contribute to the overall performance of the public sector banks in India and comparative analysis of the banks with their corporate head offices in the three different specified regions of the
Commercial banking system in India
The banking system is an integral sub-system of the financial system. The Reserve Bank of India (RBI), India’s central bank, is the apex body for all matters relating to the banking system. It is the banker to all other banks. The Indian banking industry, with Reserve Bank of India as its regulatory authority, is a blend of public, private and banks. The private sector banks are again further split into old The organization of this paper is as follows. Section 2 deals with the literature review. Section 3 describes the variable and sample selection for this study. Sections 4 describe the statistical method used for the analysis; section 5 presents and discusses the empirical findings. Conclusions are formulated in section 6.
To analysis the banks performance financial ratios where used as one of the factor, these ratios are calculated or obtained from banks balance sheet, profit and loss statements. Beaver (1966) was the first person to study the bankruptcy of the firms using financial ratios.
He applied uni-variate statistical analysis for the prediction of corporate failure also compared the means of the failed firms with non-failed firms and showed that failed firms have lower financial ratios and identified the following six as the important financial ratios cash flow to total debt, net income to total assets, total debt to total assets, working capital to total assets, current ratio, and no-credit interval. Seeking to eliminate the weakness of the Beaver’s model, Altman (1968) used multiple discriminant analysis (MDA) to derive a linear combination of the ratios which best discriminate between financially failed and non-failed groups. He matched 33 bankruptcies firms with the 33 non-distressed firms from the same industry and of similar size. 22 financial ratios were used in his study and computed the Z-score with 5 most important financial ratios. Companies with a Z-score lower than the cutoff score are financially distressed; firms having a Z-score higher than the cutoff score are financially sound. The lower a firm’s Z-score, the higher its probability of default. Ohlson (1980) introduced an alternative technique based on the logistic transformation (logit model). Like discriminant analysis, this technique weights the independent variables and assigns a score. Many new attempts were made by the researches to determine classification pattern of firms or banks using financial ratios. Pinches, Mingo and Caruthers (1973) developed an empirically based classification system for financial ratios using factor analysis method. It was a remarkable work and therefore many others researches used this method for their studies for eg. Laurent (1979), Courtis (1978), Jonson (1979), Aho (1980), Chen and Shimerda (1981), Cowen and Hoffer (1982), Litinen (1983). Yli-Olli and Virtasnen (1985) and Ezzamel, Brodie and Mar-Molinero (1987). Green (1978) stated that financial ratios have long been regarded as barometers of corporate health, being used for reporting liquidity, leverage, activity and profitability and that an investor may use financial ratios to appraise a company’s performance and its future prospect of success. Bourke (1989) Using the factor analysis method to the financial ratios and found that there is a more important positive relationship between capital adequacy and banks profitability. Ali et al. (1995) and Charbaji (2001) classified banks into groups based on a number of performance measures; they used cluster analysis and MDA. Zopounidis et al. (1995) used ordinal regression models to evaluate bank’s performance whereas Shih et al. (2007) only used the technique of PCA and compared performance amongst banks in different ownership groups. Cheng and Ariff (2007) investigated the relationship between banks’ risk and abnormal returns using regression analysis whereas Yeh (1996) investigated the relationship between bank’s efficiency scores produced by Data Envelopment Analysis (DEA) and banks’ financial characteristics.
Variables and sample selection
The present study was diagnostic and exploratory in nature and makes use of secondary data. The relevant secondary data has been collected from Capita online database for a period of ten years from 2000-2001 to 2009-2010. Out of many profitability ratios, the most important 19 profitability ratios were considered. These 19 ratios were the mostly used by the previous research. List of profitability ratios which are used for this study are shown in Appendix A. Based on the head office located at every region all the 27 public sector banks in India are considered on three different regions viz., Southern, Western and North-eastern regions.
Statistical methods
For various statistical analysis of this study, the statistical software, IBM SPSS 19 version was used. First, a mean, standard deviation, minimum and maximum for all the profitability ratios were obtained (Table 1). Secondly, all variables were normalized using the formula
− ( ) / ( ( ) − ( )) and then factor analysis
with Principal Component extraction method was performed on the selected set of variables. VARIMAX rotation was used to get better final results (Timm, 2011). To verify the categories of variables (factors) ascertained by the Factor Analysis, Cluster Analysis was applied on the same set of variables with the predefined number of clusters. To emphasize the degree of correlation amongst the variables as a measurement of similarity, hierarchical clustering approach using Ward’s Method with the Pearson Correlation interval measure was applied (De et al., 2011).After the validation of the results of Factor Analysis is done, Multivariate Discriminant Analysis is performed for the original variables and using Standardized Canonical Discriminant Function Coefficients, Perceptual mapping drawn.
Empirical findings
Descriptive statistical analysis
Descriptive statistics such as mean, standard deviation, minimum and maximum for all the variables were calculated was shown in Table 1.
Factor analysis
Factor Analysis was conducted for the 19 financial ratios; it was observed that 19 ratios have been categorized in four factors.
Table 1. Descriptive analysis of financial ratios
VARIABLES MEAN SD MIN MAX
DEB 18.62 9.38 -61.59 72.74
NIITITA 2.95 0.38 1.89 3.94
IETOTA 5.36 1.06 2.95 7.81
COF 6.40 1.41 4.03 9.88
DEBTRAT 0.87 0.04 0.73 0.97
OPTOTA 2.06 0.84 -0.80 4.36
IITOTA 8.30 1.09 3.09 10.75
OINCTTIN 15.11 4.22 7.15 26.81
BTOTA 1.10 0.66 -0.75 2.87
BTOII 12.28 7.03 -9.61 28.50
NIITOTA 1.49 0.48 0.55 3.01
OETOTA 2.43 0.47 1.47 3.99
CDRATIO 51.72 10.14 6.60 76.61
PCTOTA 1.20 0.48 -0.13 2.88
TRDTOTD 63.51 5.47 47.87 75.23
SATOTA 88.01 6.66 63.14 99.41
TLTOTA 41.16 10.94 15.27 64.29
LIQRAT 1.62 0.85 0.40 5.22
IEXPIEAR 63.98 6.57 49.49 87.86
[image:3.595.304.562.140.257.2]Mean value ranges from 0.87 to 88.01, the standard deviations of variable TLTOTA (10.94) and CDRATIO (10.14) are relatively higher; While the others range from 9.38 to 0.04 (average 2.77).
Table 2. Results of KMO and Bartlett’s test
KMO of Sampling Adequacy 0.804
Bartlett's Test Approx. Chi-Square 5453.70
Degrees of freedom 171
Significance 0.000
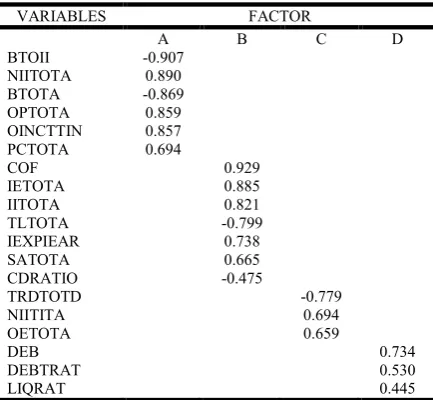
These factors account for about 72% of the total variance, which can be considered as good. Results of KMO and Bartlett's Test are presented in Table 2. KMO sample adequacy is more than 0.7, which can be considered as reasonably good (Ocal et al., 2007). The rotated component matrix is produced in Table 5. From Table 5, it was observed BTOII, NIITOTA, BTOTA, OPTOTA, OINCTTIN and PCTOTA had greater value than other components and it formed the first factor, (Factor A). In the second factor COF, IETOTA, IITOTA, TLTOTA, IEXPIEAR, SATOTA and CDRATIO had greater values than others, and was named as factor B and the third factor includes TRDTOTD, NIITITA and OETOTA named as factor C and DEBTRAT, DEB, LIQRAT are in fourth factor and its named as factor D.
Table 3. Factor Analysis - Rotated Component Matrix
VARIABLES FACTOR
A B C D
BTOII -0.907
NIITOTA 0.890
BTOTA -0.869
OPTOTA 0.859
OINCTTIN 0.857
PCTOTA 0.694
COF 0.929
IETOTA 0.885
IITOTA 0.821
TLTOTA -0.799
IEXPIEAR 0.738
SATOTA 0.665
CDRATIO -0.475
TRDTOTD -0.779
NIITITA 0.694
OETOTA 0.659
DEB 0.734
DEBTRAT 0.530
LIQRAT 0.445
Cluster analysis
[image:3.595.72.255.324.367.2]Cluster analysis was performed on the same set of 19 variables on which factor analysis was performed already. Number of clusters was pre-defined, four (i.e. the number of factors already ascertained). The results of Cluster analysis are produced in Table 3.
Table 4. Cluster analysis result
S.NO Ratio Code Cluster
Membership S.NO Ratio Code
Cluster Membership
1 DEB 1 11 NIITOTA 2
2 NIITITA 4 12 OETOTA 4
3 IETOTA 3 13 CDRATIO 2
4 COF 3 14 PCTOTA 2
5 DEBTRAT 1 15 TRDTOTD 4
6 OPTOTA 2 16 SATOTA 3
7 IITOTA 3 17 TLTOTA 2
8 OINCTTIN 2 18 LIQRAT 1
9 BTOTA 2 19 IEXPIEAR 3
10 BTOII 2
Comparison of the result of factor analysis and cluster analysis
Final results of factor and cluster analysis were arranged in a manner such that comparison was possible against each other (Table 4). Clusters are plotted against the identical or most identical (on the basis of constituent variables) factors. After a careful study on Table 4, it was observed that Factor 3 was same with the corresponding clusters 4 and factor 4 was same with the corresponding Clusters 1. Factor 1 and Cluster 2 are almost same except for the presence of CDRATIO and TLTOTA in Cluster 2. The variable CDRATIO and TLTOTA are
mismatched in Factor 2, which is evident from the corresponding
cluster (Cluster 4). CDRATIO and TLTOTA are best suited in Factor 1 which is confirmed by its corresponding cluster (Cluster 2). This deviation did not significantly challenge the outcome of the factor analysis; rather the outcome improved and was validated by cluster analysis results. Therefore, it can be accepted that the four factors validated by the cluster analysis.
Table 5. Comparison of the Result of Factor Analysis and Cluster Analysis
Factor Ratios No. of
Ratios
Clusters Ratios No. of
Ratios
F1 BTOTA,
NIITOTA, BTOII, OPTOTA, OINCTTIN, PCTOTA
6 C2 OPTOTA,
OINCTTIN, NIITOTA, CDRATIO, PCTOTA, TLTOTA, BTOTA, BTOII
8
F2 IETOTA,
IEXPRIEAR, COF, IITOTA, SATOTA,TLTO TA, CDRATIO
7 C3 IETOTA,
IEXPIEAR, COF, IITOTA, SATOTA
5
F3 TRDTOTD,
NIITITA, OETOTA
3 C4 OETOTA,
NIITITA, TRDTOTD
3
F4
DEBTRAT, DEB, LIQRAT
3 C1 DEBTRAT,
DEB, LIQRAT
3
Total 19 Total 19
Multivariate discriminant analysis
Estimation of discriminant function
[image:3.595.309.558.472.685.2] [image:3.595.55.272.544.744.2]profitability ratios and it resulted in two discriminant functions and consequently two eigenvalues. The highest eigenvalue (0.517) corresponds to the first discriminant function, which shows the strongest power of discrimination of three regions. Further the first function accounts for 80% of dispersion of the group means, as compared to the other which accounts for less than 20% of dispersion. The canonical correlation coefficient, measuring the relation between the discriminant factorial coordinates and the grouping variable shows
[image:4.595.331.534.167.369.2]34.11%, (0.584)2 of the total variance (Table 6).
Table 6. Eigen value and Canonical correlation
Function Eigen value % of
Variance Cumulative %
Canonical Correlation
1 0.517 80.6 80.6 0.584
2 0.125 19.4 100.0 0.333
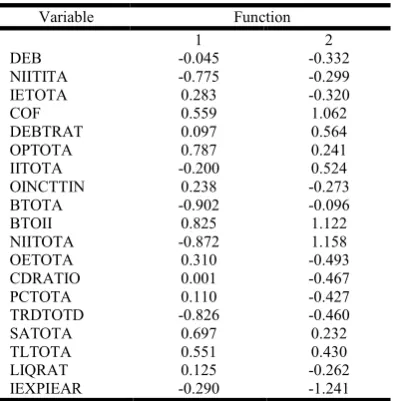
The discriminating variables are expressed in different units of measure, and consequently the standardized coefficients of the discriminant function were calculated (Jaba and Grama, 2004) (Table
7). The discriminant function coefficients were used for calculating
the discriminant score for each case in particular. Taking into account, first function has the highest discriminating power, and shall focus our attention upon analyzing its results. Therefore, the first discriminant function is
D1 = -0.045Z1 -0.775Z2 +0.283Z3 +0.559Z4 +0.097Z5 -0.787Z6
-0.200Z7 +0.238Z8 -0.902Z9 +0.825Z10 - 0.872Z11
+0.310Z12 +0.001Z13 +0.110Z14 - 0.826Z15+ 0.697Z16
+ 0.551Z17+ 0.125Z18-0.290Z19
The second discriminant function is
D2 = -0.332Z1 -0.299Z2 -0.320Z3 +1.062Z4 +0.564Z5 +0.241Z6
+0.524Z7 -0.273Z8 -0.096Z9 +1.122Z10 +1.158Z11 -0.493Z12 -
0.467Z13 -0.427Z14 -0.460Z15+0.232Z16+0.430Z17- 0.262Z18
-1.241Z19
Where Zi’s are standardized value of Xi’s variables. The size of the
[image:4.595.36.288.174.217.2]coefficients indicates the discriminant power of the predictor variables. The sign indicates the direction of the relationship. Therefore, it can be seen that the variables BTOTA, NIITOTA, TRDTOTD, BTOII, OPTOTA, NIITITA, SATOTA, COF, and TLTOTA discriminate best among the groups. From the second discriminant function, IEXPIEAR, NIITOTA, BTOII, COF, DEBTRAT IITOTA, OETOTA, CDRATIO and TRDTOTD are best predictors.
Table 7. Standardized Canonical discriminant function coefficients
Variable Function
1 2
DEB -0.045 -0.332
NIITITA -0.775 -0.299
IETOTA 0.283 -0.320
COF 0.559 1.062
DEBTRAT 0.097 0.564
OPTOTA 0.787 0.241
IITOTA -0.200 0.524
OINCTTIN 0.238 -0.273
BTOTA -0.902 -0.096
BTOII 0.825 1.122
NIITOTA -0.872 1.158
OETOTA 0.310 -0.493
CDRATIO 0.001 -0.467
PCTOTA 0.110 -0.427
TRDTOTD -0.826 -0.460
SATOTA 0.697 0.232
TLTOTA 0.551 0.430
LIQRAT 0.125 -0.262
IEXPIEAR -0.290 -1.241
Dominant variables in bank- groups
[image:4.595.321.544.479.569.2]The dominant variables of each group of banks are shown in Table 8, from which it was observed that financial ratios NIITITA, IETOTA, IITOTA, OETOTA and TRDTOTD, were more dominant in southern region. In western regions, the variables DEB, OINCTTIN, NIITOTA, CDRATIO, PCTOTA, LIQRAT and IEXPIEAR were dominating. The variables COF, DEBTRAT, OPTOTA, BTOTA, BTOII, SATOTA and TLTOTA were dominants in the north- eastern region.
Table 8. Fisher's Linear discriminant functions
REGIONS
Variable SRB WRB NERB
DEB 193.301 196.125 191.870
NIITITA 22.797 20.219 15.312
IETOTA -97.013 -94.825 -94.841
COF 87.808 86.725 92.121
DEBTRAT 11.234 9.284 12.501
OPTOTA 514.773 518.020 523.371
IITOTA 20.695 16.809 18.448
OINCTTIN 206.666 208.568 208.542
BTOTA -109.416 -113.482 -118.230
BTOII 581.715 581.341 589.993
NIITOTA -116.598 -124.862 -124.122
OETOTA -62.019 -58.674 -59.284
CDRATIO 27.107 29.452 26.916
PCTOTA 50.577 53.083 51.615
TRDTOTD 28.521 22.776 20.839
SATOTA 21.722 24.259 28.646
TLTOTA 35.430 36.250 39.899
LIQRAT 22.584 24.285 23.745
IEXPIEAR 380.228 383.898 376.812
*SRB – Southern Region Bank, WRB- Western Region Banks NERB-Northern and Eastern Region Banks
Efficiency of discriminant function
[image:4.595.65.262.564.765.2]Based on the discriminant function, 62.2% of the bank groups has been correctly classified (Table 9), and the percentage of correctly classified cases was 73.0 % for southern, 46.7% for western and 66.3% for north-eastern regions.
Table 9. Classification of original and predicted groups
Predicted group member Total
SRB WRB NERB
Original
Percentage
SRB 73 21 06 100
WRB 22 42 26 90
NERB 08 19 53 80
SRB 73.0 21.0 6.0 100
WRB 24.4 46.7 28.9 100
NERB 10.0 23.8 66.3 100
The combined group plots are shown in Figure 1.
[image:4.595.309.542.590.760.2]Perceptual mapping
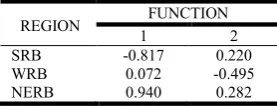
[image:5.595.93.232.225.278.2]To find out the positioning of financial ratios to different regions, the attribute based perceptual mapping was used. Discriminant analysis was performed and significant differences between three regions were determined. From Standardized Canonical Discriminant Function Coefficients (Table 7); it appears that there are two different functions for 19 financial ratios; Function 1 consists of 6 ratios viz., NIITITA, OPTOTA, BTOTA, TRDTOTD, SATOTA and TLTOTA and Function 2 of 13 ratios, DEB, IETOTA, COF, DEBTRAT, IITOTA, OINCTTIN, BTOII, NIITOTA, OETOTA, CDRATIO, PCTOTA, LIQRAT and IEXPIEAR . A perceptual map was drawn using the Standardized canonical Discriminant Function coefficients (Table 7) and Discriminant Analysis Function at group centroids (Table 10).
Table 10. Discriminant analysis- functions at group centriods
REGION FUNCTION
1 2
SRB -0.817 0.220
WRB 0.072 -0.495
NERB 0.940 0.282
From Figure 2, it seems that three regions (Southern, Western and North-Eastern) have their unique position on the map. It was also observed that Southern and North-Eastern region are very strong in dimension 1 and western region associated with the dimension 2. The profitability ratios NIITOTA, BTOTA,TRDTOTD and NIITITA strongly contributes to southern region. The ratios IEXPRIER, CDRATIO, PCTOTA, LIQRAT, OETOTA, IETOTA and OINCTTIN to western region and for north-eastern region it was COF, BTOII, TLTOTA, SATOTA and OPTOTA. Even through the variable IITOTA and DEBTRAT fall in dimension 2 it does not contribute much for western region banks.
Figure 2. Perceptual map of bank groups and financial ratios
Conclusion
From the present study an attempt has been made to examine the classification pattern of financial ratios that contribute to the overall performance of the public sector banks in India and also perform comparative analysis of the banks with their corporate head offices in the three different specified regions of the country. For comparative study, based on the head office located at every region all the 27 public sector banks were considered on three different regions viz., southern, western and north-eastern regions. Factor analysis was used for the 19 financial ratios and was observed that 19 ratios have been categorized in four factors. These factors account for about 72% of the total variance. For the validation of factors, cluster analysis was performed on the same set of 19 variables on which factor analysis was performed already. Number of clusters was also pre-defined (four). By comparing both, it was observed that factor 3 and cluster 4 financial ratios were same similarly factor 4 was same with
corresponding cluster 1. Factor 1 and Cluster 2 are almost same except for the presence of CDRATIO and TLTOTA in cluster 2 The variable CDRATIO and TLTOTA are mismatched in factor 2, which is evident from the corresponding cluster (cluster 4). CDRATIO and TLTOTA are best suited in factor 1 which is confirmed by its corresponding cluster (cluster 2). This deviation did not significantly challenge the outcome of the factor analysis; rather the outcome was improved and validated by cluster analysis results. Therefore, it can be accepted the three factors as validated by the Cluster analysis.
From factor analysis, BTOII, NIITOTA, BTOTA, OPTOTA, OINCTTIN and PCTOTA had greater value than other components and it formed the first factor, (Factor A). In the second factor COF, IETOTA, IITOTA, TLTOTA, IEXPIEAR, SATOTA and CDRATIO had greater values than others, and was named as factor B and the third factor includes TRDTOTD, NIITITA and OETOTA named as factor C and DEBTRAT, DEB, LIQRAT are in fourth factor and its named as factor D. By performing the multivariate discriminant analysis for the original 19 financial ratios by grouping region wise and it resulted in 2 discriminant functions and consequently 2 eigenvalues. The highest eigenvalue (0.517) corresponds to the first discriminant function, which shows that it has the strongest power of discrimination of the three regions. From fisher linear discriminant function financial ratios NIITITA, IETOTA, IITOTA, OETOTA and TRDTOTD were more dominant in southern region. In western regions, the variables DEB, OINCTTIN, NIITOTA, CDRATIO, PCTOTA, LIQRAT and IEXPIEAR were dominating. The variables COF, DEBTRAT, OPTOTA, BTOTA, BTOII, SATOTA and TLTOTA were dominants in the north- eastern region. Basedon discriminant function, 62.2% of the banks groups have been correctly classified. The findings indicate the percentage of correct classified cases, 73.0% for southern, 46.7% for western and 66.3% for north-eastern regions. A perceptual map is drawn using the standardized canonical discriminant Function coefficients and function at group centroids to see the financial ratios position for the different regions, it appears that the ratios NIITITA, OPTOTA, BTOTA, TRDTOTD, SATOTA and TLTOTA contributes for function 1 and ratios DEB, IETOTA, COF, DEBTRAT, IITOTA, OINCTTIN, BTOII, NIITOTA, OETOTA, CDRATIO, PCTOTA, LIQRAT and IEXPIEAR contributes for function 2. From the perceptual map it was observed that three regions have their unique position and also southern and north-eastern regions are associated to the function 1 and western region associated to function 2. The financial ratios NIITOTA, BTOTA, TRDTOTD and NIITITA are strongly contribute to the southern region. The ratios IEXPRIER, CDRATIO, PCTOTA, and OINCTTIN strongly contribute to the western region and for north-eastern region it was DEBTRAT, COF, TLTOTA, SATOTA, OPTOTA, OETOTA and IETOTA. Even though the variable IITOTA and DEBTRAT fall in dimension 2 it does not contribute much for the western region banks. From fisher linear discriminant and perpetual map it was observed that financial ratios TRDTOTD and NIITITA strongly contribute to the southern region, OINCTTIN, IEXPIEAR, PCTOTA and CDRATIO to western region and for north-eastern region financial ratios, COF, TLTOTA, OPTOTA, DEBTRAT and SATOTA.
REFERENCES
Ali, H.F. and Charbaji, A. 1994. Applying Factor Analysis to
Financial Ratios of International Commercial Airlines.
International Journal of Commerce and Management, 4(1/2):
25-37.
Ali, H.F., Charbaji, A. and Tomeh, N. 1995. Applying Factor, Cluster, and Multidiscriminant Analysis for Classifying Firms Based on their Financial Ratios: An Application to the Gulf Bank. Advances
in Quantitative Analysis of Finance and Accounting, 3(B): 21-32.
[image:5.595.39.289.413.575.2]Aho,T. 1980. Emperical classification of financial ratios. Management Science in Finland (MASC’ 80) proceedings, pp 413 – 421. Beaver, W.H. 1966. Financial Ratios as Predictors of Failure. Journal
of Accounting Research, 4(3): 71-111.
Bendell, T., Boulter, L. and Kelly, J. 1998. Benchmarking for Competitive Advantage. Pitman Publishing, London.
Bourke, P. 1989. Concentration and other Determinants of Bank Profitability in Europe, North America and Australia. Journal of
Banking and Finance, 13: 65-79.
Charbaji, A. 2001. Developing a Model to Restructure the Overpopulated Banking Industry in Lebanon. Managerial
Auditing Journal, 16(1): 28-35.
Cheng, F.F. and Ariff, M. 2007. Abnormal Returns of Bank Stocks and their Factor- analyzed determinants. Journal of Accounting,
Business and Management, 14: 1-16.
Chen, Kung, H., Shimerda and Thomas, A. 1981. An Empirical analysis of useful financial ratios. Financial Management, pp 51-60.
Courtis, J. 1978. Modelling a financial ratios Categorie framework.
Journal of Business Finance and Accounting, 5(4): 371 – 386.
Cowen, Scott, S., Hoffer, and Jeffrey, A. 1982. Usefulness of Financial Ratios in a Single Industry. Journal of Business
Research, 10(1): 103-118.
De, A., Bandyopadhyay, G. and Chakraborty, B.N. 2010. Application of Factor Analysis on the Financial Ratios of the Iron and Steel Industry of India and Validation and Improvement of the Results by the Cluster Analysis”, International Conference on Computing Business Applications and Legal Issues (ICCBALI) Conference Proceedings, Excel Books, New Delhi, pp 142-164.
De, A., Bandyopadhyay, G. and Chakraborty, B.N. 2011. Application of the Factor Analysis on the Financial Ratios and Validation of the Results by the Cluster Analysis: An Empirical Study on the Indian Cement Industry. Journal of Business Studies, 2(3): 13-31. Ezzamel, Mahmoud, Brodie, J. and Mar-Molinero, C. 1987. Financial
Patterns of UK Manufacturing Companies. Journal of Business
Finance and Accounting, 14(4): 519-536.
Green, D.1978. To Predict Failure, Management Accounting pp.39-45 Jaba, E., Grama, A. and Analiza. 2004. Statistica cu SPSS sub
Windows, Polirom, Iasi.
Johnson, W. 1979. The cross- sectional stability of financial patterns.
Journal of business Finance and Accounting, 5(2): 207 – 214.
Laitinen, E. 1983. A multivariate model of the financial relationship in the firm. The Finnish Journal of Business Economics, 4: 3117 – 333.
Laurent, C.R. 1979. Improving the Efficiency and Effectiveness of Financial Ratio Analysis. Journal of Business Finance and
Accounting Volume, 6(3): 401-413.
Muresan, E.R. and Wolitzer, P. 2004. Organize Your Financial Ratios Analysis with PALMS. http://papers.ssrn.com/ retrieved on 11/07/2010.
Timm, N.H. 2011.Applied Multivariate Analysis, Springer,New York. Johnson, R.A. and Wichern, D.W. 2008. Applied Multivariate
Statistical Analysis, 6/E, Pearson Publications, New York. Ocal, M.E., Oral, E.L., Erdis, E. and Vural, G. 2007. Industry
Financial Ratios- Application of Factor Analysis in Turkish Construction Industry. Building and Environment, 42(1): 385-392. Ohlson, J.A. 1980. Financial Ratios and the Probabilistic Prediction of
Bankruptcy. Journal of Accounting Research, 18(1): 109-131. Pinches, G.E., Mingo, K.A. and Caruthers, J.K. 1973. The stability of
financial patterns in industrial organizations. Journal of Finance, 389 – 396.
Shih, V., Zhang, Q. and Liu, M. 2007. Comparing the Performance of Chinese Banks: A Principal Component Approach. China
Economic Review, 18(1): 15-34.
Yeh, Q.J. 1996. The Application of Data Envelopment Analysis in Conjunction with Financial Ratios for Bank Performance Evaluation. Journal of the Operational Research Society, 47(8): 980-988.
Yli-Olli, Paavo, Virtanen and Ilkka. 1985. On the Long-term Stability and Cross-country Invariance of Financial Ratio Patterns.
European Journal of Operational Research, 39(1): 40-53.
Zopounidis, C., Despotis, D.K. and Stavropoulou, E. 1995. Multiattribute evaluation of Greek Banking Performance. Applied
Stochastic Models and Data Analysis, 11(1): 97-107.
Appendix – A List of Financial Ratios and their Code
Ratio code Financial ratio name
NIITITA Net Interest Income (Spread) to Total Asset Ratio IETOTA Interest Expended to Total Asset Ratio
COF Cost of Funds
DEBTRAT Debt Ratio
OPTOTA Operating Profits to Total Asset Ratio IITOTA Interest Income to Total Asset Ratio OINCTTIN Other Income to Total Income Ratio NIITOTA Non-interest Income to Total Asset Ratio OETOTA Operating Expenses to Total Asset Ratio CDRATIO Credit to Deposit Ratio
PCTOTA Provisions and Contingencies to Total Asset Ratio TRDTOTD Term Deposits to Total Deposit Ratio
SATOTA Secured Advances to Total Advance Ratio TLTOTA Term Loans to Total Advance Ratio IEXPIEAR Interest Expended to Interest Earned Ratio
DEB Debt - Equity Ratio
BTOTA Burden to Total Asset Ratio BTOII Burden to Interest Income Ratio
LIQRAT Liquidity Ratio