RESEARCH ARTICLE
COMPARATIVE STUDY OF PHYSICO-CHEMICAL PARAMETERS TO EVALUATE THE POLLUTION
LEVEL OF NIZAMSAGAR CANAL, NIZAMABAD DISTRICT, INDIA
A. Sunil Kumar1,3,4, A.A. Haleem Khan2, C. Rajendra Sagar1, P. Ravishankar3, A. Venkata Rajashekar4
1 Department of Zoology, G.G.College, Nizamabad 2 Department of Microbiology, G.G.College, Nizamabad
3 Department of Zoology, University College of Sciences, Osmania University, Hyderabad 4 Department of Zoology, Nizam College, Hyderabad
ARTICLE INFO ABSTRACT
The physico-chemical parameters of water samples from four locations of Nizamsagar irrigation canal that surrounds the Nizamabad city were comparatively studied. The sampling locations were selected on the basis of their possibility of pollution points. The physico-chemical parameter like, pH, dissolved oxygen (DO), total hardness (TH), calcium (Ca++) magnesium (Mg++),
chloride (Cl-), nitrite (NO2-), nitrate (NO3-), carbonates (CO3-), Bicarbonates (HCO3-) and
phosphate (PO4-) of water samples was determined. The results were compared with standards
prescribed by WHO (1973) and ISI (10500-91). The present study indicates that the location I and III were more polluted. The different parameters values in these two locations were very high compared to the other locations under study.
Copy Right, IJCR, 2011, Academic Journals. All rights reserved
INTRODUCTION
Water is an essential factor for existence of life on earth that contains minerals, important for humans as well as for terrestrial and aquatic life (Agarwal and Manish, 2011). Lakes and surface water reservoirs are the planets freshwater resources that provide infinite benefits. They are used for domestic and irrigation purposes and provide ecosystems for aquatic life especially fish (Duran, 2006). Water bodies are considerable elements of the world’s biological diversity and are important in socio-economic benefit as a result of tourism and recreation. However, the significant increase in population resulted in a substantial consumption of the water reserves globally (Fafioye et al., 2005). The quality of surface water is largely affected by natural processes such as weathering and soil erosion, in addition to anthropogenic discharges like municipal and industrial wastewater discharge (Gopalkrushna, 2011). The anthropogenic discharges symbolize a steady polluting source, while surface runoff is a seasonal occurrence, mainly affected by climatic conditions (Hiware and Jadhav, 2001). There is a serious environmental crisis been faced in under developing and developed countries (Murthuzasab et al., 2010). Contamination of aquatic ecosystems with heavy metals is a serious trouble, all over the globe (Ohimain et al., 2008). One among the Nizamsagar
*Corresponding author: sunil_kumarma@yahoo.com
irrigation canals that reaches the district head quarter was studied for the physico-chemical parameters such as pH, dissolved oxygen (DO), total hardness (TH), calcium (Ca++) magnesium (Mg++), chloride (Cl-), nitrite (NO2-), nitrate
(NO3), carbonates (CO3-), Bicarbonates (HCO3-) and
phosphate (PO4
-).
Study area
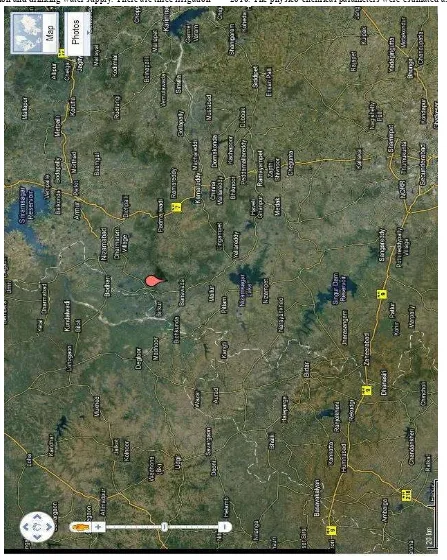
Nizamabad is located at 18°40′38″N 78°6′11″E18.67722°N 78.10306°E. It has an average elevation of 395 m (1,296 ft). Climate is Tropical Wet and Dry with most rainfall from June to October. Nizamabad district is the head quarter of 36 mandals surrounded by two states like Karnataka and Maharashtra, both in the west. This district receives water from the tributaries of river Godavari such as Manjira, Haridra and there are a few multipurpose projects like Nizamsagar, Sri Ramsagar and Singur. Nizamsagar project is constructed on the Manjira, a tributary of river Godavari (Fig 1). The Nizamsagar dam was constructed in the year 1923 across the Manjira River at the village of (Achampeta) Achampet. It irrigates 250,000 acres (1,000 km2; 390 sq mi) of land in Nizamabad district. This Project was originally contemplated for utilization of 58.00 TMC of water to irrigate 2, 75,000 acres in Banswada, Bodhan, Nizamabad and Armoor Taluqs
ISSN: 0975-833X
Available online at http://www.journalcra.com
International Journal of Current Research
Vol. 3, Issue, 11, pp.019-023, October, 2011
INTERNATIONAL JOURNAL OF CURRENT RESEARCH
Article History:
Received 26th
July, 2011 Received in revised form 29th August, 2011
Accepted 19th September, 2011 Published online 15th
October, 2011
Key words:
pH, dissolved oxygen (DO), total hardness (TH), calcium (Ca++
) magnesium (Mg++
), chloride (Cl
-), nitrite (NO2-), nitrate (NO3-),
carbonates (CO3-), Bicarbonates (HCO3-),
of Nizamabad District. This project is main source of irrigation and drinking water supply. There are three irrigation
canals of this project that flow throughout the seven mandals of the Nizamabad district.
MATERIALS AND METHODS
Samples were collected from four locations for six times in a year according to three major seasons. In India, seasons are summer (May-Jun), rainy (Aug-Sept) and winter (Nov-Dec).
The present study was conducted from Jan 2008 to December 2010. The physico-chemical parameters were estimated as per
[image:2.612.84.531.68.628.2]the Standard Methods (APHA, 1998). Water samples were collected for the purpose of estimation of various parameters were brought to the laboratory and subjected to analysis immediately as far as possible. Standard Methods for Estimation of Water and Wastewater 20th edition, 1998 were referred for estimation of parameters such as pH, dissolved oxygen (DO), total hardness (TH), calcium (Ca++) magnesium
Fig. 1: Flow map of Nizamsagar canal
(Mg++), chloride (Cl-), nitrite (NO2
-), nitrate (NO3
-), carbonates (CO3
-), Bicarbonates (HCO3
) and phosphate (PO4
-).
RESULTS AND DISCUSSION
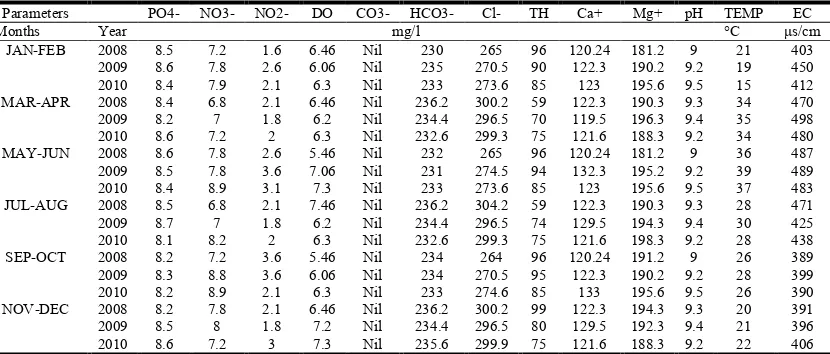
The physico-chemical parameters for location-I, II, III and IV in the different months (2008-2010) are given in the Tables 1, 2, 3 and 4.
Phosphates
[image:3.612.83.529.179.367.2]The Phosphate content of water samples were found in the range of 6 to 9 mg/L in location I, 3 to 8.5 mg/L in location II, 8.1 to 8.6 mg/L in location III and 6.4 to 7.9 mg/L in location IV. Phosphates lead to eutrophication which could also lead to
Table: 1 Physico-chemical parameters: location-I
Parameters PO4- NO3- NO2- DO CO3- HCO3- Cl- TH Ca+ Mg+ pH TEMP EC
Months Year mg/l °C μs/cm
JAN-FEB 2008 7.3 12.1 0.8 3.6 Nil 230 163 470 104 138.5 8 21 780
2009 7 12.3 0.9 3.6 Nil 235 165 465 103 140.6 9 19 798
2010 7.4 12.2 0.1 3.6 Nil 233 167 472 105 141.4 9 15 750
MAR-APR 2008 7.3 12 1 3.2 Nil 200 150 370 110 138.5 9 34 740
2009 8.5 12.3 0.9 3.6 Nil 235 165 465 103 140.6 9 35 780 2010 7.4 12.2 0.1 3.6 Nil 233 167 472 105 141.4 9 34 774
MAY-JUN 2008 8.5 12.1 2 4.6 Nil 280 170 500 110 146.5 6 36 775
2009 9 13.2 2.5 5 Nil 285 172 490 109 150.6 6 39 770
2010 8.9 12.2 2.8 4.5 Nil 283 170 492 111 149.4 6 37 650
JUL-AUG 2008 6.3 10.1 0.6 2.9 Nil 190 156 356 99 120.4 8 28 665
2009 6 11.3 0.7 3.3 Nil 200 158 350 98 130.6 9 30 775
2010 6.4 10.9 0.6 3 Nil 211 160 360 101 125.4 9 28 780
SEP-OCT 2008 7.3 12.1 0.8 3.6 Nil 230 163 470 104 138.5 8 26 790
2009 7 12.3 0.9 3.6 Nil 235 165 465 103 140.6 9 28 800
2010 7.4 12.2 0.1 3.6 Nil 233 167 472 105 141.4 9 26 890
NOV-DEC 2008 8.3 12.4 0.8 3.5 Nil 230 162 472 106 138.5 8 20 773
2009 7.9 12.6 1 3.6 Nil 238 164 468 108 140.6 9 21 779
[image:3.612.83.530.394.580.2]2010 8 12.8 0.9 3.6 Nil 235 166 470 106 141.4 9 22 790
Table 2. Physico-chemical parameters: location-II
Parameters PO4- NO3- NO2- DO CO3- HCO3- Cl- TH Ca+ Mg+ pH TEMP EC
Months year mg/l °C μs/cm
JAN-FEB 2008 3.3 14.4 6 2.02 Nil 260 177.5 60 120.24 193.83 6.5 21 501
2009 4.2 15 8 2.9 Nil 268 180 90 125.25 200 6.9 19 499
2010 4 14.8 7 2.5 Nil 270 178.5 100 122.5 196.44 6.2 15 485
MAR-APR 2008 7.9 13.7 4 2 Nil 220 165.5 100 120.9 199.9 6 34 492
2009 7.2 14 6 2.5 Nil 215 168.7 109 125.6 220 6.2 35 490
2010 7.4 13.8 4.9 2 Nil 223 167.9 106 122.9 215 6.5 34 492
MAY-JUN 2008 8.5 15.6 8 2.9 Nil 250 177 120 126.5 233.6 6.1 36 472
2009 8.4 15.7 9 3.1 Nil 260 176 115 128.6 240.5 6.4 39 490
2010 7.9 15 8.5 3.2 Nil 255 172 118 127 238.6 6.2 37 503
JUL-AUG 2008 3.3 14.4 6 2.02 Nil 260 177.5 60 120.24 193.83 6.5 28 550
2009 4.2 15 8 2.9 Nil 268 180 90 125.25 200 6.9 30 560
2010 4 14.8 7 2.5 Nil 270 178.5 100 122.5 196.44 6.2 28 557 SEP-OCT 2008 3.8 14.8 6.5 3.2 Nil 268 179.6 80 122.6 196 6.8 26 559 2009 4.7 15.5 8.5 3.9 Nil 270 182.3 100 127.8 208.22 6.7 28 556 2010 4.9 15.2 7.7 3.7 Nil 272 180.3 115 125.4 199.7 6.2 26 563
NOV-DEC 2008 3 14 6.2 2.5 Nil 255 170.5 86 120 190.83 6.5 20 589
2009 4 14.5 7.8 2.6 Nil 260 178 93 125 196 6.9 21 598
2010 3.7 14.8 6.9 2.9 Nil 268 174.5 105 122 198.44 6.2 22 596
Table 3. Physico-chemical parameters: location-III
Parameters PO4- NO3- NO2- DO CO3- HCO3- Cl- TH Ca+ Mg+ pH TEMP EC
Months Year mg/l °C μs/cm
JAN-FEB 2008 8.5 7.2 1.6 6.46 Nil 230 265 96 120.24 181.2 9 21 403 2009 8.6 7.8 2.6 6.06 Nil 235 270.5 90 122.3 190.2 9.2 19 450 2010 8.4 7.9 2.1 6.3 Nil 233 273.6 85 123 195.6 9.5 15 412 MAR-APR 2008 8.4 6.8 2.1 6.46 Nil 236.2 300.2 59 122.3 190.3 9.3 34 470 2009 8.2 7 1.8 6.2 Nil 234.4 296.5 70 119.5 196.3 9.4 35 498 2010 8.6 7.2 2 6.3 Nil 232.6 299.3 75 121.6 188.3 9.2 34 480 MAY-JUN 2008 8.6 7.8 2.6 5.46 Nil 232 265 96 120.24 181.2 9 36 487 2009 8.5 7.8 3.6 7.06 Nil 231 274.5 94 132.3 195.2 9.2 39 489 2010 8.4 8.9 3.1 7.3 Nil 233 273.6 85 123 195.6 9.5 37 483 JUL-AUG 2008 8.5 6.8 2.1 7.46 Nil 236.2 304.2 59 122.3 190.3 9.3 28 471 2009 8.7 7 1.8 6.2 Nil 234.4 296.5 74 129.5 194.3 9.4 30 425 2010 8.1 8.2 2 6.3 Nil 232.6 299.3 75 121.6 198.3 9.2 28 438 SEP-OCT 2008 8.2 7.2 3.6 5.46 Nil 234 264 96 120.24 191.2 9 26 389 2009 8.3 8.8 3.6 6.06 Nil 234 270.5 95 122.3 190.2 9.2 28 399 2010 8.2 8.9 2.1 6.3 Nil 233 274.6 85 133 195.6 9.5 26 390 NOV-DEC 2008 8.2 7.8 2.1 6.46 Nil 236.2 300.2 99 122.3 194.3 9.3 20 391 2009 8.5 8 1.8 7.2 Nil 234.4 296.5 80 129.5 192.3 9.4 21 396 2010 8.6 7.2 3 7.3 Nil 235.6 299.9 75 121.6 188.3 9.2 22 406
[image:3.612.98.513.603.780.2]unpleasant taste and odour of the water. The high concentration of Phosphate after rainy season is due to discharge of Phosphate fertilizer.
Nitrates and Nitrites
The results of the Nitrate from 10.1 to 13.2 mg/L in location I, 13.7 to 15.7 mg/L in location II, 6.8 to 8.9 mg/L in location III and 3.7 to 5 mg/L in location IV. The Nitrite concentration in the water were 0.6 to 2.8 mg/L in location I, 4 to 9 mg/L in location II, 1.6 to 3.6 mg/L in location III and 0.4 to 0.9mg/L in location IV. This may be characteristic of the oxidation of ammonia by nitrifying bacteria and biological nitrification (Pawar et al., 2009). The nitrate concentration could be due to surface run-off of nitro phosphate fertilizer from nearby farmlands into the water.
DO
DO is one of the significant parameter in water quality evaluation. It reproduces the physical and biological processes existing in the water. Non polluted surface water is normally saturated with DO. The DO varies from 2.93 to 5 mg/L in location I, 2 to 3.9 mg/L in location II, 6.2 to 7.4 mg/L in location III and 2 to 3.02 mg/L in location IV. These values indicate relatively large organic pollution. The high temperature and low DO create favorable conditions for growth of blue-green algae (Pradhan et al., 2009).
Alkalinity (Carbonates and Bicarbonates)
Carbonates were not found in the locations during the period of study. Bicarbonates ranges from 190 to 285 mg/L in location I, 215 to 272 mg/L in location II, 230 to 236.2 mg/L in location III and 240 to 265 mg/L in location IV. Bicarbonates values were lower in location I in the months of Jul-Aug, and higher in the months of May-Jun. The Bicarbonates values were lower in location II in the months of Mar-Apr and higher in the months of Sept-Oct. The Bicarbonates values were lower in location III in the months of Jan-Feb, and higher in the months of Mar-Apr, Jul-Aug and Nov-Dec. the Bicarbonates values were lower in location IV
in the months of Jan-Feb and higher in the months of Nov-Dec.
Chloride
Chlorides are found in almost all the natural waters. This is most frequent inorganic anion present in water. Man and animals excrete high quantities of chlorides as a result it signifies sewage contamination. In our study the chloride value ranges from 156.3 to 169.5 mg/L in location I, 165.5 to 183.3 mg/L in location II, 265 to 300.2 mg/L in location III and 150 to 168.9 mg/L in location IV.
Total hardness
In most of the water samples from the studied locations TH is imparted majority by the calcium and magnesium ions that apart from Chloride, Nitrites and Nitrates are found in combination with bicarbonates. In our study of Total hardness we found 356 to 500 mg/L in location I, 60 to 118 mg/L in location II, 59 to 99 mg/L in location III and 400 to 494 mg/L in location IV. These results suggest that the water is very hard.
pH
The PH ranges from 6.0 to 9.3 in location I, 6.0 to 6.9 in location II, 9.0 to 9.5 in location III and 6.9 to 7.0 in location IV. In general the pH values were lower in location I in the months of May-Jun and higher in the months of Jan-Feb, Mar-Apr, Jul-Aug, Sept-Oct and Nov-Dec. in most of the months in the year the location I water was found to alkaline. The pH values were lower in location II in the months of Mar-Apr and higher in the months of Jan-Feb, Jul-Aug and Nov-Dec. The pH values were higher in location III in the months of Jan-Feb, May-Jun, and Sept-Oct. the pH values were lower in location IV in the months of Jul-Aug and higher in the months of Jan-Feb. The fluctuation in the pH values may due to the exposure of water to atmosphere, biological activities and temperature changes. (Arain et al., 2008).
[image:4.612.93.522.105.293.2]Temperature & Electrical conductivity
Table 4. Physico-Chemical Parameters: Location-IV
Parameters
PO4- NO3- NO2- DO CO3- HCO3- Cl- TH Ca+ Mg+ pH TEMP EC
Months year mg/l °C μs/cm
JAN-FEB 2008 7.5 4.4 0.6 2.02 Nil 240 157.5 460 112.24 336.23 7.5 21 280 2009 6.8 5 0.8 2.09 Nil 248 158 490 115.25 300 7.9 19 275 2010 7 4.8 0.7 2.05 Nil 247 158.5 400 120.5 360.44 7.2 15 260 MAR-APR 2008 6.9 3.7 0.4 2.07 Nil 250 155.5 400 120.9 339.9 7 34 255 2009 6.7 4 0.6 2.05 Nil 255 158.7 409 120.6 340 7.2 35 265 2010 6.4 3.8 0.9 2 Nil 253 160.9 406 120.9 325 7.5 34 263 MAY-JUN 2008 6.5 4.6 0.8 2.09 Nil 250 150 400 110.9 329.9 7 36 302 2009 6.4 4.7 0.9 3.01 Nil 260 156 409 115.6 320 7.2 39 300
2010 6.9 5 0.5 3.02 Nil 255 152 406 112.9 315 7.5 37 360
JUL-AUG 2008 6.5 4.8 0.6 2.09 Nil 250 157.5 461 113.24 330.23 7.2 28 366 2009 6.6 5.2 0.8 2.07 Nil 245 158 494 125.25 320 6.9 30 352 2010 7.8 5.8 0.7 2.04 Nil 249 156.5 460 123.5 330.44 7.8 28 320 SEP-OCT 2008 7.9 4.7 0.4 2.05 Nil 259 157.5 409 127.9 329.9 7 26 330 2009 7.7 4.5 0.6 2 Nil 250 158.7 404 123.6 320 7.4 28 336 2010 7.4 4.8 0.9 2.03 Nil 259 168.9 403 123.9 315 7.6 26 339 NOV-DEC 2008 6.9 4.6 0.8 2.05 Nil 258 154 404 120.9 319.9 7 20 321 2009 6.7 4.7 0.9 2.01 Nil 266 152 401 135.6 323 7.2 21 356
2010 6.4 5 0.5 2.02 Nil 265 151 408 122.9 325 7.3 22 324
Temperature is important parameter that influences on certain chemical and biological activities in the organisms attributing in aquatic environment. Temperatures ranges from 15 to 39°C in location I, 20 to 39°C in location II, 19 to 39°C in location III and IV. The difference is mainly related with the temperature of atmosphere and weather conditions.In present study the EC varies from ranges from 650 to 890μs/cm in location I, 472 to 598μs/cm in location II, 389 to 498μs/cm in location III and 255 to 366μs/cm in location IV. High EC signifies a large quantity of dissolved minerals. The present study indicates that the location I and III were more polluted. The different parameters values in these two locations were very high compared to the other locations under study. Water quality monitoring has a high priority for the determination of current conditions and long-term trends for effective management. The supply of safe water has a significant impact on the anticipation of water transmissible diseases (Prasanna and Chitta Ranjan 2010; Vasanthkumar and Vijaykumar, 2011). The abundance of organic compounds, radionuclide’s, toxic chemicals, nitrites and nitrates in water may cause unfavorable effects on the human health especially cancer, other human body malfunctions and chronic illnesses (Sultan and Sharief, 2004).
Acknowledgements
We express deep gratitude to Prof. Sree Ram Kumar, HOD, Prof. Masood Hussain, Dept of Zoology, Osmania University, Hyderabad and Smt. Moriah Eunice, Principal, Girraj Govt. College, Nizamabad for their constant inspiration and encouragement.
REFERENCES
Arain, M. B., Kazi, T. G., Jamali, M. K., Afridi, H. I., Jameel Ahmad Baig, Jalbani, N., and Shah, A. Q. 2008. Evaluation of Physico-chemical Parameters of Manchar Lake Water and Their Comparison with Other Global Published Values. Pak. J. Anal. Environ. Chem. 9(2): 101 – 109.
APHA. 1998. Standard method for the examination of water and waste water, APHA AWWA, WPET Washington D. C., USA, 18th edition.
Agarwal, A. and Manish Saxena, M. 2011. Assessment of pollution by Physicochemical Water Parameters Using Regression Analysis: A Case Study of Gagan River at Moradabad- India. Advances in Applied Science Research. 2(2): 185 -189.
Duran. M. 2006. Monitoring Water Quality Using Benthic Macroinvertebrates and Physicochemical Parameters of Behzat Stream in Turkey. Polish J. of Environ. Stud.,
15(5):709-717.
Fafioye, O. O., Olurin, K. B., and Sowunmi, A. A. 2005. Studies on the physico-chemical parameters of Omi water
body of Ago-Iwoye, Nigeria. African Journal of
Biotechnology, 4(9): 1022-1024.
Gopalkrushna, H. M. 2011. Assessment of Physico-Chemical Status of Ground Water Samples in Akot city. Research Journal of Chemical Sciences, 1(4): 117-124.
Hiware, C. J., and Jadhav, B. V. 2001. Biological studies of Manjara River near Kallam, district Osmanabad, Maharashtra, India, J. Aqua. Biol., 16(2): 11-13.
Murthuzasab, M. R., Rajashekhar, M ., Vijaykumar ,K. and Haliked, N.S. 2010. Seasonal variation in physico-chemical parameters of Hirahalla reservoir, Koppal District Karnataka. International Journal of Systems Biology, 2(2): 16-20.
Ohimain, E. I., Imoobe, T. O., and Bawo, D. D.S. 2008. Changes in Water Physico-Chemical Properties Following the Dredging of an Oil Well Access Canal in the Niger Delta. World Journal of Agricultural Sciences, 4 (6): 752-758.
Pradhan, U. K., Shirodkar, P. V. and Sahu. B. K. 2009. Physico-chemical characteristics of the coastal water off Devi estuary, Orissa and evaluation of its seasonal changes using chemometric techniques. CURRENT SCIENCE. 96 (9): 1203-1209.
Pawar, S. K., Pulle, J. S., Shendge, K. M., Pentewar, M. S. and Itkapalle, A. P. 2009. Physico-chemical studies of Panshewadi dam water in Kandahar taluka district Nanded
(M.S.) India. Shodh, Samiksha aur Mulyankan
(International Research Journal). II(6): 1-2.
Prasanna, M. B. and Chitta Ranjan, C. 2010. Physico chemical properties of water collected from Dhamra estuary. International Journal of Environmental Sciences. 1(3): 334-342.
Sultan, M. and Sharief, D. 2004. Water pollution studies in the double lake (Erretal eri) with relation to Phytoplankton. J. Aqua. Biol., 1: 15-18.
Vasanthkumar, B. and K. Vijaykumar, K. 2011. Diurnal variation of physico chemical properties and primary productivity of phytoplankton in bheema river. Recent Research in Science and Technology, 3(4): 39-42.