http://dx.doi.org/10.4236/jdm.2012.23046
Self monitoring of blood glucose and its association
with glycaemic control and lipid levels in type 2
diabetic patients aged 40 - 75 in Trinidad and Tobago
B. Shivananda Nayak*, Khateija Gowrie, Renelle Romano, Carl Spencer, Domonique Noel, Hellen Bissoon, Ikageng Dipatene, Nadia Mahabir, Rissa Ragbir, Shalane Xavier
Department of Preclinical Sciences, Faculty of Medical Sciences, The University of the West Indies, St. Augustine, Trinidad and Tobago; *Corresponding Author: Shivananda.Nayak@sta.uwi.edu
Received 13 May 2012; revised 14 June 2012; accepted 25 June 2012
ABSTRACT
This study was done to assess whether self monitoring of blood glucose is associated with better glycaemic control in type 2 diabetic Trini- dadians. Data was collected from 146 type 2 diabetics via interviews and medical files. Vari- ables extracted included fasting blood glucose, HbA1c and lipid profile. Recent users of the glu- cometer had better glycemic control compared with longstanding users (HbA1c: 8.4% ± 0.28% vs 9.4% ± 0.62%). Diabetics using a glucometer for >11 years had the highest cholesterol (234 ± 27 mg/dL) while those using it 6 months to 5 yrs had the lowest values (206 ± 8 mg/dL). Using the glucometer occasionally or once a week had little impact on these indices. Usage of insulin preparation was positively correlated with HbA1c (r = 0.295; p = 0.001) while those relying on oral hypoglycaemic agents showed a negative cor- relation (r = −0.265). Further, those who took their medication as prescribed had a lower HbA1c than those who took their medication occasion- ally. Ironically, HbA1c fell with increasing dura- tion between clinic visits with those visiting annually having the lowest HbA1c (9.0% ± 0.2% vs 7.1% ± 0.7%). Compliance with lifestyle and exercise resulted in lower HbA1c and blood lip- ids. Poor client education on glucometer usage, administration of insulin and non-compliance with diet and exercise were associated with higher HbA1c.
Keywords:Glucometer; Blood Glucose; Glycemic Control; Lipid Profile
1. INTRODUCTION
Diabetes mellitus is a metabolic disorder characterized
by hyperglycemia [1]. The hyperglycemia is caused by defective pancreatic insulin production, action or both and results in abnormal carbohydrate, protein and fat metabolism.Type 2 diabetes is caused by a combination of peripheral resistance to insulin action and a decreased response by the β cells of pancreas. Research has shown that obesity and inadequate physical activity are the main causes for type 2 diabetes [2].
Glycaemic control is a medical term referring to the typical levels of blood sugar in a person with diabetes mellitus. Many researchers shown that the microvascular complications and other long term effects of diabetes result from long term hyperglycaemia [2]. The percent- age of hemoglobin which is glycosylated is used as a measure of long-term glycaemic control in the clinical care of people with diabetes. The original Leuven trial demonstrated that proper implementation of glycaemic control can reduce morbidity and mortality [3]. More recent studies have shown that there is a cost-benefit to glycaemic control as well, through reduction of hospital stay and prevention of complications [4].
A lipid profile comprises the measurement of choles- terol, triglycerides, and high-density lipoproteins. Age, sex, and genetics influence lipid profile status of an indi- vidual. Lifestyle, diet, level of physical activity, level of diabetes control, and smoking status, also affect lipid profile. Some medical conditions of the subjects can in- crease or reduce cholesterol and triglyceride levels [5].
generally similar to those found in the general population [6].
The glucometer is an at-home blood sugar monitoring device. This process is also known as self monitoring of blood glucose (SMBG). Patients suffering from diabetes are able to be provided with instant feedback on the blood sugar level. Even doctors practice using it in their offices instead of taking venous blood. The device is small and easily portable. Trinidad and Tobago has a population of 1,317,714 [7]. Among this population, an estimated 175,000 persons are affected with diabetes [8]. Diabetes mellitus is the second cause of death in Trinidad and Tobago, surpassed by cardiovascular diseases [7]. In Trinidad and Tobago, one in eight persons over the age of 35 is diabetic [9]. Trinidad and Tobago has the most persons affected with diabetes in the Western Hemi- sphere and a one in four hospital admission is due to diabetes [9]. Diabetes mellitus can result in many com- plications. In our country, heart disease and stroke ac- count for 65% of deaths in people with diabetes, 73% of adults with diabetes have hypertension; diabetes is the leading cause of blindness among adults aged 20 - 74 years and the leading cause of kidney failure [9].
Diabetes mellitus, though a serious medical condition, has been shown to be manageable. However, these astound- ing statistics may indicate a problem with the monitoring and managing of the disease in Trinidad and Tobago. With this project, we wish to provide documentation and gain insight into self monitoring and compliance of pa- tients living with diabetes.
2. SUBJECTS AND METHODS
This retrospective case control investigation is de- signed to determine if there is a link between SMBG and better glycaemic control in Trinidadian type 2 diabetic subjects aged 40 - 75. We also determined whether gly- caemic control via the glucometer helps in maintaining a normal lipid profile.
Data for this study was gathered from approximately 146 subjects via a face to face interview using a prepared questionnaire and also by gathering data from their per-sonal medical files. Members of the general public at-tending the Diabetic clinics at the Eric Williams Medical Sciences Complex and San Fernando General Hospital were randomly selected for this study. Study included type 2 diabetics aged 40 - 75 of all ethnicities who prac- ticed self-monitoring via the glucometer for more than six (6) months. We excluded persons who did not meet the above inclusion criteria along with pregnant women. Data recorded via the questionnaire were use of glu- cometer, duration of glucometer use, how often they use, Reasons for not using glucometer, when they check their blood glucose levels, type of exercise they do,
informa-tion of smoking and alcohol use and their diet. Data which were recorded from patient files includes the pa- tient’s age, sex, location, the length of time they have been a diabetic, the name of the clinic they attend, how often do they visit the clinic, the form of medication they are on, lipid profile, HbA1c, blood glucose levels and measurements of height and weight which were used to calculate the body mass index (BMI).
The data collection instrument utilized in this study was a questionnaire from which information from the subject was directly gathered and recorded. In addition information was also gathered from the patients’ medical records.
Using the prepared questionnaire type 2 diabetic pa- tients within the specified age group was targeted during the running of diabetic clinics at the institutions men- tioned above. Patients were informed that we are medical students conducting a study and we like to have their assistance in answering a short questionnaire from which all data gathered will be kept confidential. The names of the patients will not be taken in this study instead pa- tients were identified using their medical file numbers/ clinic numbers.
Once the data from the questionnaire was gathered we obtained the additional required information from the patients medical record file.
Statistical Analysis
All gathered data was then analyzed using the com- puter package SPSS version 14.0 for Windows.
3. RESULTS
The study was conducted using 146 type 2 diabetes mellitus patients who used the glucometer and attended the clinics at the Eric Williams Medical Science Com- plex (EWMSC) and San Fernando General Hospital (SFGH) in the Republic of Trinidad and Tobago. The Percentage of persons among the various age groups and sex that participated in the study is shown in Table 1. Averages of glycaemic status and lipid profile among subjects that attended EWMSC and SFGH is depicted in
Table 2. Population of 30.70% had good glycemic
Table 1. Percentage of persons among the various age groups and sex that participated in the study.
Age groups (yrs) Percentage (%)
<36 12.3
40 - 49 18.5
50 - 59 22.6
60 - 69 30.8
70 - 79 14.4
>80 1.4
Gender
Male 33.6
[image:3.595.58.284.321.456.2]Female 66.4
Table 2. Averages of glycaemic status and lipid profile among subjects that attended EWMSC and SFGH.
EWM SC (n = 34) (Mean ± SD)
SFGH (n = 112) (Mean ± SD)
Average HbA1c (%) 8.740 ± 0.4792 8.863 ± 0.2415
Average blood glucose (mg/dL) 147.30 ± 19.915 166.09 ± 10.120
Average cholesterol (mg/dL) 183.90 ± 12.394 218.76 ± 7.618
Average triglycerides (mg/dL) 107.10 ± 17.686 229.54 ± 19.680
Average HDL (mg/dL) 49.08 ± 5.752 45.07 ± 2.444
Average cholesterol: average
HDL ratio 4.030 ± 0.4626 5.253 ± 0.2799
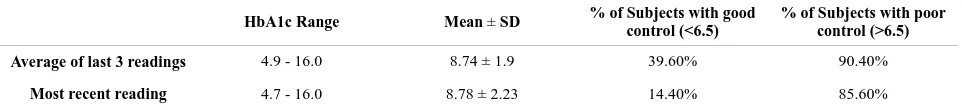
While 14% of the sample population showed good gly- cemic control when using their most recent HbA1c read- ing. Using Pearson’s correlation it was seen that there was a strong positive correlation between the average three HbA1c readings and the most recent one (0.798**, p = 0.01). Twenty six percent of the sample population had a general trend of improvement in glycemic control when their last three HbA1c values recorded were com-
pared to one another. On the other hand 74% of the sam- ple population showed an irregular or poor pattern of control when looking at trends in the three HbA1c values recorded. 61% of the sample population had good HDL values when using the average of their last three (3) HDL readings. While only 39% of the sample population showed bad HDL readings. Fifty seven percent of the sample population had good cholesterol readings when using the average of their last three (3) cholesterol read- ings. While 59.00% of the sample population showed good cholesterol readings when using their most recent cholesterol reading. Using Pearson’s Correlation it was seen that there was a strong positive correlation between the average three (3) cholesterol readings and the most recent one (0.858**, p = 0.01). Sample population of 67% had good average cholesterol to average HDL ratios when using the averages of their last three (3) readings. While 65.10% of the sample population showed good cholesterol to HDL ratios when using their most recent readings. Using Pearson’s Correlation it was seen that there was a medium positive correlation between the average cholesterol: average HDL ratios and the choles- terol: HDL ratios (0.443*, p = 0.05). Sample population of 48% had good triglyceride readings when using the average of their last three (3) readings. While 50% of the sample population showed good triglyceride readings when using their most recent triglyceride readings. Using Pearson’s Correlation it was seen that there was a strong positive correlation between the average three (3) tri- glyceride readings and the most recent one (0.901**, p = 0.01). In addition, there was a medium positive correla-tion between the average cholesterol readings and the average triglyceride readings (0.446*, p = 0.05). Length of glucometer usage, glycaemic status and lipid profile are shown in Table 5. The relationship of frequency of glucometer use and its relationship with HbA1c and lipid profile are shown in Table 6. The frequency of medica- tion use and clinic visits and their relationship with gly- caemic status and lipid profile are sown in Tables 7 and 8 respectively.
Table 3. Average and recent blood glucose readings.
Blood glucose range
(mg/dL) Mean ± SD (mg/dL)
% subjects with good control (<130 mg/dL)
% of subjects with poor control (>130 mg/dL)
Average of last 3 readings 45 - 400 155.71 ± 55.45 30.70% 68.40%
Most recent reading 38 - 400 155.93 ± 70.62 41.50% 58.50%
Table 4. Average of their last three (3) HbA1c readings.
HbA1c Range Mean ± SD % of Subjects with good control (<6.5)
% of Subjects with poor control (>6.5)
Average of last 3 readings 4.9 - 16.0 8.74 ± 1.9 39.60% 90.40%
[image:3.595.60.546.595.651.2] [image:3.595.58.539.681.736.2]Table 5. Length of glucometer usage, 6 months - 5 years, 6 years - 10 years and more than 11 years, and its relation to the averages of glycaemic status and lipid profile. (Data is expressed as Mean + SD).
Length of glucometer usage
6 mths - 5 yrs (n = 91) 6 yrs - 10 yrs (n = 31) >11 yrs (n = 24)
Average HbA1c (%) 8.450 ± 0.2759 9.414 ± 0.4239 9.350 ± 0.6208
Average Blood Glucose (mg/dL) 148.53 ± 125.5 178.86 ± 25.447 242.13 ± 35.188
Average Cholesterol (mg/dL) 206.47 ± 7.577 214.29 ± 14.915 234.38 ± 27.177
Average TG (mg/dL) 197.47 ± 17.438 231.07 ± 47.149 215.00 ± 64.288
Average HDL (mg/dL) 44.34 ± 2.352 45.71 ± 5.272 52.500 ± 8.858
[image:4.595.67.538.288.396.2]Average TC: HC ratio 4.909 ± 0.2392 5.371 ± 0.7196 4.838 ± 0.7386
Table 6. Relationship between the frequency of glucometer usage, more than once per day, once per day, 3 - 4 times a week and once a week and the average HbA1c, the most recent blood glucose reading and averages of cholesterol, triglycerides and HDL, and (Data is expressed as Mean + SD).
Frequency of use of glucometer
>Once/day (n = 70) Once/day (n = 36) 3 - 4 Times/week (n = 25) Once/week (n = 15)
Average HbA1c (g%) 9.219 ± 0.3 8.391 ± 0.48 8.244 ± 0.43 8.725 ± 1.37
Blood glucose (mg/dL) 173.37 ± 17.8 137.36 ± 20.3 177.56 ± 29.07 172.25 ± 42.6
Average cholesterol (mg/dL) 214.52 ± 11.25 178.36 ± 9.06 223.78 ± 21.02 228.00 ± 21.02
Average TG (mg/dL) 230.63 ± 25.8 115.00 ± 20.351 182.89 ± 28.643 244.75 ± 56.882
Average HDL (mg/dL) 44.04 ± 3.82 50.09 ± 5.443 47.22 ± 3.628 46.75 ± 4.589
Table 7. Frequency of medication use, sometimes and as prescribed and its relation to the averages of glycaemic status and lipid profile.
Frequency of medication use
Occasional (n = 12) As prescribed (n = 134)
Average HbA1c (%) 11.450 ± 0.650 8.744 ± 0.21
Average blood glucose (mg/dL) 267.50 ± 57.50 158.85 ± 8.74
Average cholesterol (mg/dL) 275.50 ± 39.50 210.20 ± 6.80
Average Triglycerides (mg/dL) 260.50 ± 75.50 205.72 ± 18.08
Average HDL (mg/dL) 36.00 ± 1.00 46.28 ± 2.31
Average TC: HC ratio 7.700 ± 1.30 4.961 ± 0.24
Data is expressed as (mean + SD).
Table 8. Frequency of clinic visits and the averages of glycaemic status and lipid profile.
Frequency of clinic visits
every 3 months (n = 120) every 4 months (n = 11) every 6 months (n = 10) once/yr (n = 2)
(Mean ± SD)
Average HbA1c (%) 8.993 ± 0.24 9.15 ± 0.55 7.62 ± 0.61 7.05 ± 0.65
Average blood glucose 161.59 ± 9.36 287.50 ± 112.50 137.75 ± 9.68 111.00 ± 7.0
Average cholesterol 218.80 ± 7.7 223.50 ± 1.5 178.50 ± 14.19 163.00 ± 27.0
Average Triglycerides 221.72 ± 20.13 228.50 ± 119.50 99.00 ± 19.98 118.50 ± 27.50
Average HDL 46.13 ± 2.69 48.50 ± 1.50 47.00 ± 4.02 41.50 ± 6.50
[image:4.595.61.539.435.556.2] [image:4.595.58.542.596.736.2]4. DISCUSSION
Our study explored relationships between use of the glucometer, medication, clinic visits, diet, exercise and social factors and glycemic control as reflected in aver-age HbA1c and averaver-age blood glucose. Our study also explored possible relationships between these factors and lipid profiles.
In this study, a possible link between duration of glu-cometer use and average HbA1c was examined. From the data collected, a total of 63% of the sample popula-tion had been using the glucometer for 6 months to 5 years, 21% had been using it for 6 - 10 years and 16.5% had been using it for more than 11 years. Recent users of the glucometer seem to have better control of their HbA1c than longstanding users. Further statistical analy-sis showed that use of a glucometer had a very low nega-tive correlation to average HbA1c while average blood glucose showed a low positive correlation. According to a study done by Rose [10], HbA1c levels correlate closely, though not perfectly with blood glucose levels in patients. One way ANOVA showed that the persons us-ing the glucometer for more than 11 years havus-ing had the highest average blood glucose levels while persons who were using it between 6 months to 10 years had the low-est values. This may be supported by the fact that newly diagnosed diabetics are exposed to educational programs unlike those of longstanding diabetic status.
There was a little difference or improvement for the frequent users of the glucometer compared to those who use it occasionally or once a week. The results found in a study by Harris [11], conclude that “Within diabetes therapy categories, the frequency of self-monitoring was not related to glycemic control, as measured by HbA1c level”. Our findings are in accordance with this study.
Findings showed a lower average HbA1c in patients who checked their glucose on mornings compared to values seen in patients who checked before meals, after meals and randomly. A similar trend was also seen with average HbA1c. This coincides with a recent study by Sikaris [12] who stated that “better glycaemic control is associated with fasting as well as continuous blood glu-cose monitoring, and it improves our ability to manage diabetic patients”.
Our findings showed a low positive correlation in re-cent HbA1c values (0.295; p = 0.001) and patients using insulin preparations. Schütt et al. [13], revealed that the type 2 diabetics treated with insulin (2.7 measurements/ day) and more frequent self monitoring of blood glucose (SMBG) was associated with better metabolic control. Our study contrasts with these findings, and this could be attributed to lack of patient knowledge on insulin ad-ministration or even a fear of using needles.
Persons relying on oral hypoglycemic agents show a
low significant negative correlation in their recent and average HbA1c levels when compared to their counter-parts on insulin preparation. Schütt et al. [13] also con-cluded that compared to patients on oral anti-diabetic medication or diet alone (2.0 measurements/day), more frequent blood glucose measurements were associated with higher HbA1c values (HbA1c increase of 0.14% for one additional SMBG/day, p < 0.0001). Our study again, contrasts with this, possibly owing to the fact that oral hypoglycemic agents are easier to self administer than insulin preparations thus compliance with this form of medication may have been better than compliance with insulin preparations.
There was no significance of HbA1c levels (0.062) with respect to persons using both insulin and oral hypo-glycemic medications (33%). This indicates an absence of glycemic control and improper management of blood sugar levels in these individuals. Cramer and Pugh[14] also identified this phenomenon in those patients on in-sulin and oral hypoglycemic agents. They had signifi-cantly higher HbA1c level than patient on insulin alone. They attributed the findings to disease progression in the patients or patient’s belief that the oral hypoglycemic agents will cover their insulin lapses.
With respect to the frequency with which patients took their medication, it was observed that those who took their medication as prescribed had a lower HbA1c than those who took their medication sometimes. A study done by Rhee et al. [15] has shown that those who had better medication adherence had a lower HbA1c with an average of 7.8%. They went on to conclude that taking medication as prescribed is directly related to an im-provement in HbA1c. Findings of our study concur with this study.
In assessing compliance with clinic visits, our study shows that the average HbA1c decreased with increasing duration between clinic visits. The study done by Rhee et
al. [15] also shows that those who kept their clinical ap-pointments had a lower HbA1c with the average HbA1c being 7.6%. They concluded that “keeping clinical ap-pointments is directly associated with lower HbA1c and that efforts to enhance glycemic control should include emphasis on these simple but critically important aspects of patient adherence”. Our results conflict with the find-ings of this study. A possible explanation may lay in bet-ter self management on the part of the patients who visit less frequently. Their less frequent visits are then attrib-uted to their confidence in controlling their condition.
(p < 0.05) between the two groups and average HbA1c values, and an independent Pearson’s correlation test showed a low positive correlation between patients fol-lowing a specific diet and the corresponding most recent HbA1c as well as average HbA1c. This trend of higher HbA1c values in patients following a specific diet con-trasted with recently published results from a short-term study by Halford et al. [16], which showed, “The aver-age HbA1c among intensively manaver-aged patients who reported that they followed specific diet-related behav-iours was 0.25 to 1.0 lower than among subjects who did not follow these behaviours.
The low positive correlation between exercise and av-erage HbA1c of our study contrasts with results found in the meta-analysis carried by Boulé et al. [17]. Discrep-ancies in our findings could be attributed to patients be-ing unaware of the intensity and frequency of physical activity that constitutes “exercise” therefore giving false affirmative that they undertook sufficient exercise as part of controlling their condition.
With respect to components of the lipid profile, our study found the low negative correlations between aver-age cholesterol, averaver-age triglycerides and exercise. This is in accordance with a study carried out by Chudyk et al. [18] which showed that exercise was related to a de-crease in triglycerides. A low positive correlation be-tween exercise and average HDL was also found. This complies with findings by Rönnemaa et al. [19] which showed that physical training significantly increased HDL. The study demonstrated the significance between the different group of users (p < 0.05) in that persons using glucometers for 11 years or more have the highest average cholesterol while those owning one between 6 months to 5 years had the lowest average cholesterol. This may be explained by a lack of motivation on the part of the patient, which comes with longstanding man-agement of any chronic disease, to monitor their diet.
From studies researched and general knowledge on diabetes, the importance of the management of modifi-able factors is unparalleled. Undoubtedly, this must commence with proper patient education and can only be successful when matched with patient compliance. Cur-rently, while there are initiatives being undertaken by both the Diabetes Association of Trinidad and Tobago and the Ministry of Health, our study indicates that this either is insufficient, or a different approach needs to be explored. Patients need to be fully educated on how to properly manage the various parameters of self monitor-ing and the critical complications that can arise from poor management.
It should not be overlooked that intervention of this preventable disease can take place at the levels of pri-mary and secondary care. There must be attempts to shift the continuum of care from tertiary diabetic inpatient
interventions to non-diabetic outpatient intervention. At the primary level, this means education of the general public about the risk factors of diabetes and promotion of a healthy lifestyle; at the secondary level, this entails screening of non-diabetics with one or more risk factors and emphasis on the importance reducing their risk.
5. CONCLUSION
Poor patient education on use of the glucometer, mode of administration of insulin and non-compliance with diet and exercise reflect in higher HbA1c values. Patients using oral hypoglycemic agents, patients adhering to the prescribed frequency of drug treatment and most inter-estingly, patients visiting the clinics less frequently seem to have better glycemic control. Compliance with an ex-ercise plan and diet beneficially impacted on triglyceride values.
6. ACKNOWLEDGEMENTS
We express our sincere thanks to Dr George Legall for his statistical help and staff of all the health care facilities of Trinidad and Tobago. No funding was received to conduct this study.
REFERENCES
[1] Kumar V., Abul, K.A., Nelson, F. and Richard, N.M. (2007) Robbins basic pathology. 8th Edition, Saunders Elsevier, Philadelphia.
[2] European Heart Journal (2011) Archive of issues by date. http://eurheartj.oxfordjournals.org/content/
[3] Robyn, D., Verteuil, M.A., Health Services & Outcomes Research National Healthcare Group (2011) Self moni- toring of blood glucose in type 2 diabetes mellitus: Sys- tematic review of economic evidence.
[4] Solano, M.P. and Goldberg, R.B. (2006) Lipid managa- ment in type 2 diabetes. Clinical Diabetes, 24, 27-32. doi:10.2337/diaclin.24.1.27
[5] Dinsmoor, R.S. (2006) Lipid profile. R.A. Rapaport Pub- lishing Inc., New York.
diabetesselfmanagement.com
http://www.diabetesselfmanagement.com/Articles/Diabet esDefinitions/lipid_profile/1/
[6] Central Statistical Office, Ministry of Planning and De-velopment of the Republic of Trinidad and Tobago (2010)
[7] Diabetes Association of Trinidad and Tobago.
[8] Ministry of Health Annual Statistical Report, 2004-2005.
[9] Brathwaite, B. (2010) Epidemiology of Type 2 Diabetes. Johns Hopkins Point-of-Care Information Technology Center.
http://www.ttdiabetesguide.org/overview/overview/epidemi ology_of_type_2_diabetes.html?contentInstanceId=500922 [10] Rose, E. (2003) Does daily monitoring of blood glucose
[11] Harris, M.I. (2001) Frequency of blood glucose monitor- ing in relation to glycemic control in patients with type 2 diabetes. Diabetes Care, 24, 979-982.
doi:10.2337/diacare.24.6.979
[12] Sikaris, K. and Victoria, A. (2009) The correlation of hemoglobin A1c to blood glucose. Journal of Diabetes Science and Technology, 3, 429-432.
[13] Schütt, M.W., Kern, U., Krause, P., Busch, A., Dapp, R., Grziwotz, I., Mayer, J., Rosenbauer, C., Wagner, A., Zimmermann, W. and Kerner, R. (2006) Is the frequency of self-monitoring of blood glucose related to long-term metabolic control? Multicenter analysis including 24,500 patients from 191 centers in Germany and Austria. Ex- perimental and Clinical Endocrinology & Diabetes, 114
384-388. doi:10.1055/s-2006-924152
[14] Cramer, J.A. and Pugh M.J. (2005) The Influence of in- sulin use on glycemic control: How well do adults follow prescriptions for insulin? Diabetes Care, 28, 78-83. doi:10.2337/diacare.28.1.78
[15] Rhee, M.K., Slocum, W., Ziemer, D.C., Culler, S.D., Cook, C.B., El-Kebbi, I.M., Gallina, D.L., Barnes, C. and Phillips L.S. (2005) Patient adherence improves glycemic control. The Diabetes Educator, 31, 240-250.
doi:10.1177/0145721705274927
[16] Beverly, N., Halford, Linda, M.D., Beverly, N.H., Diabe- tes Control and Complications Trial, Department of Die- tetics, Massachusetts General Hospital Boston, and Dia- betes Control and Complications Trial, Joslin Diabetes Center Boston, Massachusetts (1993) The role of diet be- haviours in achieving improved glycemic control in in- tensively treated patients in the diabetes control and com- plications trial. Diabetes Care, 16, 1453-1458.
doi:10.2337/diacare.16.11.1453
[17] Boule, N.G., Elizabeth, H., Glen, P.K., George, A.W. and Ronald, J.S. (2001) Effects of exercise on glycemic con- trol and body mass in type 2 diabetes mellitus. Journal of the American Medical Association, 286, 1218-1227. doi:10.1001/jama.286.10.1218
[18] Chudyk, A. and Robert, J.P. (2011) Effects of exercise on cardiovascular risk factors in type 2 diabetes. Diabetes Care, 34, 1228-1237. doi:10.2337/dc10-1881