ISSN Online: 2164-2796 ISSN Print: 2164-2788
DOI: 10.4236/ojmi.2018.84013 Dec. 18, 2018 102 Open Journal of Medical Imaging
The Specificity of a Diagnostic FDG-PET Study Is
a Function of the Patient and the Location
Michael L. Goris
Stanford University, Sunnyvale, CA, USA
Abstract
The present paper is based on the observations that 1) there is reported varia-tion in the specificities according to the type of tumor targeted (target) by FDG PET and 2) that while one can posit that the sensitivity of the tracer de-pends on the avidity for glucose and the plasma supply of the target, even so that the targeting cannot influence the avidity of unrelated tissues or lesions. The hypothesis to be tested is twofold: 1) patients imaged for different types of lesions could have a different prevalence of FDG avid tissues or lesions different from the target and 2) that the target lesions could be generally lo-cated in body location (sites) more likely to contain unrelated foci of in-creased uptake. Variance analysis shows that the sensitivity varies according to the target (p = 0.022), but not according to the location (p = 0.34); the spe-cificity varies with the location (p = 0.0012)and the target (p = 0.05). Speci-ficities are significantly different in different primary targets and target loca-tions. The former is assumed to be due to different comorbidities in patients with different targets, the latter to the different locations of unrelated glucose avid organs or structures. Conclusion: When specificities are recorded or de-fined, the patient population characteristics and the organ or pathology of the false positives should also be described.
Keywords
FDG-PET, Specificity, Prevalence and Location
1. Introduction
In 2001 Sam Gambhir et al. published a supplement to the Journal of Nuclear Medicine reviewing the operating characteristics of Positron emission tomogra-phy with fluorine-18 Fluorodeoxyglucose (FDG-PET) in oncology. The article [1]
is organized around tumors in large categories (e.g. Lung cancer rather than How to cite this paper: Goris, M.L. (2018)
The Specificity of a Diagnostic FDG-PET Study Is a Function of the Patient and the Location. Open Journal of Medical Imag-ing, 8, 102-110.
https://doi.org/10.4236/ojmi.2018.84013
Received: October 10, 2018 Accepted: December 15, 2018 Published: December 18, 2018
Copyright © 2018 by author and Scientific Research Publishing Inc. This work is licensed under the Creative Commons Attribution International License (CC BY 4.0).
DOI: 10.4236/ojmi.2018.84013 103 Open Journal of Medical Imaging NSCLC, colorectal cancer); each in a tabulated form. In each table, for each can-cer surveyed, the reference of the reviewed paper is given in column 1. Column 3 specifies the context (e.g. diagnose masses or nodules) and eventually a specific location (e.g. Mediastinum or lung or lymph nodes). The relevant columns for this paper are columns 8 and 10 which were the reported sensitivity and specificity of the FDG PET in the reference is noted. All quoted references do not necessarily have both sensitivities and specificities, and in that case the reference is not used.
The present paper is based on the observation that 1) there is a variation in the specificities according to the type of tumor targeted (target); 2) that while one can posit that the sensitivity of the tracer depends on the avidity glucose and the plasma flow to the target, and 3) that the targeting cannot influence the avid-ity of unrelated tissues or lesions. Why then the variations in specificavid-ity accord-ing to the target?
The hypothesis to be tested is twofold that: 1) patients imaged for different types of lesions could have a different prevalence of FDG avid tissues or lesions different from the target and 2) the target lesions could be generally located in body location more likely to contain unrelated foci of increased uptake. In short, one can show that specificities are significantly different in different primary targets and target locations, but not as a function of the nature of the target.
In a lapidary term, the injected FDG does not know what the target is. The expectations are that:
1) Even if the FDG is in general use for cancer detection, the sensitivities would generally be high (by selection) and variable as a function of the target.
2) Specificities could be different for different targets either because certain targets are associated with a higher prevalence of other lesions, or because some locations contain more structures (normal or abnormal) with high FDG uptake.
2. Method
The plan was to review the survey paper (1) and look at the first five tumors re-viewed. Lymphoma was not included because of the wide range of phenotypes in lymphomas and specific locations could not be deduced (see below). In addition, we included the first ten references from the top of the tables that included both sensitivity and specificity. In this way we reviewed: Lungs [2]-[9], Colon [10] [11] [12] [13] [14], Melanoma [15]-[24], Head and Neck (H & N) [25]-[32], and Breast cancer [33]-[38] for the data on the targets.
Second, from all the references above we deduced the site scanned e.g. the site for a colon cancer recurrence was assumed to be the colon. For this step we broke the rule in the case of melanomas because to collect 3 defined sites we had to reach to the second page of the table. The sites are: Breast [33]-[38], Colon [10] [11] [12] [14], H & N [27] [29] [31], Liver [10] [12] [14], Lung [2] [3] [4] [5] [7] [8] [9] [13] [14], Lymph nodes [13] [16] [19] [23] [25] [26] [28]-[38] and Me-diastinum [2] [6] [8].
DOI: 10.4236/ojmi.2018.84013 104 Open Journal of Medical Imaging specific targets (tumor type Table 1 & Table 2) and sites (locations Table 3 & Table 4) In ANOVA the variation (within) specific targets or locations is compared to the variation between groups (targets or sites).
3. Results
In the type of target (tumor), the lowest sensitivity is for the H&N cancers (80%), but the range is narrow (94 - 80 Table 1). The difference between groups (targets) is significant at the p = 0.022 levels. The specificities vary between 74% and 94% (Table 2), and there is a weak but significant difference between targets (p = 0.052). However, patient specific prevalence’s of lesions or tissues in different patient types, that could be (falsely) positive are not likely to be very high, even if variable for different types of patients.
For the sites, the sensitivity range is narrow (Table 3) and location (site) has no effect on the sensitivities (p = 0.39), but a strong one (Table 4) for the speci-ficities (p = 0.0012).
4. Discussion
The operating characteristics of diagnostic tests (sensitivity and specificity) are generally synoptically reflected in Bayes theorem expressed as1:
Table 1. Sensitivities by targeted tumors.
Groups Count Sum Average Variance
Lung CA 10 901 90.1 116.5
Colorectal CA 10 933 93.1 64.2
Melanoma 10 865 86.5 150.7
H&N 10 808 80.8 93.3
Breast CA 10 938 93.8 31.3
The table shows the number of observations included in each target group. The analysis of variance shows that the differences in sensitivity between different targets (between), are significantly larger (p = 0.022) than within identical targets.
Table 2. Specificities by targeted tumors.
Groups Count Sum Average Variance
Lung CA 10 737 73.7 531.8
Colorectal CA 10 911 91.1 306.1
Melanoma 10 858 85.8 183.5
H&N 10 845 84.5 122.7
Breast CA 10 937 93.7 48.5
The table shows the number of observations included in each target group. The analysis of variance shows that the differences in specificitiy between different targets (between), are significantly larger (p = 0.056) than within identical targets.
1P D S( | )
+ + is the positive predicted value , P S D( +| +) is the sensitivity, P D( )+ is the
DOI: 10.4236/ojmi.2018.84013 105 Open Journal of Medical Imaging Table 3. Sensitivities by location.
Groups Count Sum Average Variance
Breast 6 558 93 34.4
Colon 4 387 96.7 11.6
H&N 3 256 85.3 8.33
Liver 3 283 94.3 36.3
Lung 9 824 91.6 43.8
Lymph nodes 15 1287 85.8 158.6
Mediastinum 3 267 89.0 363.0
The differences of sensitivities between the inspected site or organ is not significantly greater (p = 0.39) than within locations.
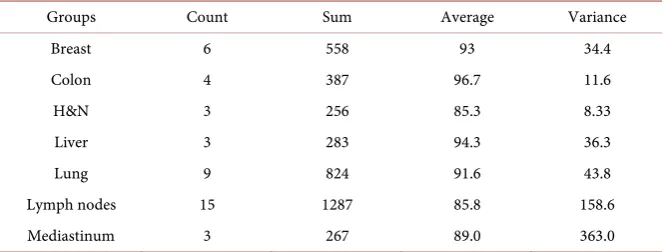
Table 4. Specificity by location.
Groups Count Sum Average Variance
Breast 6 558 93 34.4
Colon 4 387 96.7 11.6
H&N 3 256 85.3 8.33
Liver 3 283 94.3 36.3
Lung 9 824 91.6 43.8
Lymph nodes 15 1287 85.8 158.6
Mediastinum 3 267 89.0 363.0
The differences of specificities between different locations (site or organ) is significantly greater (p = 0.0012) than within locations.
(
|)
(
) ( )
(
|) ( )
(
) ( )
| |
P S D P D
P D S
P S D P D P S D P D
+ + + + + + + + + − − ⋅ = ⋅ + ⋅
The denominator in the equation is the prevalence of positive symptoms in the population tested (P(S+)). This expression is misleading, because it assumes that the world is binary; it is not. An abnormal ejection fraction response to ex-ercise could indicate ischemia, but also valvular disease. Gallium 67 citrate im-aging is positive for multiple benign lung diseases [39].
A better expression for P(S+) would be 1
[ ] (
|)
i ni i
i P D P S D
=
= ⋅
∑
, where S is the symptom (e.g. positive FDG uptake) for the lesion “i” and P(Di) represents the prevalence of all the possible lesions or structures that could lead to the symp-tom. P S D(
| i)
then represents the sensitivity of a positive finding for lesion “i”. Written in this way the equation points out to the fact that the non-specificity (and therefore the positive predictive value), is the function of the prevalence of lesions or tissues that could come out positive either in the pa-tient or at the imaged site.The proper expression for Bayes’ theorem should then be:
(
)
(
[ ] (
) ( )
)
1 | | | m mm i n
i i
i
P S D P D
P D S
P D P S D
+ + + + = = ⋅ = ⋅
[image:4.595.207.540.272.398.2]DOI: 10.4236/ojmi.2018.84013 106 Open Journal of Medical Imaging FDG uptake) and Dm+ is the targeted disease. P S D
(
| i)
is the sensitivity of the test for all (including the targeted lesions) or tissues from i to n and P D[ ]
i is their prevalence (including the targeted lesions).5. Conclusion
The thesis of this paper is that the prevalence of falsely positive findings varies with the targeted disease, because of the association with comorbidities, and with the search location because of adjacent structures, and not because of the differ-ences in target. Publications reviewing operating characteristics should be en-couraged to give information on the population with the targeted disease, with the location and nature of positive but non-target lesions.
Conflicts of Interest
The author declares no conflicts of interest regarding the publication of this pa-per.
References
[1] Gambhir, S.S., Czernin, J., Schwimmer, J., Silverman, D.H., Coleman, R.E. and Phelps, M.E. (2001) A Tabulated Summary of the FDG PET Literature. Journal of Nuclear Medicine, 42, 1S-93S
[2] Hagberg, R.C., Segall, G.M., Stark, P., Burdon, T.A. and Pompili, M.F. (1997) Characterization of Pulmonary Nodules and Mediastinal Staging of Bronchogenic Carcinoma with F-18 Fluorodeoxyglucose Positron Emission Tomography.
European Journal of Cardio-Thoracic Surgery,12, 92-97.
https://doi.org/10.1016/S1010-7940(97)00159-0
[3] Higashi, K., Ueda, Y., Kodama, Y., et al. (2001) Comparison of [18F]FDG PET and 201Tl SPECT in the Evaluation of Pulmonary Nodules. Journal of Nuclear Medicine,
42, 1489-1496.
[4] Lowe, V.J., Fletcher, J.W., Gobar, L., et al. (1998) Prospective Investigation of Positron Emission Tomography in Lung Nodules.Journal of Clinical Oncology,16, 1075-1084.https://doi.org/10.1200/JCO.1998.16.3.1075
[5] Menda, Y., Bushnell, D.L., Madsen, M.T., Kernstine, K.H., McLaughlin, K. and Hichwa, R.D. (2000) Retrospective Analysis of Standardized Uptake Values of Lung Masses with 1[18F]FDG PET. Journal of Nuclear Medicine, 41, 295 p.
[6] Nettelbladt, O.S., Sundin, A.E., Valind, S.O., et al. (1998) Combined Fluorine-18- FDG and Carbon-11-Methionine PET for Diagnosis of Tumors in Lung and Mediastinum. Journal of Nuclear Medicine, 39, 640-647.
[7] Orino, K., Kawamura, M., Hatazawa, J., Suzuki, I. and Sazawa, Y. (1998) Efficacy of F-18 Fluorodeoxyglucose Positron Emission Tomography (FDG-PET) Scans in Diagnosis of Pulmonary Nodules. The Japanese Journal of Thoracic and Cardiovascular Surgery, 46, 1267-1274. (In Japanese)
https://doi.org/10.1007/BF03217914
[8] Sazon, D.A., Santiago, S.M., Soo Hoo, G.W., et al. (1996) Fluorodeoxyglucose- Positron Emission Tomography in the Detection and Staging of Lung Cancer.
American Journal of Respiratory and Critical Care Medicine, 153, 417-421.
DOI: 10.4236/ojmi.2018.84013 107 Open Journal of Medical Imaging
[9] Vaylet, F., Foehrenbach, H., De Dreuille, O., et al. (1998) Fluorodeoxyglucose and Bronchopulmonary Cancer. Initial French Results with Positron Emission Tomography. Revue de Pneumologie Clinique, 54, 187-195. (In French)
[10] Valk, P.E., Abella-Columna, E., Hasemann, M.K., et al. (1999) Whole-body PET Imaging with [18F]Fluorodeoxyglucose in Management of Recurrent Colorectal Cancer. The Archives of Surgery, 134, 503-513.
https://doi.org/10.1001/archsurg.134.5.503
[11] Schirrmeister, H.H., Staib, L., Buck, A.K., Guhlmann, C.A. and Reske, S.S. (2000) FDG-PET in Patients with Suspected Recurrence of Colorectal Cancer. Is There a Contribution to Surgical Decision Finding? Journal of Nuclear Medicine, 41, 297 p. [12] Abdel-Nabi, H., Doerr, R.J., Lamonica, D.M., et al. (1998) Staging of Primary
Colorectal Carcinomas with Fluorine-18 Fluorodeoxyglucose Whole-Body PET: Correlation with Histopathologic and CT Findings. Radiology, 206, 755-760.
https://doi.org/10.1148/radiology.206.3.9494497
[13] Flamen, P., Stroobants, S., Dupont, P., et al. (1998) Additional Value of Positron Emission Tomography (PET) with Fluorodeoxyglucose (FDG) in Recurrent Colorectal Cancer: A Study in 103 Patients. Journal of Nuclear Medicine,39, 134 p. [14] Imdahl, A., Reinhardt, M.J., Nitzsche, E.U., et al. (2000) Impact of 18F-FDG-Positron
Emission Tomography for Decision Making in Colorectal Cancer Recurrences.
Langenbeck’s Archives of Surgery, 385, 129-134.
https://doi.org/10.1007/s004230050255
[15] Acland, K.M., O’Doherty, M.J. and Russell-Jones, R. (2000) The Value of Positron Emission Tomography Scanning in the Detection of Subclinical Metastatic Melanoma.Journal of the American Academy of Dermatology, 42, 606-611.
https://doi.org/10.1067/mjd.2000.101448
[16] Blessing, C., Feine, U., Geiger, L., Carl, M., Rassner, G. and Fierlbeck, G. (1995) Positron Emission Tomography and Ultrasonography. A Comparative Retrospective Study Assessing the Diagnostic Validity in Lymph Node Metastases of Malignant Melanoma. Archives of Dermatology, 131, 1394-1398.
https://doi.org/10.1001/archderm.1995.01690240048008
[17] Chisin, R., Klein, M., Freedman, N., et al. (1998) PET and Lymphoscintigraphic Evaluation of Malignant Melanomas: The Hadassah Hospital Experience. Clinical Positron Imaging, 1, 252.https://doi.org/10.1016/S1095-0397(98)00042-9
[18] Eigtved, A., Andersson, A.P., Dahlstrøm, K., et al. (2000) Use of Fluorine-18 Fluorodeoxyglucose Positron Emission Tomography in the Detection of Silent Metastases from Malignant Melanoma. European Journal of Nuclear Medicine and Molecular Imaging, 27, 70-75.https://doi.org/10.1007/PL00006666
[19] Gritters, L.S., Francis, I.R., Zasadny, K.R. and Wahl, R.L. (1993) Initial Assessment of Positron Emission Tomography Using 2-Fluorine-18-Fluoro-2-Deoxy-D- Glucose in the Imaging of Malignant Melanoma. Journal of Nuclear Medicine, 34, 1420-1427.
[20] Hsueh, E.C., Gupta, R.K., Glass, E.C., Yee, R., Qi, K. and Morton, D.L. (1998) Positron Emission Tomography plus Serum TA90 Immune Complex Assay for Detection of Occult Metastatic Melanoma. Journal of the American College of Surgeons, 187, 191-197.https://doi.org/10.1016/S1072-7515(98)00140-9
DOI: 10.4236/ojmi.2018.84013 108 Open Journal of Medical Imaging
[22] Nguyen, A., Akhurst, T., Larson, S., Coit, D. and Brady, M. (1999) PET Scanning with 18F2-Fluoro-2-Deoxy-D-Glucose (FDG) in Patients with Melanoma: Benefits and Limitations. Clinical Positron Imaging, 2, 93-98.
https://doi.org/10.1016/S1095-0397(99)00006-0
[23] Wagner, J.D., Schauwecker, D., Davidson, D., et al. (1999) Prospective Study of Fluorodeoxyglucose-Positron Emission Tomography Imaging of Lymph Node Basins in Melanoma Patients Undergoing Sentinel Node Biopsy. Journal of Clinical Oncology, 17, 1508-1515.https://doi.org/10.1200/JCO.1999.17.5.1508
[24] Bohuslavizki, K.H., Klutmann, S., Neuber, K., et al. (2000) Correlation of 18F FDG-PET and Histological Findings in Patients with Malignant Melanoma. Journal of Nuclear Medicine, 41, 302.
[25] Beuthien-Baumann, B., Bredow, J., Eckelt, U., Franke, W.G., Hlawitschka, M. and Neise, E. (2000) Diagnostic Value of 18F-FDG PET in Detecting Carcinoma of the Oral Mucosa in Comparison with MRI, CT, and Ultrasound (US). Journal of Nuclear Medicine, 41, 301.
[26] Lang, O., Doerr, U., Schneider, K., Hagen, R. and Bihl, H. (2000) Cervical Lymph Node Staging in Patients with Head and Neck Cancer: A Comparison between 18F-FDG-PET and Ultrasound. Journal of Nuclear Medicine, 41, 32.
[27] Manolides, S., Donald, P.J., Volk, P. and Pound, T.R. (1998) The Use of Positron Emission Tomography Scanning in Occult and Recurrent Head and Neck Cancer.
Acta Oto-Laryngologica, 118, 1-12.
[28] Wong, W.L., Chevretton, E.B., McGurk, M., et al. (1997) A Prospective Study of PET-FDG Imaging for the Assessment of Head and Neck Squamous Cell Carcinoma. Clinical Otolaryngology, 22, 209-214.
https://doi.org/10.1046/j.1365-2273.1997.00852.x
[29] Zimny, M., Nowak, B., Di Martino, E., Jaenicke, S., Cremerius, U. and Buell, U. (2000) Hybrid PET vs. Conventional Imaging in the Diagnosis of Head and Neck Tumors. Journal of Nuclear Medicine, 41, 292.
[30] Adams, S., Baum, R., Stuckensen, T., Bitter, K. and Hor, G. (1998) Prospective Comparison of 18F-FDG PET with Conventional Imaging Modalities (CT, MRI, US) in Lymph Node Staging of Head and Neck Cancer. European Journal of Nuclear Medicine and Molecular Imaging,25, 1255-1260.
https://doi.org/10.1007/s002590050293
[31] Nowak, B., Di Martino, E., Janicke, S., et al. (1999) Diagnostic Evaluation of Malignant Head and Neck Cancer by F-18-FDG PET Compared to CT/MRI.
Nuklearmedizin, 38, 312-318.https://doi.org/10.1055/s-0038-1632228
[32] Braams, J., Pruim, J., Freling, N., et al. (1995) Detection of Lymph Node Metastases of Squamous Cell Cancer of the Head and Neck with FDG-PET and MRI. Journal of Nuclear Medicine, 36, 211-216.
[33] Adler, L., Crowe, J., al-Kaisi, N. and Sunshine, J. (1993) Evaluation of Breast Masses and Axillary Lymph Nodes with [F-18] 2 Deoxy-2-Fluoro-D-Glucose PET.
Radiology, 187, 743-750.https://doi.org/10.1148/radiology.187.3.8497624
[34] Avril, N., Dose, J., Janicke, F., et al. (1996) Metabolic Characterization of Breast Tumors with Positron Emission Tomography Using F-18 Fluorodeoxyglucose.
Journal of Clinical Oncology, 14, 1848-1857.
https://doi.org/10.1200/JCO.1996.14.6.1848
DOI: 10.4236/ojmi.2018.84013 109 Open Journal of Medical Imaging
https://doi.org/10.1007/BF02303557
[36] Noh, D., Yun, I., Kim, J., et al. (1998) Diagnostic Value of Positron Emission Tomography for Detecting Breast Cancer. World Journal of Surgery, 22, 223-228.
https://doi.org/10.1007/s002689900374
[37] Palmedo, H., Bender, H., Grunwald, F., Mallmann, P., Krebs, D. and Biersack, H. (1997) Comparison of Fluorine-18 Fluorodeoxyglucose Positron Emission Tomography and Technetium-99m Methoxyisobutylisonitrile Scintimammography in the Detection of Breast Tumors. European Journal of Nuclear Medicine and Molecular Imaging,24, 1138-1145.https://doi.org/10.1007/BF01254246
[38] Scheidhauer, K., Scharl, A., Pietrzyk, U., et al. (1996) Qualitative [18F] FDG Positron Emission Tomography in Primary Breast Cancer: Clinical Relevance and Practicability. European Journal of Nuclear Medicine and Molecular Imaging,23, 618-623.https://doi.org/10.1007/BF00834522
DOI: 10.4236/ojmi.2018.84013 110 Open Journal of Medical Imaging
Appendix: Deriving Bayes’ Theorem
B B
=
(1)B A B
A× =
(2) B C B
C× =
(3)
BA BC
A =C
(4) B A B C
A U C U× = ×
(5)
1) Is a tautology, since B on both sides is the same area. 2) In effect, B is multiplied by A/A, which is 1.
3) In effect, B is multipled by C/C, which is 1. 4) This only rewrites 1.
5) Both sides are divided by U.
In this representation U represents all the patients the universe of patients. A is the set of patients who have a particular symptom (e.g. high FDG uptake in a location where there should not be high uptake). C is the set of patients who have the disease one is looking for (e.g. a lung cancer). B is the set of patients who have the symptom and the disease. Redefining the terms, A/U is the prevalence of the symptoms or the prevalence of the symptom in the general population [P(S+)]. C/U is the prevalence of the disease in this population [P(D+)]. In the same way, B/A is the conditional probability of having the disease if one has the symptom [P(D+|S+)] and B/C is the conditional probability of having the symptom, if one has the disease[P(S+|D+)]. P(D+|S+) is the positive predictive value and P(S+|D+) is the sensitivity.
Rewriting Equation (5):
(
|) ( )
(
|) (
)
P D S+ + ⋅P S+ =P S+ D+ ⋅P D+ (6)
(
|)
P S(
|D( )
) (
P D)
P D S
P S
+ + ⋅ +
+ + =