Original Article
Increased IL-12 and decreased IL-33 serum levels are
associated with increased Th1 and suppressed
Th2 cytokine profile in patients with diabetic
nephropathy (CURES-134)
Gowrishankar Anand1, Rathinam Vasanthakumar2, Vishwanathan Mohan3, Subash Babu4, Vivekanandhan
Aravindhan1,5
1AU-KBC Research Centre, MIT Campus of Anna University, Chennai, India; 2Department of Biotechnology, Pra-thyusha Institute of Technology and Management, India; 3Madras Diabetes Research Foundation, Chennai, India; 4National Institutes of Health-International Center for Excellence in Research, Chennai; 5Department of Genetics, Dr.ALM.PG.IBMS, University of Madras, Chennai, India
Received September 20, 2014; Accepted November 8, 2014; Epub October 15, 2014; Published November 1, 2014
Abstract: The role played by recently discovered novel cytokine IL-33 in controlling T-helper (Th)1 and Th2 cytokines under conditions of diabetic nephropathy (DN) is less well studied. In the present study, we estimated the levels of IL-33 along with both Th1 and Th2 cytokines in the serum of normal glucose tolerant (NGT), diabetic subjects with (DN) or without nephropathy (DM) and correlated it with the clinical risk factors of diabetes and nephropathy. 222 study subjects were recruited from the Chennai Urban Rural Epidemiology Study (CURES): 61 NGT, 79 DM and 82 DN. IL-33 level was estimated by ELISA while other Th1 (IL-12, IFN-gamma and IL-2) and Th2 (IL-4, IL-5 and IL-13)
cytokines were measured using a Bio-plex bead assay. DM subjects showed a mixed Th1-Th2 profile (increased IFN-g, IL-12, IL-4 and IL-13 and decreased IL-33) while DN subjects showed enhanced Th1 profile (increased IFN-g,
IL-2 and IL-12) with suppression of Th2 cytokine (decreased IL-33 and IL-13). The IL-33 levels showed a serial de-cline with increasing severity of insulin resistance and microalbuminuria. DN was associated with enhanced Th1 response and suppression of Th2 responses which might be due to inreased levels of IL-12 and decreased levels of IL-33 cytokines respectively.
Keywords: Diabetic nephropathy, IL-33, IL-2, IL-12, IFN-γ, IL-4, IL-5, IL-13
Introduction
Type-2 diabetic nephropathy (DN) is the most common cause of end-stage renal disease among patients undergoing renal dialysis [1]. Apart from the traditional metabolic and
hemo-dynamic risk factors, chronic inflammation is
increasingly being recognized as a major risk factor for DN [2, 3]. Macrophages have long been recognized as key players in insulin resis-tance (IR) [4] and vascular (both micro and macro) complications in diabetes [5]. Recently, T cells are increasingly being recognized as key players in macrophage recruitment and activa-tion, there by setting in the stage for chronic
inflammation [6]. Th1, Th2, Th17, Treg, and
cytotoxic T cells have been implicated in the development and progression of DN [6].
The role played by pro-inflammatory cytokines
such as TNF-alpha, IL-6 and IL-1beta in DN has been well studied [7]. However, the role played by Th1 and Th2 cytokines in DN is less well explored. From recent animal studies it appears that, while Th1 cytokines promote IR, Th2 kines ameliorate it [8]. Whether the same cyto-kines are involved in kidney damage as seen in
DN is not known. However, increased infiltration
of activated T cells and aberrant expression of T cell cytokines in diabetic kidney have been
reported [9]. While IL-12 has been identified as
insu-lin resistance [12] and kidney disease [13]. In the present study, our objective was to esti-mate the levels of the newly discovered IL-33 along with both Th1 and Th2 cytokines in sub-jects with DN and to correlate it with clinical risk factors associated with DM (IR and glycat-ed haemoglobin (HbA1c)) and DN (Urea, creati-nine, GFR and microalbuminuria).
Methods
Study population
All the participants were recruited from the Chennai Urban Rural Epidemiology Study (CURES), an ongoing large epidemiological study conducted on a representative popula-tion of Chennai (formerly Madras). The method-ology of the study has been published
else-where [14]. Briefly, in Phase-1 of the urban
component, 26,001 individuals were recruited based on a systematic random sampling tech-nique. Fasting plasma glucose (FPG) was deter-mined using the One Touch Basic glucometer (Lifescan, Johnson & Johnson, Milpitas, CA) in all subjects. In Phase-2, detailed studies of dia-betic complications, including nephropathy and retinopathy were performed, and in Phase-3, every 10th individual in Phase 1 was invited to participate in more detailed studies. The study subjects of this study were recruited from Phase-2 and -3.
Inclusion and exclusion criteria
The inclusion criteria were patients within the normal range of white blood cell to minimize the confounding effect of infection. The exclusion criteria were patients with type-1 diabetes and patients with a previous diagnosis of urolithia-sis, liver cirrhourolithia-sis, congestive heart failure, chronic lung diseases, chronic infections and viral hepatitis. Institutional ethical committee approval from the Madras Diabetes Research Foundation Ethics Committee was obtained (MDRF-EC/SOC/2009/05) and written infor- med consent was obtained from all the study participants. The study was conducted as per
the declaration of Helsinki. Classification of
NGT (99 or below dg/dL) and DM (126 or above dg/dL) were based on FPG.
Control groups
This study is a twin study which was conducted as part of Th1-Th2 cytokine serum cytokine
pro-filing in subjects with diabetic complications.
The NGT and DM groups without complications have already been reported as control groups in one of our recent publications on diabetic-Coronary artery disease (DM-CAD) [15]. The IL-33 levels in NGT and DM have not been reported previously.
Anthropometric and biochemical parameters
Anthropometric measurements including hei- ght, weight and waist circumference were obtained using standardized techniques. The body mass index (BMI) was calculated as the weight in kilograms divided by the square of height in meters. FPG (glucose oxidase-peroxi-dase method), serum cholesterol (cholesterol oxidase-peroxidase-amidopyrine method), se- rum triglycerides (glycerol phosphate oxidase-peroxidase-amidopyrine method), high density lipoprotein cholesterol (HDL-C) (direct method-polyethylene glycol-pretreated enzymes), urea and creatinine (Jaffe’s method) were measured using a Hitachi-912 Autoanalyser (Hitachi, Mannheim, Germany). Glycated hemoglobin (HbA1c) was estimated by high pressure liquid chromatography using a variant machine (Bio-Rad, Hercules, CA). The intra- and inter assay
coefficient of variation for the biochemical
assays ranged between 3.1% and 5.6%.
Diagnosis of diabetic nephropathy
Albumin concentration was measured in a fast-ing urine sample usfast-ing an immunoturbidomet-ric assay (Hitachi 902 autoanalyser; Roche Diagnostics) as described earlier [16]. Subjects
were classified as normoalbuminuric (≤29 μg), microalbuminuric (30-229 μg) or albuminuric/ overt nephropathy (≥300 μg) based on albumin
excretion per mg of creatinine. As per these cri-teria, 68 of the 82 DN subjects were microalbu-minuric while the remaining 14 were albumin-uric. The mean inter- and intra-assay coe-
fficients of variation were 3.5% and 4.2%,
respectively as determined in our laboratory. Data on serum creatinine, age, sex, and race were then used to calculate the estimated
glo-merular filtration rate (eGFR) using the Chronic
Kidney Disease Epidemiology Collaboration (CKD-EPI) equation [17].
Estimation of serum cytokine level
The levels of Th1 and Th2 cytokines (IL-2, IL-12,
IFN-γ, IL-4, IL-5, and IL-13) in the serum were
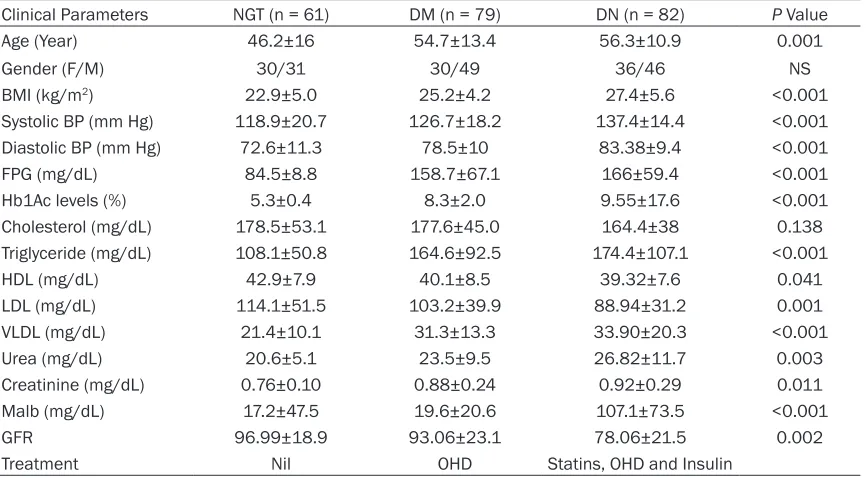
Table 1. Clinical and biochemical characteristics of the study subjects
Clinical Parameters NGT (n = 61) DM (n = 79) DN (n = 82) P Value
Age (Year) 46.2±16 54.7±13.4 56.3±10.9 0.001
Gender (F/M) 30/31 30/49 36/46 NS
BMI (kg/m2) 22.9±5.0 25.2±4.2 27.4±5.6 <0.001
Systolic BP (mm Hg) 118.9±20.7 126.7±18.2 137.4±14.4 <0.001
Diastolic BP (mm Hg) 72.6±11.3 78.5±10 83.38±9.4 <0.001
FPG (mg/dL) 84.5±8.8 158.7±67.1 166±59.4 <0.001
Hb1Ac levels (%) 5.3±0.4 8.3±2.0 9.55±17.6 <0.001
Cholesterol (mg/dL) 178.5±53.1 177.6±45.0 164.4±38 0.138
Triglyceride (mg/dL) 108.1±50.8 164.6±92.5 174.4±107.1 <0.001
HDL (mg/dL) 42.9±7.9 40.1±8.5 39.32±7.6 0.041
LDL (mg/dL) 114.1±51.5 103.2±39.9 88.94±31.2 0.001
VLDL (mg/dL) 21.4±10.1 31.3±13.3 33.90±20.3 <0.001
Urea (mg/dL) 20.6±5.1 23.5±9.5 26.82±11.7 0.003
Creatinine (mg/dL) 0.76±0.10 0.88±0.24 0.92±0.29 0.011
Malb (mg/dL) 17.2±47.5 19.6±20.6 107.1±73.5 <0.001
GFR 96.99±18.9 93.06±23.1 78.06±21.5 0.002
Treatment Nil OHD Statins, OHD and Insulin
BMI-Body mass index, BP-blood pressure, FPG-fasting plasma glucose, Hb1Ac-glycated haemoglobin, HDL-high-density lipo-protein, LDL-low-density lipolipo-protein, VLDL-very low-density lipolipo-protein, Malb-Micoalbuminaria, GFR-glomerular filtration rate, OHD-Oral hypoglycaemic drugs and NS-Non significant.
bead assay system (Bio-Rad). The lower detec-tion limits were 16 pg/mL for IL-2, 0.3 pg/mL for IL-4, 2.08 pg/mL for IL-5, 2.78 pg/mL for IL-12, 2.22 pg/mL for IL-13, 2.14 pg/mL for IFN-
γ. IL-33 levels were estimated by ELISA as per
the instructions of the kit (eBiosciences). The lower detection limit was 2 pg/mL. The intra-
and inter-assay coefficients of variation for mul
-tiplex assay were less than 5% as determined in our lab.
Sample size calculation
It is a cross-sectional observational study. Initially, 20 NGT, 20 DM and 20 DN subjects were used for analysis. On the basis of the
pre-liminary results, with a confidence interval of
95%, an estimated P value <0.05, and a power of 80%, the present sample size of 50 per group was calculated. However, we included few more samples in each group to account for the wide variation generally seen among serum biomarkers (based on our previous experience) and derived the present sample size which includes 61 NGT, 79 DM and 82 DN.
Statistical analyses
Student t-test was used to compare groups for continuous variables which followed normal
distribution, whereas χ2 test or Fisher exact test
(as appropriate) was used to compare propor-tions. Kruskal-Wallis test was used for multiple parameters that did not show normal distribu-tion. Spearman’s correlation analysis was car-ried out to determine the association of clinical paramaters with the cytokines. Multivariate logistic regression analysis was used to deter-mine the association of cytokines with the study groups. Multiple comparisons were cor-rected using the Holm’s correction for each set of analysis. All the analyses were done using SPSS statistical package (Version 20.0; SPSS, Chicago, IL) and p value less than 0.05 was
considered significant.
Results
Patient characteristics
Table 1 shows the clinical and biochemical characteristics of the study subjects. Age was
significantly higher in DN groups compared to
NGT and DM (P = 0.001). BMI showed a linear increase from NGT to DN group (P < 0.001). Subjects with DN had higher blood pressure (both systolic and diastolic) compared to NGT and DM groups (P < 0.001). The FPG and HbA1c
values were significantly higher in the DM and
-cantly lower levels of HDL (P = 0.041), LDL (P = 0.001) and higher levels of VLDL (P < 0.001) and triglycerides (P < 0.001), while the
choles-terol levels were not significantly different
between the groups. DN subjects also had
sig-nificantly elevated levels of urea (P = 0.003),
creatinine (P = 0.011), microalbuminuria (P < 0.001) and GFR (P = 0.002). Based on GFR val-ues and as per the renal association criteria,
54 (66%) were in stage 1 (GFR ≥ 90), 19 (23%)
in stage 2 (GFR = 60-89), 8 (10%) in stage 3 (GFR = 30-59) and 1 (1%) in stage 4 (GFR =
15-29) of CKD. None were in stage 5 (GFR ≤
15).
Serum cytokine profile
To determine the serum Th1 cytokine profile,
the levels of IL-2, IL-12 and IFN-gamma were estimated in the study groups (Figure 1). As shown in Figure 1, the Th1 cytokine IFN-gamma levels were found to be increased in DM and stayed higher in DN (GM (Range): NGT-7.3 (0.56-90) pg/ml vs. DM-297 (0.57-9495) Vs DN-108.9 (1.12-5013) pg/ml; P = 0.0011). The IL-12 levels showed a liner increase from NGT to DM to DN (GM (Range): NGT-2.1 (0.23-10.7) pg/ml vs. DM-2.8 (0.26-224) pg/ml vs. DN-2.9 (0.24-58) pg/ml; P < 0.05). The IL-2 levels were
significantly elevated in DN compared to DM
and NGT (GM (Range): NGT-2.3 (0.37-7.7) pg/ml Vs DM-2.1 (0.21-28.1) pg/ml vs. DN-3.7 (0.51-150); P < 0.05). Similarly, to determine the
serum Th2 cytokine profile the levels of IL-33,
IL-4, IL-5 and IL-13 were estimated in the study groups (Figure 2). As can be seen in Figure 2, the IL-33 levels showed a linear decline from NGT to DM to DN (GM (Range): NGT-348.0
(318.2-380.6) pg/ml vs. DM-118.6 (72.6-193.7) pg/ml vs. DN-45.98 (27.98-75.56); P <
0.05). The IL-4 levels were significantly elevated
in DM but not in DN groups compared to NGT (GM (Range): NGT-0.12 (0.01-0.52) pg/ml vs. DM-0.24 (0.06-95) pg/ml vs. DN-0.12 (0.01-9.8); P < 0.05). IL-13 levels were found to be
significantly increased in DM and decreased in
DN representing Th2 suppression (GM) (Range): NGT-2.1 (0.60-6.24) pg/ml Vs DM-17.52(0.40-747.4) pg/ml vs. DN 3.36 (0.28-130.4) pg/ml; P
< 0.001). IL-5 levels were not significantly
altered among the groups. The Th1-Th2
cyto-kine profile (except for IL-33) in NGT and DM
has recently been reported in our twin publica-tion on DM-CAD [15].
Correlation analysis
Table S1 shows Spearman’s correlation be- tween the mean cytokine levels and the bio-chemical parameters of the study subjects. Age
did not show significant correlation with any of
[image:4.612.91.520.71.214.2]the cytokines. BMI (r = -.151; P = 0.036), sys-tolic (r = -.161; P = 0.025) and diastolic BP (r = -0.158; P = 0.028) showed significant correla -tion with IL-33. FPG showed positive correla-tion with IL-2 (r = 0.15, P = 0.032), IL-12 (r = 0.12, P = 0.011), IFN-gamma (r = 0.17; P = 0.013), IL-4 (r = 0.16, P = 0.021) and IL-5 (r = 0.17; P = 0.010) and negative correlation with IL-33 (r = -0.284; P < 0.001). Cholesterol showed nega-tive correlation with IFN-gamma (r = -0.16, P = 0.019), IL-5 (r = -0.15, P = 0.025) and positive correlation with IL-13 (r = 0.17, P = 0.011). While triglyceride showed negative correlation (r = -0.216; P = 0.003), HDL levels (r = .147; P = 043) showed positive correlation with IL-33.
0.001) showed a negative association with DN.
The associations remained significant even
after adjusting for FPG and HbA1c.
Discussion
DN is characterized by chronic, low grade
non-specific inflammation, which has long been
associated with sterile innate immune
respons-es mediated by pro-inflammatory cytokinrespons-es
(TNF-alpha, IL-6 and IL-1beta) [18]. However,
recent identification of T cells in the diabetic
kidney had induced renewed interest in study-ing T cell cytokines in this disease condition [19]. While IL-12 serves as the master control-ler of Th1 differentiation, IL-33 has recently
been identified as a master controller of Th2
differentiation. However compared to IL-12 the role played by IL-33 in DN is not known. As a
first step towards this goal we evaluated the
serum Th1-Th2 cytokine levels along with IL-33 levels in NGT, DM and DN subjects. The salient
findings of the study are: 1) DM subjects
showed a mixed Th1-Th2 phenotype with signifi
-cantly elevated levels of IFN-gamma, IL-12, IL-4 and IL-13 and decreased levels of IL-33, 2) DN subjects showed a clear enhanced Th1
pheno-Figure 2. T-helper 2 serum cytokine levels in NGT, DM and DN subjects: (A) interleukin (IL)-33, (B) IL-4, (C) IL-5 and (D) IL-13. The geometric mean is represented by the horizontal bars. P values were calculated by Kruskal-Wallis one-way analysis of variance. P < 0.05 was considered significant.
LDL showed negative correlation with IL-2 (r = -0.144, P = 0.041), IFN-gamma (r = -0.160, P = 0.019) and IL-4 (r = -0.164, P = 0.016) and pos-itive correlation with IL-33 (r = 0.153; P = 0.036) and IL-13 (r = 0.170, P = 0.013). VLDL showed a negative correlation only with IL-33 (r = -.189; P = 0.012) and positive correlation with IL-13 (r = 0.187, P = 0.008). Glycated hemoglobin sho- wed a positive correlation with IL-12 (r = 0.15, P = 0.023), IFN-gamma (r = 0.19; P = 0.006), IL-4 (r = 0.18, P = 0.007) and IL-5 (r = 0.14; P = 0.045) and negative correlation with IL-33 (r = -0.32; P < 0.001). While urea showed a nega-tive correlation with IL-13 (r = -0.18, P = 0.008), creatinine showed a positive correlation with IL-2 (r = 0.19, P = 0.007) and negative corre- lation with IL-13 (r = -0.29, P < 0.001). Mi- croalbuminuria showed positive correlation with IL-13 (r = -0.26; P < 0.001) and negative correlation with IL-33 (r = -.308; P < 0.001). GFR showed a negative correlation with IL-13 (r = -0.15; P = 0.031).
Multivariable logistic regression analyses
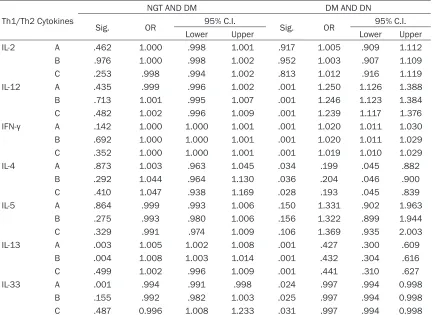
Table S2 shows the results of multivariate logis-tic regression analysis with disease phenotype
as dependent variable and log transformed cytokine levels as independent variables. With NGT and DM as dependent vari-ables, IL-33 (OR = 0.994; 95% CI = 0.991-0.998; P = 0.001) and IL-13 (OR = 1.005; 95% CI = 1.002-1.008; P = 0.003) were the only cytokines which showed
significant association with DM.
The significance of the associa
-tion with IL-13 was not affected when adjusted for FPG but was lost when adjusted for HbA1c.
With respect to IL-33, the signifi
[image:5.612.92.369.70.340.2]type with significantly elevated levels of
IFN-gamma, IL-12 and IL-2 and suppressed levels of Th2 cytokine (IL-33 and IL-13) and 3) While most Th1 cytokines (IFN-gamma and IL-2)
served as significant risk factors against DN,
most Th2 cytokines (IL-4, IL-13 and IL-33)
showed significant protection again DN (as
determined by regression analysis).
The DM group showed a mixed Th1-Th2 profile
with increased levels of IFN-gamma, IL-12, IL-4 and IL-13 and reduced levels of IL-33. Previously, we have reported the same immune phenotype in subjects with metabolic syndrome, a major risk factor for diabetes (if not already present) [20]. However the IL-33 levels were not report-ed in that study [20]. IFN-gamma had been implicated not only in obesity but also with worsening of insulin resistance [21]. Animal
studies have reported early infiltration of CD4+ and CD8+ T cells with a Th1 phenotype into the
visceral adipose tissue in diet-induced obese (DIO) mice [22]. Further, immune mediated depletion of Th1 cells in DIO mice showed increased glucose tolerance and insulin sensi-tivity [23]. IL-12 was found to be elevated in obese subjects with insulin resistance [24] and also in diabetic subjects with cardiovascular complications [25]. Our study is well in agree-ment with these reports with increased levels of both IL-12 and IFN-gamma in the DM group.
Along with Th1 cytokines, a significant up-regu
-lation of Th2 cytokines IL-4 and IL-13 was seen in the DM group. However IL-33 which has
recently been identified as a master regulator
of Th2 differentiation was downregulated in DM subjects. The role played by Th2 cytokines in IR is still an enigma. Moreover, data available on the Th2 serum cytokines in DM are scant. In a recent study, decreased serum levels of IL-13 in T2DM subjects was reported and was implicat-ed in impairimplicat-ed glucose uptake and metabolism [26]. Chang et al., have demonstrated the role played by IL-4 in improving insulin sensitivity and glucose tolerance in DIO mice [27]. Recently IL-33 was found to be negatively asso-ciated with BMI and serum lipid parameters in non diabetic subjects [12]. Thus with the
cur-rent findings and in the light of available litera
-ture, the increased levels of Th2 cytokines in DM implicate a counter measure to inhibit Th1 immunity and there by IR (with IL-33 being an exception).
The DN group showed a clear Th1 profile (with significantly elevated levels of IFN-gamma,
IL-12 and IL-2) with concomitant Th2
suppres-sion (with significant lower levels of Th2 cyto
-kine IL-33, IL-4 and IL-13). Apart from IL-13, a
small but statistically non-significant decrease
in the IL-4 levels was also seen in the DN group compared to DM. Thus, when diabetic subjects
develop nephropathy, the systemic inflamma
-tion becomes more Th1 like from a mixed
Th1-Th2 profile. Diabetic nephropathy is the patho
-logical outcome of end stage renal failure because of changed hemodynamics, hypertro-phy of glomerular structures, thickening of the basement membrane, oxidative stress and
inflammatory cytokines [28]. Diabetic kidney was found to promote pro-inflammatory actions
and was implicated in T cell recruitment and activation [29]. Activated T cells are thought to be part of an immune-mediated attack associ-ated with the development of proteinuria in dia-betic nephropathy [30]. Our results are in agreement with the report of Wu et al., [24]
which demonstrates significant Th1 profile at
the serum cytokine levels in DN subjects. However, while they found no difference in serum Th2 cytokines we found a strong down-modulation of these cytokine in DN subjects. Arababadi et al., has previously reported increased serum levels of IFN-gamma and decreased levels of IL-17 in DN [26]. However the levels of Th2 cytokines were not reported in their study. In the present study, the exact cause for low levels of Th2 cytokines in DN is
currently not known. However the significant
decline in serum IL-33 levels, as seen in DN subjects could be one of the major factors associated with the decline of Th2 cytokines. It was also seen that, compared to effectors Th2 cytokines (IL-4 and IL-13), a steep decline in the master regulator (IL-33) was seen even in the DM stage. It is important to note that at least 77% of the DN subjects were in early stage (1 or 2) of the disease which could be a reason for the modest decline in IL-4 levels. The negative correlation seen between IL-33 and IL-13 with most of the diabetogenic and renal parameters and a negative association of IL-33 and IL-13 with DN indicates some protective association between Th2 cytokines and DN.
of Th1 and down regulation of Th2 cytokine responses. The major limitation of our study is its cross-sectional nature, which means that no cause and effect relationship can be drawn. Despite the study being cross-sectional in nature, it gains importance in the context of it being conducted in a high-risk ethnic popula-tion where no report on this topic is currently available. Upregulation of Th1 master regulator (IL-12) and down regulation of Th2 master regu-lator (IL-33) much before the development of DN could be one of the major factors responsi-ble for the enhanced Th1 and suppressed Th2
profile as seen in DN subjects.
Acknowledgements
We thank the epidemiology team members of
MDRF for conducting the CURES field studies.
This is the 134th publication from CURES. The project was funded by DAE-BRNS grant (2012/37B/11/BRNS/1936).
Disclosure of conflict of interest
None.
Address correspondence to: Dr. Vivekanandhan Aravindhan, Department of Genetics, Dr.ALM PG IBMS, University of Madras, Taramani, Chennai- 600113. Tel: 044- 24547061; Fax: 044-24547067; E-mail: [email protected]; cvaravindhan@ mail.unom.in
References
[1] Striker GE, Agodoa LL, Held P, Doi T, Conti F and Striker LJ. Kidney disease of diabetes mel-litus (diabetic nephropathy): perspectives in the United States. J Diabet Complications 1991; 5: 51-52.
[2] Navarro-Gonzalez JF and Mora-Fernandez C.
The role of inflammatory cytokines in diabetic
nephropathy. J Am Soc Nephrol 2008; 19: 433-442.
[3] Mora C and Navarro JF. Inflammation and dia -betic nephropathy. Curr Diab Rep 2006; 6: 463-468.
[4] Heilbronn LK and Campbell LV. Adipose tissue
macrophages, low grade inflammation and in -sulin resistance in human obesity. Curr Pharm Des 2008; 14: 1225-1230.
[5] Shikata K and Makino H. Role of macrophages in the pathogenesis of diabetic nephropathy. Contrib Nephrol 2001; 46-54.
[6] Wu CC, Sytwu HK, Lu KC and Lin YF. Role of T cells in type 2 diabetic nephropathy. Exp Dia-betes Res 2011; 2011: 514738.
[7] Kelly KJ, Liu Y, Zhang J, Goswami C, Lin H and
Dominguez JH. Comprehensive genomic profil -ing in diabetic nephropathy reveals the
pre-dominance of proinflammatory pathways.
Physiol Genomics 2013; 45: 710-719.
[8] Feuerer M, Herrero L, Cipolletta D, Naaz A,
Wong J, Nayer A, Lee J, Goldfine AB, Benoist C,
Shoelson S and Mathis D. Lean, but not obese, fat is enriched for a unique population of regu-latory T cells that affect metabolic parameters. Nat Med 2009; 15: 930-939.
[9] Galkina E and Ley K. Leukocyte recruitment and vascular injury in diabetic nephropathy. J Am Soc Nephrol 2006; 17: 368-377.
[10] Schmitz J, Owyang A, Oldham E, Song Y,
Mur-phy E, McClanahan TK, Zurawski G, Moshrefi
M, Qin J, Li X, Gorman DM, Bazan JF and Kastelein RA. IL-33, an interleukin-1-like cyto-kine that signals via the IL-1 receptor-related protein ST2 and induces T helper type 2-asso-ciated cytokines. Immunity 2005; 23: 479-490.
[11] Zeyda M, Wernly B, Demyanets S, Kaun C, Hammerle M, Hantusch B, Schranz M, Neuhofer A, Itariu BK, Keck M, Prager G, Wojta J and Stulnig TM. Severe obesity increases adipose tissue expression of interleukin-33 and its receptor ST2, both predominantly de-tectable in endothelial cells of human adipose tissue. Int J Obes (Lond) 2013; 37: 658-665. [12] Hasan A, Al-Ghimlas F, Warsame S, Al-Hubail A,
Ahmad R, Bennakhi A, Al-Arouj M, Behbehani K, Dehbi M and Dermime S. IL-33 is negatively associated with the BMI and confers a
protec-tive lipid/metabolic profile in non-diabetic but
not diabetic subjects. BMC Immunol 2014; 15: 19.
[13] Caner S, Usluogullari CA, Balkan F, Buyukcam F, Kaya C, Sacikara M, Koca C, Ersoy R and Ca-kir B. Is IL-33 useful to detect early stage of renal failure? Ren Fail 2014; 36: 78-80. [14] Deepa M, Pradeepa R, Rema M, Mohan A,
Deepa R, Shanthirani S and Mohan V. The Chennai Urban Rural Epidemiology Study (CURES)--study design and methodology (ur-ban component) (CURES-I). J Assoc Physicians India 2003; 51: 863-870.
[15] Madhumitha H, Mohan V, Deepa M, Babu S and Aravindhan V. Increased Th1 and sup-pressed Th2 serum cytokine levels in subjects with diabetic coronary artery disease. Cardio-vasc Diabetol 2014; 13: 1.
[17] Levey AS, Stevens LA, Schmid CH, Zhang YL, Castro AF 3rd, Feldman HI, Kusek JW, Eggers P, Van Lente F, Greene T and Coresh J. A new
equation to estimate glomerular filtration rate.
Ann Intern Med 2009; 150: 604-612. [18] Navarro JF and Mora C. Diabetes, inflamma
-tion, proinflammatory cytokines, and diabetic nephropathy. ScientificWorldJournal 2006; 6:
908-917.
[19] Moon JY, Jeong KH, Lee TW, Ihm CG, Lim SJ and Lee SH. Aberrant recruitment and activa-tion of T cells in diabetic nephropathy. Am J Nephrol 2012; 35: 164-174.
[20] Surendar J, Mohan V, Rao MM, Babu S and Aravindhan V. Increased levels of both Th1 and Th2 cytokines in subjects with metabolic syn-drome (CURES-103). Diabetes Technol Ther 2011; 13: 477-482.
[21] Pacifico L, Di Renzo L, Anania C, Osborn JF, Ip -politi F, Schiavo E and Chiesa C. Increased T-helper interferon-gamma-secreting cells in obese children. Eur J Endocrinol 2006; 154: 691-697.
[22] Kintscher U, Hartge M, Hess K, Foryst-Ludwig A, Clemenz M, Wabitsch M, Fischer-Posovszky P, Barth TF, Dragun D, Skurk T, Hauner H, Bluher M, Unger T, Wolf AM, Knippschild U,
Hombach V and Marx N. T-lymphocyte infiltra -tion in visceral adipose tissue: a primary event
in adipose tissue inflammation and the devel -opment of obesity-mediated insulin resistance. Arterioscler Thromb Vasc Biol 2008; 28: 1304-1310.
[23] Winer S, Chan Y, Paltser G, Truong D, Tsui H, Bahrami J, Dorfman R, Wang Y, Zielenski J, Mastronardi F, Maezawa Y, Drucker DJ, Engle-man E, Winer D and Dosch HM. Normalization of obesity-associated insulin resistance through immunotherapy. Nat Med 2009; 15: 921-929.
[24] Mishra M, Kumar H, Bajpai S, Singh RK and Tripathi K. Level of serum IL-12 and its correla-tion with endothelial dysfunccorrela-tion, insulin
resis-tance, proinflammatory cytokines and lipid pro
-file in newly diagnosed type 2 diabetes.
Diabetes Res Clin Pract 94: 255-261. [25] Suarez-Alvarez K, Solis-Lozano L,
Leon-Cabre-ra S, Gonzalez-Chavez A, Gomez-Hernandez G, Quinones-Alvarez MS, Serralde-Zuniga AE, Hernandez-Ruiz J, Ramirez-Velasquez J, Galin-do-Gonzalez FJ, Zavala-Castillo JC, De Leon-Nava MA, Robles-Diaz G and Escobedo G. Se-rum IL-12 is increased in Mexican obese
subjects and associated with low-grade inflam -mation and obesity-related parameters.
Medi-ators Inflamm 2013: 967067.
[26] Jiang LQ, Franck N, Egan B, Sjogren RJ, Kata-yama M, Duque-Guimaraes D, Arner P, Zierath JR and Krook A. Autocrine role of interleu-kin-13 on skeletal muscle glucose metabolism in Type 2 diabetic patients involves microRNA let-7. Am J Physiol Endocrinol Metab 2013; 305: E1359-66.
[27] Chang YH, Ho KT, Lu SH, Huang CN and Shiau MY. Regulation of glucose/lipid metabolism and insulin sensitivity by interleukin-4. Int J Obes (Lond) 2011; 36: 993-998.
[28] Dronavalli S, Duka I and Bakris GL. The patho-genesis of diabetic nephropathy. Nat Clin Pract Endocrinol Metab 2008; 4: 444-452.
[29] Wu CC, Chen JS, Lu KC, Chen CC, Lin SH, Chu P, Sytwu HK and Lin YF. Aberrant cytokines/ chemokines production correlate with protein-uria in patients with overt diabetic nephropa-thy. Clin Chim Acta 2010; 411: 700-704. [30] Bending JJ, Lobo-Yeo A, Vergani D and Viberti
Table S2. Logistic regression analysis with disease phenotype as dependent variable
Th1/Th2 Cytokines
NGT AND DM DM AND DN
Sig. OR Lower95% C.I.Upper Sig. OR Lower95% C.I.Upper
IL-2 A .462 1.000 .998 1.001 .917 1.005 .909 1.112
B .976 1.000 .998 1.002 .952 1.003 .907 1.109
C .253 .998 .994 1.002 .813 1.012 .916 1.119
IL-12 A .435 .999 .996 1.002 .001 1.250 1.126 1.388
B .713 1.001 .995 1.007 .001 1.246 1.123 1.384
C .482 1.002 .996 1.009 .001 1.239 1.117 1.376
IFN-γ A .142 1.000 1.000 1.001 .001 1.020 1.011 1.030
B .692 1.000 1.000 1.001 .001 1.020 1.011 1.029
C .352 1.000 1.000 1.001 .001 1.019 1.010 1.029
IL-4 A .873 1.003 .963 1.045 .034 .199 .045 .882
B .292 1.044 .964 1.130 .036 .204 .046 .900
C .410 1.047 .938 1.169 .028 .193 .045 .839
IL-5 A .864 .999 .993 1.006 .150 1.331 .902 1.963
B .275 .993 .980 1.006 .156 1.322 .899 1.944
C .329 .991 .974 1.009 .106 1.369 .935 2.003
IL-13 A .003 1.005 1.002 1.008 .001 .427 .300 .609
B .004 1.008 1.003 1.014 .001 .432 .304 .616
C .499 1.002 .996 1.009 .001 .441 .310 .627
IL-33 A .001 .994 .991 .998 .024 .997 .994 0.998
B .155 .992 .982 1.003 .025 .997 .994 0.998
C .487 0.996 1.008 1.233 .031 .997 .994 0.998
[image:9.612.91.523.363.678.2]A-unadjusted, B-adjusted for Fasting plasma glucose, C-adjusted for glycated hemoglobin, OR-Odds Ratio, CI-confidence inter -val.
Table S1. Spearman’s correlation analysis of Th-1/Th-2 cytokines with the clinical parameters
Parameters r value IL-2 IL-12 IFN-g IL-4 IL-5 IL-13 IL-33
Age -.038 .007 -.021 -.012 .066 .107 -.046
BMI -.001 .013 -.010 .052 -.022 -.038 -.151*
Systolic BP .104 .056 -.007 -.013 .038 .002 -.161*
Diastolic BP .044 .020 -.049 -.039 .023 .029 -.158*
FPG .149* .172* .167* .156* .172* .065 -.284**
CHO -.126 .037 -.160* -.153* .051 .172* .067
TRI .018 .117 -.025 .026 .070 .134 -.216**
HDL -.025 -.028 -.001 -.098 -.008 -.016 .147*
LDL -.144* .041 -.160* -.164* .088 .170* .153*
VLDL .007 .127 -.010 .046 .074 .187** -.189*
Hb1AC .117 .154* .185** .183** .136* .066 -.320**
Urea .049 .022 -.009 -.048 -.020 -.179** .007
Creatinine .187** -.053 .033 .027 -.077 -.287** -.013
Malb .088 .122 .015 .034 -.075 -.259** -.308**
GFR -.107 -.028 -.001 .032 -.147* -.047 -.117