Original Article
DNA microarray reveals different pathways
responding to paclitaxel and docetaxel
in non-small cell lung cancer cell line
Chun-Li Che1, Yi-Mei Zhang1, Hai-Hong Zhang2, Yu-Lan Sang1, Ben Lu1, Fu-Shi Dong1, Li-Juan Zhang1, Fu-Zhen Lv3
1Department of respiratory medicine, First Clinical Medical College affiliated to Harbin Medical University, Harbin,
China; 2Department of rheumatism and immunology, First Clinical Medical College affiliated to Harbin Medical
University, Harbin, China; 3Department of respiratory medicine, Second Clinical Medical College affiliated to Har
-bin Medical University, Har-bin, China
Received June 20, 2013; Accepted July 5, 2013; Epub July 15, 2013; Published August 1, 2013
Abstract: The wide use of paclitaxel and docetaxel in NSCLC clinical treatment makes it necessary to find biomark -ers for identifying patients who can benefit from paclitaxel or docetaxel. In present study, NCI-H460, a NSCLC cell line with different sensitivity to paclitaxel and docetaxel, was applied to DNA microarray expression profiling analysis at different time points of lower dose treatment with paclitaxel or docetaxel. And the complex signaling pathways regulating the drug response were identified, and several novel sensitivity-realted markers were biocomputated. The dynamic changes of responding genes showed that paclitaxel effect is acute but that of docetaxel is durable at least for 48 hours in NCI-H460 cells. Functional annotation of the genes with altered expression showed that genes/pathways responding to these two drugs were dramatically different. Gene expression changes induced by paclitaxel treatment were mainly enriched in actin cytoskeleton (ACTC1, MYL2 and MYH2), tyrosine-protein ki-nases (ERRB4, KIT and TIE1) and focal adhesion pathway (MYL2, IGF1 and FLT1), while the expression alterations responding to docetaxel were highly co-related to cell surface receptor linked signal transduction (SHH, DRD5 and ADM2), cytokine-cytokine receptor interaction (IL1A and IL6) and cell cycleregulation (CCNB1, CCNE2 and PCNA). Moreover, we also confirmed some different expression patterns with real time PCR. Our study will provide the po -tential biomarkers for paclitaxel and docetaxel-selection therapy in clinical application.
Keywords: Non-small cell lung cancer, paclitaxel, docetaxel, microarray
Inroduction
Non-small cell lung cancer (NSCLC) accounts for approximately 80-85% of all cases of lung cancer [1], the leading cause of cancer-related death in both men and women in the world. Unfortunately, at the time of diagnosis, the majority of patients already have locally advanced or metastatic disease and a system-ic, palliative treatment is one of few therapeutic options.
Paclitaxel alone or combination with carboplat-in has been approved by FDA to treat advanced or metastatic NSCLC. Docetaxel, the second taxoid derivative, has also shown anti-tumor activity in NSCLC, and numerous clinical trials evaluating the therapeutic effect of docetaxel
treatment. The differential expres-sion of genes was verified by quan-titative real-time PCR (qPCR) and the correlation between DNA microarray-based and qPCR-based gene expression changes was also analyzed.
Materials and methods
Cell culture
8]. Not all NSCLC patients will benefit from the same treatment, and the involved molecular mechanisms are still largely unknown. So, it is urgent to figure out the biomarkers to define patient subsets with distinct sensitivities to paclitaxel or docetaxel.
There are different methods to investigate the potential biomarkers for chemosensitivity pre-diction in vitro. The mostly used is comparison of gene expression profiles between the drug-resistant strain and its parental strain. As it employs high dose drugs to treat cancer cells and needs almost half a year to construct a drug-resistant strain, it is a time-consuming method. Recently, it was suggested that infor-mation on drug dose-dependent effects at a lower, unsaturated range of concentrations would be critically important to understand drug actions in vivo [9, 10]. In this method, dynamic changes of gene expression would help us identify novel predictive genes of sensi-tivity to these agents and the candidate genes that may be targeted to counteract drug resis-tance and increase therapeutic efficacy of the drugs.
In this study, NCI-H460, a NSCLC cell line showed different sensitivity to paclitaxel and docetaxel, was treated with paclitaxel or docetaxel for 24 or 48 h. And then DNA micro-array expression profiling was employed to ana-lyze the complex signaling pathways regulating the response to paclitaxel or docetaxel to iden-tify sensitivity biomarkers of these two taxanes. The dynamic changes of responsive genes showed that the effect of paclitaxel treatment is acute but that of docetaxel is long lasting at least for 48 hours in NCI-H460, which was in line with previous reports [11]. Pathway analy-sis indicated that distinct pathways were active to respond to the paclitaxel and docetaxel
NCI-H460 cell line was purchased from ATCC (HTB-177) and maintained in DMEM medium supplemented with 10% FBS (Hyclone), penicil-lin (100 IU/ml) and Streptomycin (100 μg/ml) (Life Technologies).
MTS assay for NCI-H460 cell viability
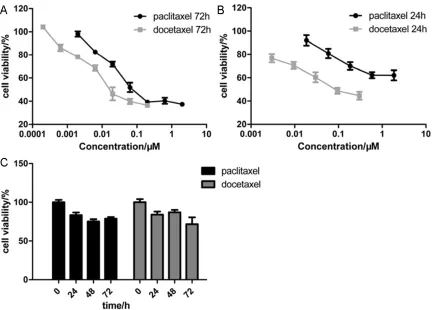
NCI-H460 cells (4 × 10³) were grown in 100 μl of DMEM medium containing serum per well in a 96-well plate. After 24 h, the cells were treat-ed with paclitaxel (0, 2, 6.3, 20, 63, 200, 630, 2000 nmol/L, respectively) or docetaxel (0, 0.2, 0.63, 2, 6.3, 20, 63 and 200 nmol/L, respectively) for 72 h. Every treatment was trip-licate in the same experiment. Then 20 μl of MTS (CellTiter 96 AQueous One Solution Reagent; Promega) was added to each well for 1 to 4 h at 37°C. After incubation, the absor-bance was read at a wavelength of 490 nm according to the manufacturer’s protocol. The IC50 calculation was performed with GraphPad Prism 5.0 software.
The concentrations of paclitaxel and docetaxel at which NCI-H460 cell viability was suppressed by 10% or so in 24 h were determined as follow: NCI-H460 cells were treated with paclitaxel (0, 18.5, 58.5, 185, 585 and 1850 nmol/L, respectively) or docetaxel (0, 3, 9, 30, 90 and 300 nmol/L, respectively) for 24 h. Every treat-ment was triplicate in the same experitreat-ment. The cell viability was examined as above mentioned.
[image:2.612.90.362.82.191.2]The time-course of paclitaxel or docetaxel treatment was carried out as follow: NCI-H460 cells were treated with paclitaxel (6.3 nmol/L) or docetaxel (0.63 nmol/L) for 0, 24, 48 and 72 h, respectively. Every treatment was triplicate in the same experiment. The cell viability was examined as above mentioned.
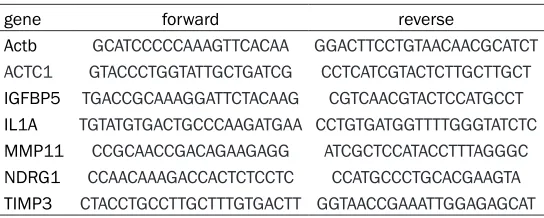
Table 1. Primers used for qPCR validation
gene forward reverse
Actb GCATCCCCCAAAGTTCACAA GGACTTCCTGTAACAACGCATCT ACTC1 GTACCCTGGTATTGCTGATCG CCTCATCGTACTCTTGCTTGCT
IGFBP5 TGACCGCAAAGGATTCTACAAG CGTCAACGTACTCCATGCCT
IL1A TGTATGTGACTGCCCAAGATGAA CCTGTGATGGTTTTGGGTATCTC
MMP11 CCGCAACCGACAGAAGAGG ATCGCTCCATACCTTTAGGGC
NDRG1 CCAACAAAGACCACTCTCCTC CCATGCCCTGCACGAAGTA
Microarray analysis
NCI-H460 cells (8 × 10⁴) were grown in 2 ml of DMEM medium containing serum per well in a 6-well plate. After 24 h, the cells were treated with paclitaxel (6.3 nmol/L) or docetaxel (0.63 nmol/L) for 0, 24 and 48 h, respectively. Every treatment was duplicated in the same experi-ment. All the samples were homogenized with 1 ml Trizol (Invitrogen, Life Technologies) and total RNAs were extracted according to the manufacturer’s instruction.
500 ng total RNA was used to synthesize dou-ble-strand cDNA and in vitro transcribed to cRNA, purified 10 μg cRNA was used to synthe-size 2nd-cycle cDNA and then hydrolyzed by RNase H and purified. Above steps were per-formed with Ambion WT Expression Kit. 5.5 μg 2nd-cycle cDNA was fragmented and the
sin-gle-stranded cDNA was labeled with GeneChip2 WT Terminal Labeling Kit and Controls Kit (Affymetrix, PN 702880). About 700 ng frag-mented and labeled single-stranded cDNA were hybridized to an Affymetrix GeneChip Human Gene 1.0 ST array, which was washed and stained with GeneChip2 Hybridization, Wash and Stain kit (Affymetrix).
Microarray data analysis was done using Significance Analysis of Microarrays (SAM) method, as described before [12]. Functional annotation was performed to the differential expression genes with DAVID 6.7 online software.
Quantitative real-time PCR (qPCR)
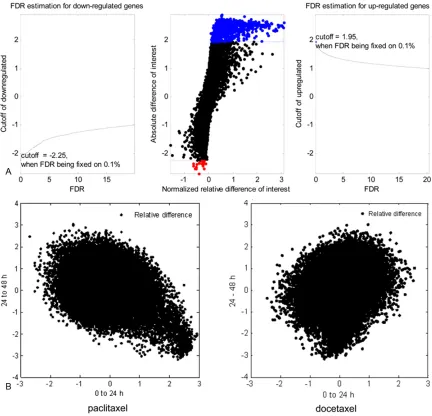
[image:3.612.91.523.69.379.2]Figure 2. Microarray data analysis. A: Selection of significantly altered genes. The normalized relative difference of gene expression following paclitaxel treatment from 0 to 24 h was calculated by SAM method. Left: for down-regu-lated genes, when false discovery rate (FDR) was fixed on 0.1%, cutoff value of the normalized relative difference was -2.25. Genes with relative difference lower than -2.25 were identified as significantly down-regulated genes. Right: for up-regulated genes, when FDR was fixed on 0.1%, cutoff value of the normalized relative difference was 1.95. Genes with relative difference higher than 1.95 were identified as significantly up-regulated genes. Middle: criterions above mentioned were applied to all genes on the microarray chip, significantly up-regulated genes were labeled with blue dots and significantly down-regulated genes were dotted with red color. B: Dynamic changes of gene expression patterns between paclitaxel and docetaxel treatment at two time stages. All genes were dotted by their normalized relative difference value between two stages: 0-24 h and 24-48 h.
gDNA Eraser (Takara, RR074A) for RT-PCR with mixture of oligo-dT and Random Primer (9 mer). The primers used for qPCR validation were list in Table 1. Real-time qPCR was performed on CFX-96 (Bio-lab), with endogenous control hActb. Gene expression was calculated relative to expression of hActb endogenous control and adjusted relative to expression in untreated
control cells (paclitaxel) or treated cells (docetaxel at 24 h).
Statistical analysis
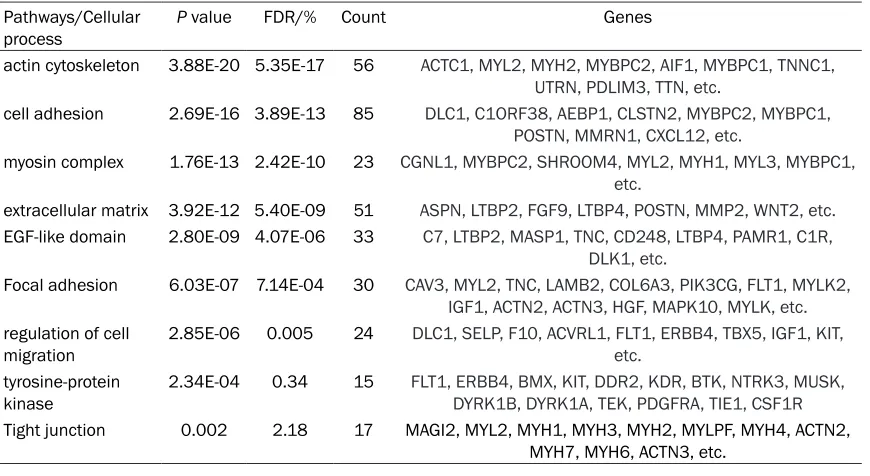
Table 2. GSEA for paclitaxel induced genes
Pathways/Cellular
process P value FDR/% Count Genes
actin cytoskeleton 3.88E-20 5.35E-17 56 ACTC1, MYL2, MYH2, MYBPC2, AIF1, MYBPC1, TNNC1, UTRN, PDLIM3, TTN, etc.
cell adhesion 2.69E-16 3.89E-13 85 DLC1, C1ORF38, AEBP1, CLSTN2, MYBPC2, MYBPC1, POSTN, MMRN1, CXCL12, etc.
myosin complex 1.76E-13 2.42E-10 23 CGNL1, MYBPC2, SHROOM4, MYL2, MYH1, MYL3, MYBPC1, etc.
extracellular matrix 3.92E-12 5.40E-09 51 ASPN, LTBP2, FGF9, LTBP4, POSTN, MMP2, WNT2, etc.
EGF-like domain 2.80E-09 4.07E-06 33 C7, LTBP2, MASP1, TNC, CD248, LTBP4, PAMR1, C1R, DLK1, etc.
Focal adhesion 6.03E-07 7.14E-04 30 CAV3, MYL2, TNC, LAMB2, COL6A3, PIK3CG, FLT1, MYLK2, IGF1, ACTN2, ACTN3, HGF, MAPK10, MYLK, etc.
regulation of cell
migration 2.85E-06 0.005 24 DLC1, SELP, F10, ACVRL1, FLT1, ERBB4, TBX5, IGF1, KIT, etc.
tyrosine-protein
kinase 2.34E-04 0.34 15 FLT1, ERBB4, BMX, KIT, DDR2, KDR, BTK, NTRK3, MUSK, DYRK1B, DYRK1A, TEK, PDGFRA, TIE1, CSF1R
Tight junction 0.002 2.18 17 MAGI2, MYL2, MYH1, MYH3, MYH2, MYLPF, MYH4, ACTN2,
MYH7, MYH6, ACTN3, etc.
Results
NCI-H460 cells showed different sensitivity to
paclitaxel and docetaxel
To determine chemosensitivity of NCI-H460 to paclitaxel or docetaxel, NCI-H460 cells were treated with the two drugs at seven different concentrations for 72 h, cell viability was
[image:5.612.86.525.91.543.2]0.034 μmol/L. So, NCI-H460 cell line is sensi-tive to docetaxel, but shows resistance to paclitaxel.
Furthermore, we examined the IC50 of NCI-H460 cells to paclitaxel or docetaxel at the time point of 24 h. Five different concentrations of paclitaxel or docetaxel were administrated to NCI-H460 cells for 24 h. The IC50 of NCI-H460 to paclitaxel at 24 h is 4.496 μmol/L (R2 = 0.86), to docetaxel at 24 h is 0.116 μmol/L (R2 = 0.98) (Figure 1B). The sensitivity difference of NCI-H460 cells to paclitaxel or docetaxel at 24 h is more significant than that at 72 h.
And then, a relatively lower concentration of 6.3 nmol/L of paclitaxel or 0.63 nmol/L of docetaxel was selected to treat NCI-H460 cells for 0, 24, 48 and 72 h. The concentrations were far lower than their corresponding IC50 doses. The time-course curves of paclitaxel and docetaxel treatment were present in Figure 1C. The results showed that when treated with the lower concentrations of paclitaxel or docetaxel for 24 and 48 h, NCI-H460 cell viability was suppressed by 20% or so. At these conditions, cell growth was moderately inhibited and cell apoptosis or death-associated pathways may be not activated severely and that the expres-sion changes of chemosensitivity-involved genes may be relatively marked. Then the cell
samples treated with lower concentrations of paclitaxel or docetaxel for 0, 24 and 48 h were collected for DNA microarray analysis.
Gene expression analysis
[image:6.612.91.527.83.316.2]NCI-H460 cells were treated with 6.3 nmol/L paclitaxel or 0.63 nmol/L docetaxel for 0, 24 and 48 hours (Figure 1C). Following paclitaxel treatment,the expressionof 992 genes were increased (FDR ≤ 0.1%) and only that of 10 genes were decreased (FDR ≤ 0.1%) compared with the untreated cells at 24 h (Figure 2A). While there were 303 genes showed increased expression (FDR ≤ 0.1%) and 667 genes showed decreased expression (FDR ≤ 0.1%) from 24 h to 48 h. When treated with docetax-el, 153 (FDR ≤ 5%) and 1254 genes (FDR ≤ 0.01%) showed increased expression at two time stages: 0-24 h and 24-48 h respectively, yet 72 (FDR ≤ 5%) and 206 genes (FDR ≤ 0.01%) showed decreased expression at the corresponding time stages, respectively. And then we investigated the correlation of gene expression alterations between 0-24 h (stage 1) and 24-48 h (stage 2) after paclitaxel or docetaxel treatment (Figure 2B). The results showed that gene expression alterations induced by paclitaxel in the 2 stages are nega-tively correlated, which indicated that the cel-lular response to paclitaxel is fast, and the gene expression has been mostly changed in
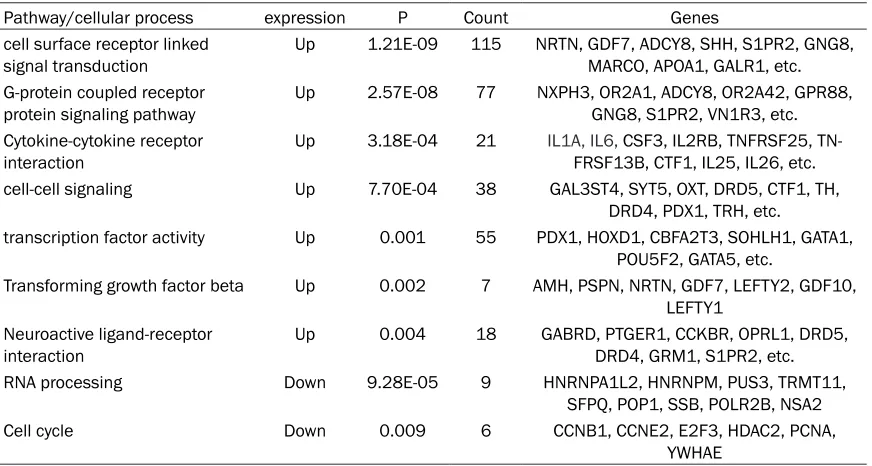
Table 3. GSEA for docetaxel induced or suppressed genes
Pathway/cellular process expression P Count Genes
cell surface receptor linked
signal transduction Up 1.21E-09 115 NRTN, GDF7, ADCY8, SHH, S1PR2, GNG8, MARCO, APOA1, GALR1, etc.
G-protein coupled receptor
protein signaling pathway Up 2.57E-08 77 NXPH3, OR2A1, ADCY8, OR2A42, GPR88, GNG8, S1PR2, VN1R3, etc. Cytokine-cytokine receptor
interaction Up 3.18E-04 21 IL1A, IL6, FRSF13B, CTF1, IL25, IL26, etc.CSF3, IL2RB, TNFRSF25,
TN-cell-cell signaling Up 7.70E-04 38 GAL3ST4, SYT5, OXT, DRD5, CTF1, TH,
DRD4, PDX1, TRH, etc.
transcription factor activity Up 0.001 55 PDX1, HOXD1, CBFA2T3, SOHLH1, GATA1,
POU5F2, GATA5, etc.
Transforming growth factor beta Up 0.002 7 AMH, PSPN, NRTN, GDF7, LEFTY2, GDF10,
LEFTY1 Neuroactive ligand-receptor
interaction Up 0.004 18 GABRD, PTGER1, CCKBR, OPRL1, DRD5, DRD4, GRM1, S1PR2, etc.
RNA processing Down 9.28E-05 9 HNRNPA1L2, HNRNPM, PUS3, TRMT11,
SFPQ, POP1, SSB, POLR2B, NSA2
Cell cycle Down 0.009 6 CCNB1, CCNE2, E2F3, HDAC2, PCNA,
YWHAE
the first 24 h and then probably came back to its resting state in the second 24 h. But for docetaxel, gene expression alterations in the 2 stages are roughly correlated, which suggested that the cellular response to docetaxel is slow and could last for more than 48 h. So, it is rea-sonable to compare the differential expression profiles between paclitaxel from 0 to 24 h and docetaxel from 24 to 48 h to observe the dis-tinct genes/pathways responding to these two drugs, respectively.
Functional annotation showed that genes/ pathways responding to these two drugs were dramatically different. Gene expression altera-tions induced by paclitaxel treatment were mainly enriched in actin cytoskeleton (ACTC1, MYL2 and MYH2), cell adhesion pathway, extra-cellular matrix, regulation of cell migration and tyrosine-protein kinase (ERRB4, KIT and TIE1) (Table 2, Figure 3A), while gene expression changes responding to docetaxel stimulation
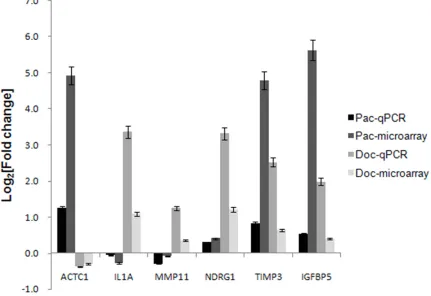
[image:7.612.91.522.77.373.2]were enriched in cell surface receptor linked signal transduction (SHH, DRD5 and ADM2), cytokine-cytokine receptor interaction (IL1A and IL6) and cell cycleregulators (CCNB1, CCNE2 and PCNA) (Table 3, Figure 3B). Following paclitaxel treatment (24 h vs 0 h), the most relevant significantly upregulated genes were involved in focal adhesion pathway (MYL2, MYLK2, IGF1, FLT1, ACTN2 and PDGFA) andty-rosine-protein kinase (FLT1, ERBB4, KIT, PDGFRA and TIE1). While after docetaxel treat-ment (48 h vs 24 h), the most relevant signifi-cantly upregulated genes were CCND2 (3.1-fold, p = 0.006), IL1B (2.8-(3.1-fold, p = 0.0008) and those genes involved in cytokine-cytokine receptor interaction pathway (SHH, DRD5 and ADM2) and neuroactive ligand-receptor interac-tion pathway (CCKBR, DRD5, DRD4, HRH3, GALR3, HTR6 and GIPR), the most relevant sig-nificantly downregulated genes were CCNB1 (3.5-fold, p = 0.0007), CCNE1 (3.3-fold, p = 0.005) and those linked to RNA processing. Figure 4.qPCR validation of microarray results. Fold change in six gene expression levels, as determined by mi
-croarray and qPCR analysis was log2 transformed in histogram. Pac-qPCR, fold change determined by qPCR after
paclitaxel treatment from 0 to 24 h; Pac-microarray, fold change determined by microarray after paclitaxel treatment
The different genes/pathways responding to paclitaxel or docetaxel treatment may reflect to some extent the chemosensitivity of NCI-H460 cells to these two drugs.
Validation of microarray results
Quantitative real-time PCR (qPCR) was used to verify the expression of 6 genes differentially expressed after paclitaxel or docetaxel treat-ment. The expression change determined by microarray and qPCR were showed in Figure 4. For ACTC1, a member of actin cytoskeleton, microarray data showed its expression was induced to 23-fold by paclitaxel but repressed by 19% following docetaxel treatment, qPCR results showed that its expression was increased to 2.4-fold after paclitaxel treatment but suppressed by 23% following docetaxel treatment. Although there was variation in change folds determined by these two meth-ods, the expression trends were consistent. For the other five genes, IL1A, MMP11, NDRG1, TIMP3 and IGFBP5, the situation is the same. Within these genes, ACTC1 was specifically induced by paclitaxel, while IL1A, MMP11 and NDRG1 were specifically induced by docetaxel. For these 6 genes, the average fold change in gene expression levels, as determined by microarray and qPCR analysis, was log2 trans-formed and the correlation between both data sets examined using R2. An R2 value of 0.84 (P = 0.09) was calculated following paclitaxel treatment. While for docetaxel treatment, R2 value was 0.98 (P = 0.04). Collectively, these data suggest a strong overall concordance of expression trends between the microarray and qPCR data for both paclitaxel and docetaxel-responding genes.
Discussion
The clinical wide use of paclitaxel and docetax-el in NSCLC treatment makes it necessary to find biomarkers for identifying patients who can benefit from paclitaxel or docetaxel. In this work, we have used DNA microarray expression profiling to analyze the complex signaling path-ways regulating the response to paclitaxel and docetaxel and to identify novel predictive mark-ers for sensitivity to these agents and candi-date genes that may be targeted to counteract drug resistance and increase therapeutic effi-cacy. The dynamic changes of gene expression between two time stages indicated that these
two taxanes has different pharmacological mechanism. Subsequent functional annotation also showed that responsive genes/pathways to paclitaxel and docetaxel were totally distinct.
In this study, NCI-H460 cells were treated with different doses of paclitaxel or docetaxel for 72 or 24 h. It showed that NCI-H460 cell line was resistant to paclitaxel but sensitive to docetax-el. This different sensitivity to the two taxanes and hence are suitable for research on the mechanisms leading to this difference. Recently, it was suggested that information on drug dose-dependent effects at a lower, unsat-urated range of concentrations would be criti-cally important to understand drug actions in vivo [9]. Another reports showed that dynamic changes of gene expression at different time points following drugs treatment may help us understand deeply into the intrinsic mecha-nisms of drug effect [10]. Following the previ-ous reports, a concentration of paclitaxel or docetaxel far lower than their IC50 doses at 72 h was used to treat NCI-H460 cells for 0, 24 and 48 h. It is supposed that when treated with these lower drug doses, cell growth was moder-ately inhibited and cell apoptosis or death-associated pathways may be not activated severely and that the expression changes of chemosensitivity-involved genes may be rela-tively marked. Actually, our microarray data showed that expressions of those genes linked to cell apoptosis, such as TP53, BAX and BCL2, were not significantly altered after either pacli-taxel or docepacli-taxel treatment. This result is in accord with our hypothesis in some ways. It will be more meaningful when two or more cell lines derived from the same type of cancer are used to study drug actions according to this method, i.e., lower dose and several time points treatments.
DNA microarray is a widely used tool for primary screening gene signatures differentially expressed in different tissues or cell lines, sometimes after distinct treatments [13-17]. To
than 48 h, see Figure 2B). Our results are con-sistent with previous reports [11, 19]. In clinic, paclitaxel is administrated to patients at 60-80 mg/m2 weekly, while docetaxel is administrat-ed to patients at 75 or 100 mg/m2 every 3 weeks.
Our data showed that the expression altera-tions of genes/pathways responsive to pacli-taxel (0-24 h) were mainly enriched in actin cytoskeleton, myosin complex, cell adhesion, focal adhesion and tight adhesion (Table 2,
Figure 3A). It was suggested that expression of β-tubulin isotypes [20], member or regulator of the actin cytoskeleton, such as γ-actin [21] and LIMK2 [22], and the extracellular matrix protein transforming growth factor-β induced (TGFBI) [23] was correlated with paclitaxel sensitivity in various cancers. These results overlap to a con-siderable degree with our data. The fact that 56 members of actin cytoskeleton were signifi-cantly induced by paclitaxel indicated that actin cytoskeleton may be important to mediate paclitaxel sensitivity. Moreover, as the most rel-evant significantly upregulated genes were involved in focal adhesion pathway after pacli-taxel treatment, these genes are also needed to be further studied. Interestingly, microarray data showed that expression of some receptor tyrosine-protein kinases (RTKs), such as ERRB4, KIT and TIE1, was significantly induced by paclitaxel, indicating that RTKs inhibition may sensitize cancer cells to paclitaxel. Report from Coley et al. showed that RTK inhibition really made ovarian cancer cells more sensitive to paclitaxel [24]. The mechanism by which RTK mediates sensitivity to paclitaxel and whether RTK has a role in paclitaxel resistance in can-cer types other than ovarian cancan-cer remain to be determined.
Previous studies have demonstrated that p-gly-coprotein, CYP3A4, genes linked to cell cycle (HER2, BRCA1 and AURKA), apoptosis (p53, Bcl-2, thioredoxin) and cell proliferation (MIB-1, nuclear grade) were associated to docetaxel sensitivity in breast cancer [25]. Recently, it was reported that genes associated with drug resistance and stemness were correlated to docetaxel resistance in NSCLC cell lines [26]. Our microarray data showed that the expres-sion level changes of gene responding to docetaxel were enriched in cell surface recep-tor linked signal transduction, cytokine-cyto-kine receptor interaction, cell cycle regulation
and RNA processing (Table 3, Figure 3B). Many genes associated to cytokine-cytokine receptor interaction were induced by docetaxel, such as IL1B, IL26 and IL28B. Recently, Yang reported that TR4-Oct4-IL1Ra axis may play a critical role in the development of chemo-resistance in the prostate cancerstem/progenitor cells [27]. Sakai reported that IL6 scilencing senstisized prostate cancer cell PC3 to docetaxel [28]. So, it is possible that IL1B, IL26 and IL28B can play roles in mediating sensitivity of NSCLC cells to docetaxel. Additional, our data also showed that docetaxel could suppress the expression of some cell cycle genes, such as CCNB1 and CCNE2. As NCI-H460 cells were sensitive to docetaxel, the decreased expression of CCNB1 and CCNE2 may indicate that NCI-H460 cells are on the verge of being arrested in cell cycle. Collectively, our data suggested that NCI-H460 cells were responded to paclitaxel and docetax-el through totally different pathways, respec-tively, and these different pathways may be potential biomarkers for paclitaxel and docetax-el. The roles of many interesting genes, such as RTKs and focal adhesion-associated genes for paclitaxel as well as interlukins and cyclins for docetaxel, warrant functional validation in more NSCLC cell lines.
Acknowledgments
We gratefully acknowledge Michael Li, Simon Xiong, and Yi-hui Lin for helpful discussion, William Niu for the technical supports of micro-array data analysis.
Address correspondence to: Dr. Fu-Zhen Lv, Department of respiratory medicine, Second Clinical Medical College affiliated to Harbin Medical University, Harbin, China. E-mail: [email protected]
References
[1] Gridelli C, Aapro M, Ardizzoni A, Balducci L, De Marinis F, Kelly K, Le Chevalier T, Manegold C, Perrone F, Rosell R, Shepherd F, De Petris L, Di Maio M and Langer C. Treatment of advanced non-small-cell lung cancer in the elderly: re-sults of an international expert panel. J Clin Oncol 2005; 23: 3125-3137.
Andreotti PE and Cree IA. Resistance gene ex-pression determines the in vitro chemosensi-tivity of non-small cell lung cancer (NSCLC). BMC Cancer 2009; 9: 300.
[3] Schiller JH, Harrington D, Belani CP, Langer C, Sandler A, Krook J, Zhu J, Johnson DH and Eastern Cooperative Oncology G. Comparison of four chemotherapy regimens for advanced non-small-cell lung cancer. N Engl J Med 2002; 346: 92-98.
[4] Kelly K, Crowley J, Bunn PA Jr, Presant CA, Grevstad PK, Moinpour CM, Ramsey SD, Woz-niak AJ, Weiss GR, Moore DF, Israel VK, Liv-ingston RB and Gandara DR. Randomized phase III trial of paclitaxel plus carboplatin ver-sus vinorelbine plus cisplatin in the treatment of patients with advanced non--small-cell lung cancer: a Southwest Oncology Group trial. J Clin Oncol 2001; 19: 3210-3218.
[5] Fossella F, Pereira JR, von Pawel J, Pluzanska A, Gorbounova V, Kaukel E, Mattson KV, Ram-lau R, Szczesna A, Fidias P, Millward M and Belani CP. Randomized, multinational, phase III study of docetaxel plus platinum combina-tions versus vinorelbine plus cisplatin for ad-vanced non-small-cell lung cancer: the TAX 326 study group. J Clin Oncol 2003; 21: 3016-3024.
[6] Socinski MA, Schell MJ, Peterman A, Bakri K, Yates S, Gitten R, Unger P, Lee J, Lee JH, Tynan M, Moore M and Kies MS. Phase III trial com-paring a defined duration of therapy versus continuous therapy followed by second-line therapy in advanced-stage IIIB/IV non-small-cell lung cancer. J Clin Oncol 2002; 20: 1335-1343.
[7] Ramalingam S and Belani C. Systemic chemo-therapy for advanced non-small cell lung can-cer: recent advances and future directions. Oncologist 2008; 13 Suppl 1: 5-13.
[8] Pusztai L. Markers predicting clinical benefit in breast cancer from microtubule-targeting agents. Ann Oncol 2007; 18 Suppl 12: xii15-20.
[9] Coser KR, Chesnes J, Hur J, Ray S, Isselbacher KJ and Shioda T. Global analysis of ligand sen-sitivity of estrogen inducible and suppressible genes in MCF7/BUS breast cancer cells by DNA microarray. Proc Natl Acad Sci USA 2003; 100: 13994-13999.
[10] Boyer J, Allen WL, McLean EG, Wilson PM, Mc-Culla A, Moore S, Longley DB, Caldas C and Johnston PG. Pharmacogenomic identification of novel determinants of response to chemo-therapy in colon cancer. Cancer Res 2006; 66: 2765-2777.
[11] Crown J and O’Leary M. The taxanes: an up -date. Lancet 2000; 355: 1176-1178.
[12] Tusher VG, Tibshirani R and Chu G. Signifi -cance analysis of microarrays applied to the ionizing radiation response. Proc Natl Acad Sci USA 2001; 98: 5116-5121.
[13] Arribas AJ, Campos-Martin Y, Gomez-Abad C, Algara P, Sanchez-Beato M, Rodriguez-Pinilla MS, Montes-Moreno S, Martinez N, Alves-Fer-reira J, Piris MA and Mollejo M. Nodal marginal zone lymphoma: gene expression and miRNA profiling identify diagnostic markers and po -tential therapeutic targets. Blood 2012; 119: e9-e21.
[14] Matkovich SJ, Van Booven DJ, Youker KA, Torre-Amione G, Diwan A, Eschenbacher WH, Dorn LE, Watson MA, Margulies KB and Dorn GW 2nd. Reciprocal regulation of myocardial microRNAs and messenger RNA in human car-diomyopathy and reversal of the microRNA sig-nature by biomechanical support. Circulation 2009; 119: 1263-1271.
[15] Maekawa M, Yamaguchi K, Nakamura T, Shi-bukawa R, Kodanaka I, Ichisaka T, Kawamura Y, Mochizuki H, Goshima N and Yamanaka S. Direct reprogramming of somatic cells is pro-moted by maternal transcription factor Glis1. Nature 2011; 474: 225-229.
[16] Sarwal M, Chua MS, Kambham N, Hsieh SC, Satterwhite T, Masek M and Salvatierra O Jr. Molecular heterogeneity in acute renal al-lograft rejection identified by DNA microarray profiling. N Engl J Med 2003; 349: 125-138. [17] Xu L, Zhang L, Yi Y, Kang HK and Datta SK.
Hu-man lupus T cells resist inactivation and es-cape death by upregulating COX-2. Nat Med 2004; 10: 411-415.
[18] Marcotte ER, Srivastava LK and Quirion R. DNA microarrays in neuropsychopharmacology. Trends Pharmacol Sci 2001; 22: 426-436. [19] Clarke SJ and Rivory LP. Clinical
pharmacoki-netics of docetaxel. Clin Pharmacokinet 1999; 36: 99-114.
[20] Rosell R, Scagliotti G, Danenberg KD, Lord RV, Bepler G, Novello S, Cooc J, Crino L, Sanchez JJ, Taron M, Boni C, De Marinis F, Tonato M, Marangolo M, Gozzelino F, Di Costanzo F, Rin-aldi M, Salonga D and Stephens C. Transcripts in pretreatment biopsies from a three-arm ran-domized trial in metastatic non-small-cell lung cancer. Oncogene 2003; 22: 3548-3553. [21] Verrills NM, Po’uha ST, Liu ML, Liaw TY, Larsen
MR, Ivery MT, Marshall GM, Gunning PW and Kavallaris M. Alterations in gamma-actin and tubulin-targeted drug resistance in childhood leukemia. J Natl Cancer Inst 2006; 98: 1363-1374.
gene expression profiles of 39 human cancer cell lines. Cancer Res 2002; 62: 1139-1147. [23] Ahmed AA, Mills AD, Ibrahim AE, Temple J,
Blenkiron C, Vias M, Massie CE, Iyer NG, Mc-Geoch A, Crawford R, Nicke B, Downward J, Swanton C, Bell SD, Earl HM, Laskey RA, Cal-das C and Brenton JD. The extracellular matrix protein TGFBI induces microtubule stabiliza-tion and sensitizes ovarian cancers to pacli-taxel. Cancer Cell 2007; 12: 514-527. [24] Coley HM, Shotton CF, Ajose-Adeogun A,
Modj-tahedi H and Thomas H. Receptor tyrosine ki-nase (RTK) inhibition is effective in chemosen-sitising EGFR-expressing drug resistant human ovarian cancer cell lines when used in combi-nation with cytotoxic agents. Biochem Pharma-col 2006; 72: 941-948.
[25] Noguchi S. Predictive factors for response to docetaxel in human breast cancers. Cancer Sci 2006; 97: 813-820.
[26] Pasini A, Paganelli G, Tesei A, Zoli W, Giordano E and Calistri D. Specific Biomarkers Are Asso
-ciated with Docetaxeland Gemcitabine-Resis-tant NSCLC Cell Lines. Transl Oncol 2012; 5: 461-468.
[27] Yang DR, Ding XF, Luo J, Shan YX, Wang R, Lin SJ, Li G, Huang CK, Zhu J, Chen Y, Lee SO and Chang C. Increased chemo-sensitivity via tar-geting testicular nuclear receptor 4 (TR4)-Oct4-interleukin 1 receptor antagonist (IL1Ra) axis in prostate cancer CD133+ stem/progeni-tor cells to battle prostate cancer. J Biol Chem 2013; 288: 16476-83.