ORIGINAL RESEARCH
Correlation of Diffusion Tensor and Dynamic
Perfusion MR Imaging Metrics in
Normal-Appearing Corpus Callosum: Support for Primary
Hypoperfusion in Multiple Sclerosis
A.M. Saindane M. Law Y. Ge G. Johnson J.S. Babb R.I. Grossman
BACKGROUND AND PURPOSE: Hypoperfusion of the normal-appearing white matter in multiple scle-rosis (MS) may be related to ischemia or secondary to hypometabolism from wallerian degeneration (WD). This study evaluated whether correlating perfusion and diffusion tensor imaging (DTI) metrics in normal-appearing corpus callosum could provide support for an ischemic mechanism for hypoperfusion.
MATERIALS AND METHODS: Fourteen patients with relapsing-remitting MS (RRMS) and 17 control subjects underwent perfusion MR imaging and DTI. Absolute measures of cerebral blood volume (CBV), cerebral blood flow (CBF), and mean transit time (MTT) were calculated. Mean diffusivity (MD) and fractional anisotropy (FA) maps were computed from DTI data. After visual coregistration of perfusion and DTI images, regions of interest were placed in the genu, central body, and splenium of normal-appearing corpus callosum. Pearson product-moment correlation coefficients were calculated using mean DTI and perfusion measures in each region.
RESULTS: In the RRMS group, CBF and CBV were significantly correlated with MD in the splenium (r⫽ 0.83 andr ⫽0.63, respectively; bothP ⬍.001) and in the central body (r ⫽0.86 andr ⫽0.65, respectively; both P ⬍ .001), but not in the genu (r ⫽ 0.23 and 0.25, respectively; both P is nonsignificant). No significant correlations were found between MTT and DTI measures or between FA and any perfusion measure in the RRMS group. No significant correlations between diffusion and perfusion metrics were found in control subjects.
CONCLUSION:In the normal-appearing corpus callosum of patients with RRMS, decreasing perfusion is correlated with decreasing MD. These findings are more consistent with what would be expected in primary ischemia than in secondary hypoperfusion from WD.
M
ultiple sclerosis (MS) is a chronic inflammatory demy-elinating disease of the central nervous system. Whereas MS has traditionally been characterized on conventional MR imaging by the presence of focal white matter lesions, it has become apparent that pathologic lesions are far from limited to these lesions. Histopathologic and biochemical studies have demonstrated that areas of grossly normal-appearing white matter (NAWM) distant from lesions can exhibit loss of my-elin-specific proteins,1axonal damage and loss,2and perivas-cular infiltration by macrophages and T lymphocytes.3,4Ad-vanced MR imaging techniques, such as proton MR spectroscopy5-7and magnetization transfer imaging,8-10have
supported the concept of diffuse parenchymal abnormality in areas of NAWM on conventional MR imaging.
Using dynamic susceptibility contrast (DSC) enhanced perfusion MR imaging, it has been demonstrated that the NAWM of patients with MS exhibits significantly decreased perfusion compared with that of control subjects.11The
un-derlying basis for this hypoperfusion is unknown, and may be related to ischemia from a primary vascular pathology, or sec-ondary to decreased metabolic demand from processes such as wallerian degeneration (WD) of axons transected in distant lesions. This distinction has important implications for
prog-nosis and treatment, because ischemia may be an early and potentially reversible process, whereas hypometabolism sec-ondary to axonal degeneration implies advanced disease and irreversibility.
Diffusion tensor imaging (DTI) is a technique that quanti-fies the amount of nonrandom water diffusion within tissues, providing information about processes such as ischemia and WD that can affect water diffusion as a result of microstruc-tural damage. The diffusion tensor is calculated from images acquired with diffusion weighting gradients applied in at least 6 noncollinear directions and provides information on both the magnitude and directionality of water diffusion. Mean dif-fusivity (MD) calculated from the tensor provides a measure of average diffusion that is not influenced by patient position-ing or fiber orientation. Higher values of MD indicate greater levels of diffusivity, indicating more space for diffusion to oc-cur. The fractional anisotropy (FA) is a measure of the direc-tionality of diffusion, and ranges from 0 to 1, with 0 reflecting completely isotropic diffusion, and 1 reflecting diffusion con-strained to only 1 direction. Several studies have demonstrated altered tensor metrics in the setting of WD12-16and in the
NAWM of patients with MS.17-21
Thus, the purpose of this study was to evaluate the relation-ship between perfusion and DTI changes in the normal-ap-pearing corpus callosa of patients with relapsing-remitting MS (RRMS), with the hypothesis that correlations between perfu-sion and DTI measures would be more consistent with what would be expected in primary ischemia.
Received April 13, 2006; accepted after revision August 7.
From the Department of Radiology, New York University Medical Center, New York, NY.
Please address correspondence and reprints requests to: Meng Law, MD, Departments of Radiology and Neurosurgery, Mount Sinai Medical Center, One Gustave Levy Place, New York, NY 10029; e-mail: [email protected]
BRAIN
ORIGINAL
Materials and Methods
Patients
Approval for this study was obtained from the Institutional Board of Research Associates, and informed consent was obtained from all patients. Fourteen patients with clinically definite RRMS22,23 consec-utively met inclusion criteria for this study. There were 6 male pa-tients (median age, 43.6 years; range, 33.1– 49.4 years) and 8 female patients (median age, 46.9 years; range, 36.7– 60.0 years). Median age for all 14 patients was 45.7 (range, 33.1 to 60.0 years). All patients were receiving immunomodulating therapy with either interferon␣1-a (Avonex; Biogen Ide, Cambridge, Mass) or Copolymer 1 (Copaxone; Teva, Petach Tikva, Israel). All patients were in a stable phase of dis-ease, and no patients were receiving systemic corticosteroids during the study or in the 3 months preceding the study.
For comparison, 17 control patients were selected with no history of cerebrovascular disease, cardiovascular disease, evidence of small vessel ischemic disease, ischemic stroke, or substantial intracranial pathology on MR imaging. There were 6 male patients (median age, 49.5 years; range, 30.4 – 60.8 years) and 11 female patients (median age, 35.3 years; range, 23.0 – 65.7 years); the median age for all 17 control subjects was 39.0 (range, 23.0- 65.7 years).
MR Imaging
MR imaging was performed on a 1.5T Siemens clinical scanner. Pa-tients with RRMS and control subjects each underwent conventional MR imaging, DTI, and DSC-MR imaging within the same imaging session. Localizing sagittal T1-weighted images of the brain were ob-tained, followed by contiguous 3-mm axial dual echo fast spin-echo proton attenuation and T2-weighted images (TR, 3400 ms; effective TE, 17,119 ms; NEX, 1), and contiguous 5-mm thick axial FLAIR images [TR, 9000; effective TE, 110 ms; TI, 2500 ms; matrix, 512⫻ 256; FOV, 220⫻220 mm]. DTI data were then obtained, followed by DSC-MR imaging and postcontrast axial (TR, 600 ms; TE, 14 ms; NEX, 1) T1-weighted images.
DTI
Axial DTI data were acquired with a pulsed gradient, double spin-echo, echo-planar imaging method (TR, 4400 ms; TE, 100 ms; matrix, 200⫻128; FOV, 220⫻220 mm; 20 5-mm contiguous sections; b⫽ 1000 s/mm2). The pixel size for DTI is 1.72⫻1.72 mm2. The double spin-echo technique is optimized to minimize eddy currents and geo-metric image distortion.24All axial imaging was acquired oriented parallel to the anterior commissure-posterior commissure plane. Dif-fusion weighting (b⫽1000 s/mm2) was applied along 6 noncollinear directions, (Gx, Gy, Gz)⫽{(1,1,0), (1,0,1), (0,1,1) (1,⫺1, 0), (⫺1, 0, 1), (0,1,⫺1)}. For each of these 6 gradient directions, 4 acquisitions were averaged. One image without diffusion weighting (b⫽0) was acquired without averaging. This produced 7 images for each section.
DSC-MR imaging
A series of 60 gradient-echo echo-planar images were acquired at 1-second intervals during the first pass of a standard dose (0.1 mmol/ kg) bolus of gadopentetate dimeglumine (Magnevist; Berlex Labora-tories, Wayne, NY). Seven 5-mm thick sections were acquired, posi-tioned from the T2-weighted images to ensure coverage of a major vessel such as the anterior or middle cerebral arteries, as well as the corpus callosum. All patients had an 18- or 20-gauge intravenous catheter placed in the antecubital fossa for the purpose of contrast administration. The first 10 acquisitions were performed before
con-trast agent injection to establish a preconcon-trast baseline. At the 10th acquisition, gadopentetate dimeglumine (0.1 mmol/kg) was injected with a power injector (Medrad, Indianola, Pa) at a rate of 5 mL/s, immediately followed by a bolus injection of saline (total of 20 mL at 5 mL/s). The specific imaging parameters are: TR, 1000 ms; TE, 54 ms; FOV, 230⫻230 mm; section thickness, 5 mm; matrix, 128⫻128; in-plane voxel size, 1.8⫻1.8 mm; intersection gap, 0%–30%; flip angle, 30°; signal intensity bandwidth, 1470 Hz/pixel. The methods for acquiring perfusion data from a set of DSC enhanced echo-planar images have been described previously.25-28
Image Processing and Evaluation
Data processing was performed off-line using a Sun Ultra 10 work-station with programs developed in-house using the C and IDL (RSI, Boulder, Colo) programming languages. Six maps of the apparent diffusion coefficient were computed, from which the diffusion tensor was calculated. From this tensor, eigenvalues and eigenvectors were derived. The FA and the MD trace were computed from these mea-sures for each voxel by standard algorithms.29MD and FA values were calculated on a pixel-by-pixel basis to form maps for each section.
Absolute cerebral blood volume (CBV), cerebral blood flow (CBF), and mean transit time (MTT) were calculated using the method of Rempp et al.26,27In brief, tissue concentration is found from the change in relaxation rate that occurs during bolus passage. The tissue concentration that results from an idealized, instantaneous bolus is then found by deconvolving the actual tissue concentration with the arterial input function (AIF). Deconvolution was carried out by singular value decomposition.27,28The AIF was found using an automated method similar to that described by Rempp et al.26,30The minimum signal intensity, corresponding to the bolus peak, is found in each pixel within the head. The average signal intensity drop and average bolus arrival time are then calculated for all pixels. Pixels where the bolus arrives early and where the signal intensity drop is larger than average are assumed to be within arteries. The AIF is found by averaging the signals from all such pixels.
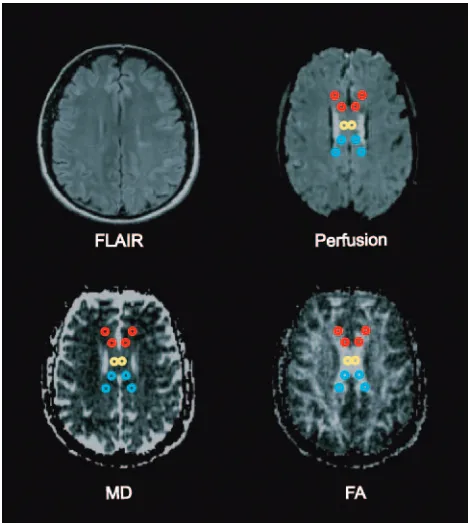
After visual coregistration of the FA map, MD map, and perfusion MR images, 2 regions of interest (ROIs) were placed in the central body and in bilateral areas of genu and splenium of the corpus callo-sum, as shown in Fig 1. ROIs were fixed in size (radius⫽1 image pixel, 1.8 mm) and placed so as to avoid arterial or venous structures on the perfusion images. Furthermore, the ROIs were placed after visual coregistration with the axial T2-weighted and FLAIR images to ensure lesions were not included in the ROI. This generated measures of FA, MD, CBV, CBF, and MTT for each of the ROIs.
Statistical Analysis
The mixed model included subject age and sex as fixed numeric and classification factors, respectively, assumed that the observations de-rived for a given metric were correlated or independent when dede-rived for the same subject or different subjects, respectively, and allowed the variance of the metric to differ across both subject groups and areas of the corpus callosum.
Results
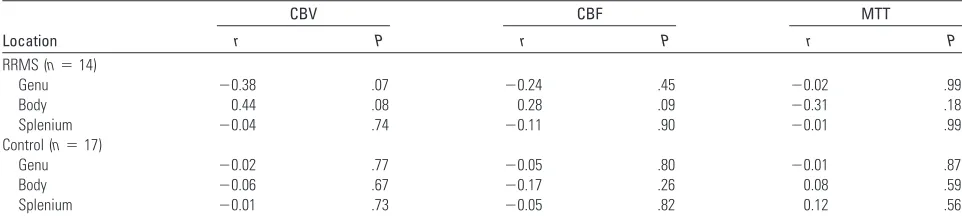
The results for correlations between MD and perfusion mea-sures are shown in Table 1. In RRMS patients, CBF was signif-icantly correlated with MD in the central body (r⫽0.86;P⬍ .0001) and splenium (r⫽0.83;P⬍.0001) of the corpus cal-losum. CBV was also significantly correlated with MD in the central body (r⫽0.63;P⫽.0046) and splenium (r⫽0.65;P⬍ .0001) of the corpus callosum. In the genu of the corpus cal-losum, no significant correlations were found between MD and either CBF or CBV, and no significant correlations were present between MD and MTT in any of the areas of corpus callosum of patients with RRMS. The control group did not demonstrate significant correlations between MD and any perfusion measures in any of the areas of corpus callosum examined. The results for correlations between FA and perfu-sion measures are shown in Table 2. No significant correla-tions were present between FA and any of the perfusion met-rics in any of the areas of corpus callosum of both patients with RRMS and control subjects.
ThePvalues listed in Tables 1 and 2 were determined from the mixed-model analysis to account for within-subject corre-lations. ThesePvalues were used to test whether the correla-tion between a given pair of measures is different for patients with RRMS than it is for control subjects. Indicating that the significant correlations found in Table 1 were different be-tween the RRMS group and the control group, significant
in-teractions were found between MD and CBV in the central body (P⫽.037) and splenium (P⫽.018), and between MD and CBF in the central body (P⫽.045) and splenium (P⫽ .017). A significant interaction was also found between FA and CBF within the central body of the corpus callosum body (P⫽ .047). This significant interaction occurred because the corre-lation was positive among patients with RRMS, negative among control subjects, and moderate in magnitude within both groups (ie, although neither correlation was significant individually, the difference between them was large). No other significant interactions were found between the RRMS and control groups with respect to correlations between perfusion and DTI metrics.
Discussion
Numerous histopathologic and biochemical studies have demonstrated that in addition to the characteristic discrete white matter lesions found in patients with MS, there is diffuse abnormality involving grossly NAWM. Findings in the NAWM include decreased myelin-specific protein,1diffuse
astrogliosis,31and infiltration by macrophages and T lympho-cytes.3,4Although MS has prototypically been characterized as
a demyelinating disease, axonal damage, including axonal transection and decreased fiber attenuation, has been demon-strated in both lesions as well as within the NAWM.2,32
Advanced MR imaging studies have demonstrated abnor-malities in areas of white matter that are not visualized on conventional MR imaging. MR spectroscopy studies have found metabolic alterations within the NAWM.N -acetylas-partate is a neuronal marker that is commonly decreased within MS lesions and has also been found to be decreased in regions of NAWM,5-7signifying diffuse axonal loss or
dys-function. Loss of macromolecular organization, such as when myelin is fragmented or destroyed, influences the transfer of magnetization from macromolecules to free water, and this magnetization can be measured using MR as the magnetiza-tion transfer ratio (MTr). In patients with MS, the MTr is significantly reduced in areas of NAWM,8-10supporting the
concept of diffuse parenchymal macrostructural abnormality. Using DSC enhanced perfusion MR imaging, Law et al11
demonstrated significant hypoperfusion in the NAWM of RRMS patients compared with control subjects; however, a specific mechanism for the hypoperfusion could not be sug-gested on the basis of that study. Fundamentally, there are 2 possible causes for NAWM hypoperfusion, which can be cat-egorized as primary or secondary. In the first scenario, a pri-mary vascular pathologic lesion results in decreased perfusion in the NAWM with consequent ischemic parenchymal injury. In the second scenario, axonal damage in MS lesions leads to WD of axons traversing distant areas of white matter, resulting in decreased axonal attenuation, regional hypometabolism, and secondary hypoperfusion of the NAWM. The distinction between these mechanisms has potentially important implica-tions, because ischemia may be an early and potentially revers-ible finding, whereas hypometabolism from axonal degenera-tion would represent advanced and irreversible disease.
DTI has proved to be a valuable tool for investigating the integrity of white matter microstructure that cannot be as-sessed by conventional MR imaging and has been used to study both ischemia and WD. Parameters such as the MD Fig 1.Fluid-attenuated inversion recovery image, perfusion image, MD map, and FA map
[image:3.585.52.287.41.303.2]averaged over 3 orthogonal directions measure the magnitude of diffusion of water molecules, whereas diffusion anisotropy indices, such as FA, indicate the degree of deviation from iso-tropic diffusion of water molecules. In studies of acute isch-emic stroke, MD has been found to be decreased in the imme-diate setting,33,34related to acute cellular swelling. The MD
later increases toward normal values and finally becomes ele-vated in the chronic phase, thought to represent destruction of membrane integrity and progression toward tissue necrosis.35
Fractional anisotropy progressively decreases in the white matter in the setting of ischemia,33,36again attributed to
on-going tissue destruction.
Studies have demonstrated DTI changes related to WD in the setting of ischemic stroke.12,13Thomalla et al14found
de-creases in FA reflecting early WD in the cerebral peduncle of the affected side as early as 2–16 days after ischemic stroke, whereas maps of the orientationally averaged diffusivity did not reveal obvious changes. Months to years after ischemic stroke, FA becomes chronically decreased, and MD increases slightly along the pyramidal tract on the affected side below the primary lesion.12,15,16This is thought to be related to
fibro-sis and atrophy of affected connected fiber tracts.37
In this study, we correlated DTI and perfusion MR metrics in the normal-appearing corpus callosa of patients with MS and control subjects to further elucidate the basis for hypoper-fusion in MS. We chose the corpus callosum as the focus for evaluation because it is the most highly organized interhemi-spheric structure in the brain,38providing a sensitive area for evaluation of subtle changes in DTI measures. In the MS group, we found highly significant large-magnitude correla-tions between perfusion measures and MD, specifically that
decreasing CBF was associated with decreasing MD (increased diffusion restriction) and not significantly correlated with FA. We interpret these findings as support for primary hypoper-fusion (ischemia) in MS. In the setting of primary ischemia, areas with the lowest perfusion would be expected to have the most restricted diffusion (the most decreased mean diffusiv-ity), with possibly only slight decreases in FA, consistent with the findings of this study. In secondary hypoperfusion related to WD, the most hypometabolic/hypoperfused areas should in theory have the lowest axonal fiber attenuation and would thus be expected to have the most increased MD and most decreased FA. The mixed model analysis demonstrated that the significant correlations between DTI and perfusion mea-sures are not present in control subjects, suggesting that they are related to the disease process.
This study does not refute the presence or importance of WD in MS; however, it suggests that hypoperfusion is due to alternative (primary vascular) pathologic conditions. Indeed, considerable evidence supports the idea that WD does occur in MS and specifically within the corpus callosum. Recent ev-idence from a quantitative postmortem study of patients with MS demonstrated a significant reduction of axonal attenua-tion and volume in areas of corpus callosum that appeared grossly normal.32Several studies of diffusion properties of the NAWM in MS have demonstrated findings of increased MD and decreased FA,17-20as is seen in WD from ischemic stroke.
[image:4.585.53.533.69.177.2]However, it is important to consider that the end point of tissue destruction of disparate pathologic conditions could lead to a similar pattern of DTI findings. Although studies have shown that DTI abnormalities in the NAWM correlate with DTI abnormalities within lesions,21,39this may simply
Table 1: Pearson correlation coefficients for the association of MD with perfusion measures within each area of the corpus callosum of patients with RRMS and control subjects
Location
CBV CBF MTT
r P r P r P
RRMS (n⫽14)
Genu 0.25 .87 0.23 .89 0.08 .73
Body 0.63 .046 0.86 ⬍.0001 ⫺0.39 .08
Splenium 0.65 ⬍.0001 0.83 ⬍.0001 ⫺0.33 .08
Control (n⫽17)
Genu ⫺0.09 .74 0.04 .64 ⫺0.15 .33
Body ⫺0.01 .72 0.17 .81 ⫺0.21 .61
Splenium ⫺0.03 .54 ⫺0.004 .82 ⫺0.11 .73
Note:—MD, mean diffusivity; RRMS, relapsing-remitting multiple sclerosis; CBF, cerebral blood flow; CBV, cerebral blood volume; MTT, mean transit time. Statistical significance accepted atP⬍.05.
Table 2: Pearson correlation coefficients for the association of FA with perfusion measures within each area of the corpus callosum of patients with RRMS and control subjects
Location
CBV CBF MTT
r P r P r P
RRMS (n⫽14)
Genu ⫺0.38 .07 ⫺0.24 .45 ⫺0.02 .99
Body 0.44 .08 0.28 .09 ⫺0.31 .18
Splenium ⫺0.04 .74 ⫺0.11 .90 ⫺0.01 .99
Control (n⫽17)
Genu ⫺0.02 .77 ⫺0.05 .80 ⫺0.01 .87
Body ⫺0.06 .67 ⫺0.17 .26 0.08 .59
Splenium ⫺0.01 .73 ⫺0.05 .82 0.12 .56
[image:4.585.52.533.229.337.2]reflect an underlying primary pathologic condition responsi-ble for both lesions and NAWM damage and does not neces-sarily indicate that WD is primarily from lesions. In theory, diffuse ischemic injury in MS could also lead to WD of axons in the NAWM. In fact, microscopic ischemic injury in the corpus callosum, given its central location and high axonal fiber attenuation, could lead to extensive bihemispheric WD. Further arguing against WD from lesions as the basis for NAWM hypoperfusion is that abnormalities in the NAWM have been described early in the course of disease in patients with MS without substantial lesion loads. De Stefano et al40
showed that cerebralN-acetylaspartate/creatine and MTr val-ues are diffusely decreased in patients with MS with early dis-ease, no significant disability, and low demyelinating lesion load, suggesting that axonal injury begins very early in the course of MS. Metabolic abnormalities have been detected in the corpus callosum using MR spectroscopy at the earliest stage of clinically isolated syndrome suggestive of MS, before atrophy and lesions are detected.41
It could be argued that rather than WD from distant le-sions, decreased perfusion in NAWM could be related to wide-spread parenchymal damage below the resolution of conven-tional MR imaging from a nonischemic etiology. While diffuse nonischemic parenchymal injury could lead to hypoperfusion secondary to hypometabolism and similar findings of in-creased MD and dein-creased FA within the NAWM, the ex-pected correlations between perfusion and DTI measures would be similar to that found in WD, with the most hypo-metabolic/hypoperfused areas containing the most parenchy-mal damage demonstrating highest MD and lowest FA.
Considerable histopathologic evidence supports a primary vascular pathologic lesion in MS. Studies have described perivascular inflammatory changes such as lymphocytic infil-tration and edematous onion-skin changes of vein walls in NAWM lacking adjacent parenchymal inflammation, suggest-ing that MS could represent a form of subacute or chronic vasculitis.31,42Vascular occlusion in MS was described on his-topathologic examination by Putnam43,44in the 1930s and
later by Wakefield et al,45who demonstrated fibrin deposition
and thrombosis of vessels in the absence of cellular infiltration, suggesting that thrombosis of small veins and capillaries could represent an ischemic basis for disease. More recent studies have demonstrated the presence of extensive oligodendrocyte apoptosis46and preferential loss of myelin-associated
glycop-rotein,47which is suggestive of hypoxic-ischemic-type tissue injury.
It is not clear why correlations between perfusion and DTI metrics were found in the body and splenium of the corpus callosum, but not in the genu; however, this could be related to differences in fiber composition of the corpus callosum. Thin fibers seem to be most susceptible to injury in MS,48and there
is a higher attenuation of thin fibers in the splenium than in the genu.49Although vascular changes in MS would be ex-pected to diffusely affect the corpus callosum, it is possible that larger fibers in the genu would be more resistant to ischemic injury.
Although we interpret our findings of significant correla-tions between DTI and perfusion measures as significant, there are limitations to this study. Visual coregistration of the perfusion images and DTI maps can lead to errors from
mis-registration. Although changes in MD would not be as subject to variability over small distances, FA is highly dependent on the area of corpus callosum sampled, and slight differences in ROI placement could partly explain a lack of correlation be-tween perfusion measures and FA in both MS and control groups. Another limitation of the study related to visual coreg-istration is the inability to measure DTI and perfusion param-eters in a blinded fashion, because simultaneous placement of corresponding ROIs was required. However, measurements from the perfusion analysis were not visible when placing ROIs on the DTI images and were obtained simultaneously for all ROIs so as to limit bias from manipulation of ROI placement.
The perfusion algorithm used has inherent limitations and is accurate only if there is negligible delay and dispersion in the bolus between the arteries where the AIF is measured and the tissue of interest. Delays and dispersion introduce errors into the calculation of perfusion parameters50,51; however, these
errors should be minimal, because the AIF is estimated close to the site of the perfusion measurements. The effect of the dis-ease process itself on the AIF is also not known, though at this time it seems that there is relative sparing of the major arteries in the vasculitic process and hence the AIF may not be greatly affected in MS. Finally, all patients in the MS group were un-dergoing chronic immunomodulating therapy, possibly de-creasing the inflammatory component of the disease process within the NAWM and affecting both DTI and perfusion measures.
The results of this study correlating DTI and perfusion changes are more consistent with what would be expected in primary ischemia than in secondary hypoperfusion from WD. Further investigation, including larger and longitudinal stud-ies are warranted to additionally support the concept of emic injury in MS. A better understanding of the role of isch-emia could aid in predicting clinical course, monitoring response to therapy, and designing novel targets for therapeu-tic intervention for MS.
Conclusions
In areas of normal-appearing corpus callosum of patients with RRMS, decreasing perfusion is correlated with decreasing MD and is not significantly correlated with FA. These findings sup-port the concept of primary ischemia in MS rather than sec-ondary hypoperfusion as a result of WD.
References
1. Trotter JL, Wegescheide CL, Garvey WF, et al.Studies of myelin proteins in multiple sclerosis brain tissue.Neurochem Res1984;9:147–52
2. Trapp BD, Peterson J, Ransohoff RM, et al.Axonal transection in the lesions of multiple sclerosis.N Engl J Med1998;338:278 – 85
3. Traugott U, Reinherz EL, Raine CS.Multiple sclerosis. Distribution of T cells, T cell subsets and Ia-positive macrophages in lesions of different ages.J Neu-roimmunol1983;4:201–21
4. Adams CW.Pathology of multiple sclerosis: progression of the lesion.Br Med Bull1977;33:15–20
5. Narayanan S, Fu L, Pioro E, et al.Imaging of axonal damage in multiple sclerosis: spatial distribution of magnetic resonance imaging lesions.Ann Neurol1997;41:385–91
6. Husted CA, Goodin DS, Hugg JW, et al.Biochemical alterations in multiple sclerosis lesions and normal-appearing white matter detected by in vivo 31P and 1H spectroscopic imaging.Ann Neurol1994;36:157– 65
8. Filippi M, Campi A, Dousset V, et al.A magnetization transfer imaging study of normal-appearing white matter in multiple sclerosis. Neurology
1995;45:478 – 82
9. Loevner LA, Grossman RI, Cohen JA, et al.Microscopic disease in normal-appearing white matter on conventional MR images in patients with multiple sclerosis: assessment with magnetization-transfer measurements.Radiology
1995;196:511–15
10. Ge Y, Grossman RI, Udupa JK, et al.Magnetization transfer ratio histogram analysis of normal-appearing gray matter and normal-appearing white mat-ter in multiple sclerosis.J Comput Assist Tomogr2002;26:62– 68
11. Law M, Saindane AM, Ge Y, et al.Microvascular abnormality in relapsing-remitting multiple sclerosis: perfusion MR imaging findings in normal-ap-pearing white matter.Radiology2004;231:645–52
12. Thomalla G, Glauche V, Weiller C, et al.Time course of wallerian degeneration after ischaemic stroke revealed by diffusion tensor imaging.J Neurol Neuro-surg Psychiatry2005;76:266 – 68
13. Khong PL, Zhou LJ, Ooi GC, et al.The evaluation of Wallerian degeneration in chronic paediatric middle cerebral artery infarction using diffusion tensor MR imaging.Cerebrovasc Dis2004;18:240 – 47
14. Thomalla G, Glauche V, Koch MA, et al.Diffusion tensor imaging detects early wallerian degeneration of the pyramidal tract after ischemic stroke. NeuroIm-age2004;22:1767–74
15. Werring DJ, Toosy AT, Clark CA, et al.Diffusion tensor imaging can detect and quantify corticospinal tract degeneration after stroke.J Neurol Neurosurg Psy-chiatry2000;69:269 –72
16. Pierpaoli C, Barnett A, Pajevic S, et al.Water diffusion changes in wallerian degeneration and their dependence on white matter architecture.Neuroimage
2001;13:1174 – 85
17. Werring DJ, Clark CA, Barker GJ, et al.Diffusion tensor imaging of lesions and normal-appearing white matter in multiple sclerosis. Neurology
1999;52:1626 –32
18. Filippi M.Linking structural, metabolic and functional changes in multiple sclerosis.Eur J Neurol2001;8:291–97
19. Bammer R, Keeling SL, Augustin M, et al.Improved diffusion-weighted single-shot echo-planar imaging (EPI) in stroke using sensitivity encoding (SENSE).
Magn Reson Med2001;46:548 –54
20. Guo AC, MacFall JR, Provenzale JM.Multiple sclerosis: diffusion tensor MR imaging for evaluation of normal-appearing white matter. Radiology
2002;222:729 –36
21. Werring DJ, Clark CA, Droogan AG, et al.Water diffusion is elevated in wide-spread regions of normal-appearing white matter in multiple sclerosis and correlates with diffusion in focal lesions.Mult Scler2001;7:83– 89
22. Poser CM, Paty DW, Scheinberg L, et al.New diagnostic criteria for multiple sclerosis: guidelines for research protocols.Ann Neurol1983;13:227–31 23. Lublin FD, Reingold SC.Defining the clinical course of multiple sclerosis:
results of an international survey. National Multiple Sclerosis Society (USA) Advisory Committee on Clinical Trials of New Agents in Multiple Sclerosis.
Neurology1996;46:907–11
24. Reese TG, Heid O, Weisskoff RM, et al.Reduction of eddy-current-induced distortion in diffusion MRI using a twice-refocused spin echo.Magn Reson Med2003;49:177– 82
25. Knopp EA, Cha S, Johnson G, et al.Glial neoplasms: dynamic contrast-en-hanced T2*-weighted MR imaging.Radiology1999;211:791–98
26. Rempp KA, Brix G, Wenz F, et al.Quantification of regional cerebral blood flow and volume with dynamic susceptibility contrast-enhanced MR imaging.
Radiology1994;193:637– 41
27. Ostergaard L, Weisskoff RM, Chesler DA, et al.High resolution measurement of cerebral blood flow using intravascular tracer bolus passages. Part I: math-ematical approach and statistical analysis.Magn Reson Med1996;36:715–25 28. Ostergaard L, Sorensen AG, Kwong KK, et al.High resolution measurement of
cerebral blood flow using intravascular tracer bolus passages. Part II: experi-mental comparison and preliminary results.Magn Reson Med1996;36:726 –36 29. Basser PJ.Inferring microstructural features and the physiological state of
tissues from diffusion-weighted images.NMR Biomed1995;8:333– 44 30. Carroll TJ, Rowley HA, Haughton VM.Automatic calculation of the arterial
input function for cerebral perfusion imaging with MR imaging.Radiology
2003;227:593– 600
31. Allen IV, McKeown SR.A histological, histochemical and biochemical study of the macroscopically normal white matter in multiple sclerosis.J Neurol Sci
1979;41:81–91
32. Evangelou N, Esiri MM, Smith S, et al.Quantitative pathological evidence for axonal loss in normal appearing white matter in multiple sclerosis.Ann Neu-rol2000;47:391–95
33. Munoz Maniega SM, Bastin ME, Armitage PA, et al.Temporal evolution of water diffusion parameters is different in grey and white matter in human ischaemic stroke.J Neurol Neurosurg Psychiatry2004;75:1714 –18
34. Buffon F, Molko N, Herve D, et al.Longitudinal diffusion changes in cerebral hemispheres after MCA infarcts.J Cereb Blood Flow Metab2005;25:641–50 35. Pierpaoli C, Righini A, Linfante I, et al.Histopathologic correlates of abnormal
water diffusion in cerebral ischemia: diffusion-weighted MR imaging and light and electron microscopic study.Radiology1993;189:439 – 48
36. Sorensen AG, Wu O, Copen WA, et al.Human acute cerebral ischemia: detec-tion of changes in water diffusion anisotropy by using MR imaging.Radiology
1999;212:785–92
37. Johnson AC, McNabb, Rossiter RJ.Chemistry of wallerian degeneration; a review of recent studies.Arch Neurol Psychiatry1950;64:105–21
38. Tomasch J.Size, distribution, and number of fibres in the human corpus cal-losum.Anat Rec1954;119:119 –35
39. Ciccarelli O, Werring DJ, Barker GJ, et al.A study of the mechanisms of nor-mal-appearing white matter damage in multiple sclerosis using diffusion ten-sor imaging– evidence of Wallerian degeneration.J Neurol2003;250:287–92 40. De Stefano N, Narayanan S, Francis SJ, et al.Diffuse axonal and tissue injury in
patients with multiple sclerosis with low cerebral lesion load and no disabil-ity.Arch Neurol2002;59:1565–71
41. Ranjeva JP, Pelletier J, Confort-Gouny S, et al.MRI/MRS of corpus callosum in patients with clinically isolated syndrome suggestive of multiple sclerosis.
Mult Scler2003;9:554 – 65
42. Adams CW, Poston RN, Buk SJ, et al.Inflammatory vasculitis in multiple sclerosis.J Neurol Sci1985;69:269 – 83
43. Putnam TJ.Evidences of vascular occlusion in multiple sclerosis and enceph-alomyelitis.Arch Neurol Neuropsychol1935;32:1298 –321
44. Putnam TJ.The pathogenesis of multiple sclerosis: a possible vascular factor.
N Engl J Med1933;209:786 –90
45. Wakefield AJ, More LJ, Difford J, et al.Immunohistochemical study of vascular injury in acute multiple sclerosis.J Clin Pathol1994;47:129 –33
46. Barnett MH, Prineas JW.Relapsing and remitting multiple sclerosis: pathol-ogy of the newly forming lesion.Ann Neurol2004;55:458 – 68
47. Aboul-Enein F, Rauschka H, Kornek B, et al.Preferential loss of myelin-asso-ciated glycoprotein reflects hypoxia-like white matter damage in stroke and inflammatory brain diseases.J Neuropathol Exp Neurol2003;62:25–33 48. Evangelou N, Konz D, Esiri MM, et al.Size-selective neuronal changes in the
anterior optic pathways suggest a differential susceptibility to injury in mul-tiple sclerosis.Brain2001;124:1813–20
49. Aboitiz F, Scheibel AB, Fisher RS, et al.Fiber composition of the human corpus callosum.Brain Res1992;598:143–53
50. Calamante F, Gadian DG, Connelly A.Delay and dispersion effects in dynamic susceptibility contrast MRI: simulations using singular value decomposition.
Magn Reson Med2000;44:466 –73