ORIGINAL RESEARCH
Differences in Brain Structure in Deaf Persons on
MR Imaging Studied with Voxel-Based
Morphometry
D.K. Shibata BACKGROUND AND PURPOSE: The loss of a major sensory input early in life is known to cause alterations in neuronal connectivity and physiology at the cellular level, but effects on gross anatomy are less well understood. The purpose of this study was to compare volumetric structural brain MR imaging scans of deaf versus hearing subjects by using voxel-based morphometry (VBM). The hypothesis was that the deaf would have relative hypoplasia in the temporal lobe centers involved in hearing and speech.
METHODS: T1-weighted volumetric images from 53 prelingually deaf persons and 51 control subjects were analyzed with VBM. Initial segmentations were spatially normalized, and then these deformation parameters were applied to the original images, which were again segmented. Statistic parametric mapping was then applied on a voxel-by-voxel basis to determine group differences and asymmetries.
RESULTS: The white matter analysis revealed a statistically significant focal deficit in the deaf persons in the left posterior superior temporal gyrus (STG), corresponding to white matter inferior to auditory cortex. Gray matter asymmetries in the deaf persons were overall similar to that in hearing persons but a focal loss of asymmetry was noted in the posterior STG white matter in the deaf persons.
CONCLUSION:These results support the hypothesis that there are gross alterations in brain anatomy as a consequence of early deafness. The white matter deficit in the posterior left superior temporal gyrus may represent hypoplasia of the auditory/speech related tracts. Hemispheric asymmetries however remain largely intact.
A
ccording to neonate screening programs, 2.5 of every 1000 Americans are born with some form of significant hearing loss.1The current interest in placing cochlear implants at ear-lier ages for improving spoken language acquisition has in-creased the need to better understand the effect of early deaf-ness on brain development—particularly alteration in cortical function, which may be the primary determinant of implant success.2Although a number of recent studies have examined brain function in deaf persons by using techniques such as positron-emission tomography (PET),3 functional MR imaging (fMRI),4or magnetoencephalography (MEG),5relatively few studies have looked at possible anatomic and structural abnor-malities that might help lay a foundation for interpretation of the neurophysiology.
There are 2 fundamental questions. First, does auditory and speech deprivation early in life result in some form of atrophy or hypoplasia of the hearing and speech centers? There is MR imaging evidence that the cochlear nerve diame-ter may be smaller in the congenitally deaf,6but it is more difficult to characterize cortical changes. Second, is anatomic hemispheric lateralization influenced by early hearing or speech experience? Although brain asymmetry may be largely hardwired, there is speculation that the left posterior superior temporal gyrus asymmetric enlargement of the “speech cen-ters” reported by Geschwind and Levitsky7in cadavers might be dependent on auditory language exposure and experience.
The purpose of this study was to apply voxel-based mor-phometry (VBM) to a group of prelingually deaf adults with a sample size more than twice as large as any prior study to better assess for possible focal cortical abnormalities or differ-ences in lateralization related to early hearing loss. The hy-pothesis was that the deaf would have relative hypoplasia and might show decreased lateralization in the temporal lobe re-gion related to speech.
Methods
Subjects
The local institutional review board approved the protocol for this study and written informed consent was obtained from all of the volunteers. Fifty-three students from a deaf college (the National Technical Institute of the Deaf) who were prelingually deaf (34 male, 19 female; age range, 18 –27 years; mean age, 21 years) were compared with 51 non– hearing-impaired control subjects (31 male, 20 female; age range, 19 –32 years; mean age, 25 years). Only subjects determined to be right-handed as assessed by answers to a handedness question-naire (⬎90% score)8were included.
Inclusion criteria for the deaf subjects included profound deafness diagnosed within the first 6 months of life, fluency in American Sign Language (ASL), and the absence of associated neurologic disease, such as Usher syndrome. The predominant causes of deafness were inheritance and meningitis. All anatomic MR images were reviewed by a neuroradiologist (D.K.S.), and subjects showing any significant brain abnormalities were excluded. One deaf subject was excluded because of ventriculomegaly, presumably due to meningitis-related hydrocephalus as an infant; another deaf subject was excluded be-cause of diffuse cerebral atrophy of uncertain be-cause. Any subjects with cochlear implants were not scanned because of MR imaging safety concerns.
Received February 10, 2006; accepted after revision April 9.
From the Department of Radiology, University of Washington Medical Center, Seattle, Wash.
Address correspondence to D.K. Shibata, Department of Radiology, University of Wash-ington Medical Center, Box 357115, 1959 NE Pacific, Seattle, WA 98195; e-mail: [email protected]
BRAIN
ORIGINAL
MR Scanning
On a 1.5 T Signa MR imaging scanner (GE Medical Systems, Milwau-kee, Wis), T1-weighted 3D echo-spoiled gradient echo (SPGR) im-ages with 1.5-mm contiguous axial sections (TR/TE/flip angle, 11.1 ms/2.2 ms/30°; matrix, 512⫻512; FOV, 24 cm) were obtained. The SPGR scans were conducted at the end of an fMRI session. Scans with excessive motion artifact (defined as indistinct sulci along the supe-rior temporal lobe) were excluded. Five deaf and 4 hearing subjects were excluded on this basis, leaving scans from 53 deaf and 51 hearing subjects for analysis.
Image Processing
The “optimized” protocol for VBM analysis of Good et al9was
per-formed using statistical parametric mapping (SPM2; Wellcome De-partment of Imaging Neuroscience, London, UK; http://www.fil.ion. ucl.ac.uk) running in MATLAB 6 (Math Works, Natick, Mass). In brief, nonbrain tissue (skull, scalp, etc) was removed, and initial gray matter, white matter, and CSF segmentations were spatially normal-ized to the Montreal Neurologic Institute (MNI) template, and then these deformation parameters were applied to the original images, which were then segmented again. Finally, Jacobian modulation was applied to gray matter to restore the original absolute volume altered by the normalization process, and images were smoothed using a 12-mm, full-width, half-maximum isotropic Gaussian kernel. Attest statistic was then applied between the 2 groups to evaluate for signif-icant differences.
To assess for asymmetry in each group, the technique of Good et al10was used involving a modification of the usual VBM procedure
using symmetric templates. Right/left-flipped images were compared
with the original images by using a pairedttest statistic to evaluate for gray matter and white matter asymmetries.
Statistical Analysis
Statistical analysis was performed within the SPM2 software package. For assessing differences between the hearing and deaf groups, attest statistic was applied between the 2 groups to evaluate for significant differences. For data exploration, raw voxel-level data were displayed on the MNI 3D brain template at thresholdP⬍.0001 uncorrected with extent threshold 100 voxels. To assess for statistical significance and correct for multiple comparisons across the volume of the brain, a Bonferroni correction (within SPM2) was applied at the cluster-level and adjusted for search volume.9,11
To evaluate for differences in asymmetry between the 2 groups, subtraction asymmetry maps were created of the original minus the right/left-flipped images, and then these maps were compared across the deaf and hearing groups and displayed and assessed for statistical significance in a manner similar to that described above.
Results
Deaf versus Hearing
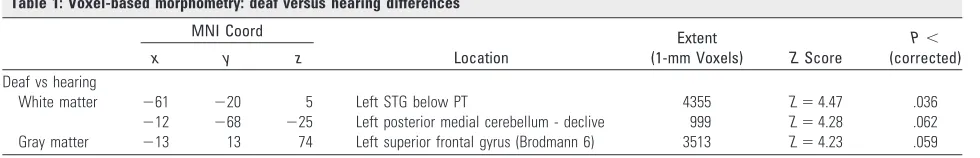
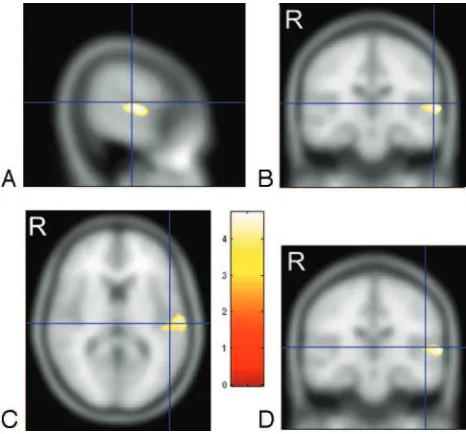
[image:2.585.53.531.42.258.2]The white matter VBM analysis revealed 2 foci aboveP⬍ .0001 threshold (uncorrected) (Fig 1). The larger focus con-sisted of 4355 voxels (each voxel is a cubic millimeter) cen-tered in the left superior temporal gyrus with highest cor-relation at (⫺61,⫺20,5) (x,y,zMNI coordinates),Z⫽4.47, P⬍.036 (corrected) (Table 1). The coordinates correspond to white matter underlying the left planum temporale (PT) Fig 1.Deaf versus hearing white matter and gray matter VBM. Threshold at T⫽3.7 with extent threshold 100 voxels.
Table 1: Voxel-based morphometry: deaf versus hearing differences
MNI Coord
Location
Extent
(1-mm Voxels) ZScore
P⬍
(corrected)
x y z
Deaf vs hearing
White matter ⫺61 ⫺20 5 Left STG below PT 4355 Z⫽4.47 .036
[image:2.585.52.542.294.373.2]and Heschl gyrus (HG) gray matter. Talairach coordinates for PT gray matter from Westbury et al12are (⫺60,⫺20, 10) and for HG gray matter from Rademacher et al13 are (⫺50,⫺20, 8). These PT and HG coordinates in Talairach space were converted to MNI space using a nonlinear trans-formation14 and are displayed as crosshairs in relation to the focus of white matter deficit in deaf patients on cross-sectional images (Fig 2).
A smaller focus of white matter deficit in deaf persons con-sisting of 999 voxels slightly below corrected statistical signif-icance was seen with highest correlation at (⫺12,⫺68,⫺25), Z⫽4.28 (P⬍.062 corrected) in the left posterior medial cerebellum declive as identified by Talairach transformed co-ordinates of (⫺12,⫺67,⫺18)15(Fig 1).
The gray matter analysis revealed only 1 focus above the P⬍.0001 threshold (uncorrected) (Fig 1), which, however, fell below statistical significance when corrected for multiple comparisons (P⬍.059 corrected), consisting of a 3513-voxel focus of deaf gray matter enlargement in the left superior fron-tal gyrus (⫺13, 13, 74),Z⫽4.23 in Brodmann area 6 (premo-tor cortex) (Fig 1). No regions of gray matter abnormality were noted at a similar or statistically significant level in the temporal lobes of the deaf subjects.
Asymmetry
The deaf and hearing groups showed qualitatively similar broad regions of gray matter right-dominant asymmetry in the frontal/temporal perisylvian region, but the hearing group showed slightly greater extent, particularly into the frontal lobe (82,797 voxels overall in hearing versus 69,773 in deaf) (Fig 3, Table 2). The second largest asymmetric cluster was in the left-dominant occipital lobe and was similar in the 2 groups. On a more focal level of analysis, left-dominant asym-metric gray matter foci were seen in the posterior superior
temporal gyri in both the hearing (2805 voxels centered at ⫺38,⫺38, 16) and the deaf (3097 voxels centered at⫺38, ⫺37, 14) (Fig 3).
For the white matter asymmetry analysis, similar but smaller broad foci of asymmetry were again seen in the right-dominant perisylvian regions that were qualitatively highly similar but with slightly larger temporal and frontal lobe foci in hearing persons compared with deaf persons (46,352 versus 39,982 suprathreshold voxels) (Fig 4, Table 2). As seen in the gray matter analysis, there were white matter asymmetric foci in the left-dominant occipital lobe that were highly similar in the 2 groups in location, though slightly larger in the deaf persons. The small left-dominant focus along the posterior superior temporal gyrus seen on the gray matter analysis was not visible above threshold in the white matter analysis. Note that the apparent foci overlying the left temporal region on the 3D surface rendering of the white matter asymmetry are actu-ally representations of medial structures, and no left temporal lobe foci were actually found.
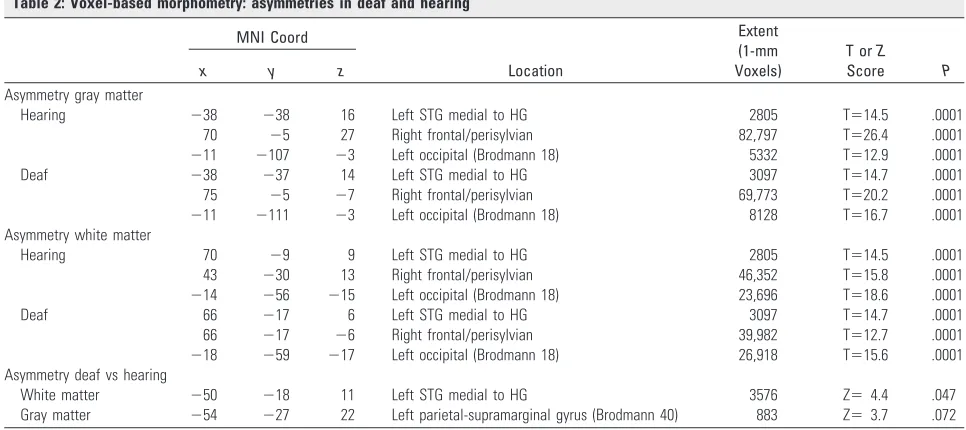
A direct comparison of the group differences between the deaf subject versus hearing subject asymmetry derived from subtracting the original and left/right-flipped images revealed a white matter focus of statistical significance in the superior temporal gyrus (⫺50,⫺18, 11) (P⬍.047 corrected), with greater asymmetry in the hearing compared with the deaf (Figs 5 and 6). The comparison of gray matter asymmetry (Fig 5) revealed a dominant focus in the parietal lobe (⫺54,⫺27, 22) supramarginal gyrus (Brodmann area 40), also showing greater asymmetry in the hearing subjects, but it did not reach statistical significance (P⬍.072 corrected).
Discussion
The first report to look at brain abnormalities in deafness was a postmortem study of 7 adult-onset deaf patients in which “cell shrinkage” was seen within the brain stem au-ditory nuclei; unfortunately, the investigators did not assess for changes in the cerebral cortex.16There have been 2 MR imaging studies— both published in 2003. The first, by Penhune et al,17compared volumetric 1-mm T1-weighted MR imaging scans from 12 congenitally deaf adults with 10 hearing control subjects. Both whole-brain VBM and man-ual volumetric analysis of the auditory cortex (Heschl gyrus and the planum temporale) revealed no statistically signif-icant difference in deaf brain anatomy. However, the study by Emmorey et al18with a larger group of 25 congenitally deaf adults using 1.5-mm T1-weighted images with manual volumetric analysis of temporal lobes found decreased white matter volume in the auditory cortices of deaf per-sons, whereas gray matter volume and leftward asymmetry was preserved. The brain beyond the temporal lobe was not studied, and the application of an automated technique, such as VBM, was not reported. It is uncertain whether the discrepant conclusions from these 2 studies are related to different techniques, sample populations, or perhaps, most likely, simply the larger sample sizes in the study by Emmo-rey et al.18
Recent studies of brain metabolism with PET on small groups of deaf adults or children3,19suggest relatively intact metabolism in auditory cortex in adults who became deaf early in life. fMRI studies have recently shown apparent language-Fig 2.Cross-sections through the left superior temporal gyrus showing the focus of white
matter deficit in the deaf group in relation to planum temporale and Heschl gyrus.Aand B, crosshairs indicate the gray matter center of the planum temporale at (⫺60,⫺20, 10).12 CandD, crosshairs are centered on the gray matter center of Heschl gyrus at (⫺50,⫺20, 8).13
[image:3.585.53.286.41.258.2]and vision-related activation in the auditory cortex region, which has been interpreted as evidence for cortical plastici-ty.4,20,21 These functional imaging studies argue against a marked gray matter hypoplasia or atrophy in deaf auditory cortex but cannot rule out white matter or perhaps subtle gray matter abnormalities.
White Matter Differences in Deaf Persons
The white matter deficit in the posterior left superior temporal gyrus may represent decreased volume of auditory tracts, though the actual center (using the MNI coordinate system and normalization in statistical parametric mapping) appears centered slightly inferior and lateral to primary auditory cor-tex itself. As seen on the cross-sectional images (Fig 2), this white matter focus is compatible with fiber tracts leading to the planum temporale and Heschl gyrus gray matter. Al-though the Talairach-transformed coordinates of the highest
correlation are listed as physically nearest to gray matter of Brodmann area 22 in the Talairach Daemon atlas,15diffusion tensor analysis as well as microanatomy studies show tracts in this region actually extending superiorly into the planum tem-porale and Heschl gyrus.22,23The fact that this abnormality is seen only in the left temporal lobe, and not the right, supports the hypothesis that this white matter deficit may be related specifically to speech and not to general auditory function.
The smaller focus of white matter deficit just below cor-rected statistical significance in the left medial cerebellum de-clive was unexpected in the deaf subjects and was of uncertain significance, but functional imaging studies have shown acti-vation in the declive during verbal tasks.24
Gray Matter Differences in Deaf Persons
[image:4.585.53.536.41.258.2]The absence of gray matter deficits in the auditory cortices of the deaf persons in the present study might be unexpected, but Fig 3.Asymmetry VBM of gray matter in deaf and hearing subjects. Threshold at T⫽7.5, extent threshold at 400 voxels.
Table 2: Voxel-based morphometry: asymmetries in deaf and hearing
MNI Coord
Location
Extent (1-mm Voxels)
T orZ
Score P
x y z
Asymmetry gray matter
Hearing ⫺38 ⫺38 16 Left STG medial to HG 2805 T⫽14.5 .0001
70 ⫺5 27 Right frontal/perisylvian 82,797 T⫽26.4 .0001 ⫺11 ⫺107 ⫺3 Left occipital (Brodmann 18) 5332 T⫽12.9 .0001
Deaf ⫺38 ⫺37 14 Left STG medial to HG 3097 T⫽14.7 .0001
75 ⫺5 ⫺7 Right frontal/perisylvian 69,773 T⫽20.2 .0001 ⫺11 ⫺111 ⫺3 Left occipital (Brodmann 18) 8128 T⫽16.7 .0001 Asymmetry white matter
Hearing 70 ⫺9 9 Left STG medial to HG 2805 T⫽14.5 .0001
43 ⫺30 13 Right frontal/perisylvian 46,352 T⫽15.8 .0001 ⫺14 ⫺56 ⫺15 Left occipital (Brodmann 18) 23,696 T⫽18.6 .0001
Deaf 66 ⫺17 6 Left STG medial to HG 3097 T⫽14.7 .0001
66 ⫺17 ⫺6 Right frontal/perisylvian 39,982 T⫽12.7 .0001 ⫺18 ⫺59 ⫺17 Left occipital (Brodmann 18) 26,918 T⫽15.6 .0001 Asymmetry deaf vs hearing
White matter ⫺50 ⫺18 11 Left STG medial to HG 3576 Z⫽4.4 .047
[image:4.585.51.534.294.509.2]it is concordant with metabolic and perfusion imaging studies demonstrating intact baseline metabolic activity or perfusion in the superior temporal gyrus in the deaf persons3,19,25as well
as the volumetric study of Emmorey et al.18This finding also indirectly supports the hypothesis of altered cortical organiza-tion in the auditory cortices of the deaf persons, suggested by functional imaging studies4,20,21in which the physiology in what are usually auditory and speech areas is preserved but switched to more relevant tasks. Thalamocortical auditory-related inputs might be replaced by smaller transcortical in-puts, possibly posteriorly from the visual occipital or multi-modality parietal lobes. Diffusion tensor analysis might be helpful in the future to address the specific tracts that are altered.
Although below the level of statistical significance when corrected for multiple comparisons (P⬍.059, corrected), a focus of possible deaf gray matter enlargement in the left pre-motor cortex may be related to the report by Penhune et al17of a similar focus of gray matter enlargement also below statisti-cal significance (P⬍.12, corrected) in the hand motor cortex Fig 4.Asymmetry VBM of white matter in deaf and hearing subjects. T threshold at T⫽7.7, extent threshold at 400 voxels.
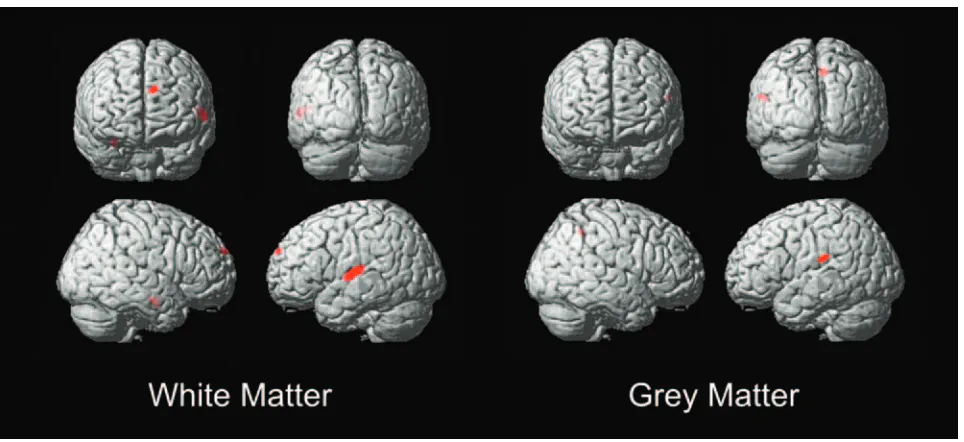
Fig 5.Deaf versus hearing asymmetry VBM of white matter and gray matter. T threshold at T⫽5.7, extent threshold at 200 voxels.
[image:5.585.53.532.42.258.2] [image:5.585.54.536.284.505.2] [image:5.585.54.286.532.652.2](⫺22,⫺11, 72). Although more posterior and slightly more lateral to the coordinates in the present study, it may be a related finding and perhaps, as Penhune et al17 speculate, might be related to “extensive fine motor use of the right hand while signing.”17They note that musicians have been shown to develop similar hand-related motor cortex changes presum-ably related to long-term instrument playing.26The finding in the present study of a more anterior, premotor focus of en-largement might even represent a form of hand-analog of the Broca area, which, instead of being premotor to the vocal ap-paratus, is instead premotor to hand cortex more superiorly. It should be noted that all of the subjects in this study were fluent in American Sign Language and right-handed. The morpho-metric study by Emmorey et al18did not address anatomic sites beyond the temporal lobe.
Hemispheric Lateralization
The broad regions of gray and white matter right-dominant perisylvian and smaller left-dominant occipital foci were qual-itatively similar in the 2 groups, suggesting that this form of broad asymmetry develops largely independent of auditory experience before birth. This gross asymmetry pattern has been referred to by anthropologists as “Yakovlevian torque,” based on the apparent counterclockwise rotation of the fron-tal/occipital lobes in utero, which leaves asymmetric impres-sions, or “petalia,” on the inner skull that can be seen on fossils (reviewed by Toga and Thompson27). The “torquing,” which is thought to be due to the early asymmetric growth of the right frontal lobe, is apparent on this study and is highly sim-ilar to other MR imaging-based VBM studies on healthy sub-jects9,28-30as well as MR imaging morphometric studies on great apes.31Given that this form of gross asymmetry probably occurs early in development in utero, it is not surprising that it remains intact in the congenitally deaf. Recent work suggests cerebral lateralization and handedness may be related to pro-tocadherin XY, a cell surface adhesion molecule that may be involved in axonal guidance (reviewed by Crow32).
On the similarly thresholded asymmetry maps, the hearing subjects show slightly more extensive perisylvian gray and white matter asymmetries than the deaf subjects, possibly re-flecting subtle effects of hearing and speech on brain develop-ment in early childhood. The degree of lateralization on VBM has been variably correlated with sex9 and handedness29; maleness and right-handedness are associated with greater asymmetry. In this study, all subjects were right-handed, and there was a similar representation of sexes in both groups.
The more focal and perhaps more interesting left-domi-nant gray matter asymmetric focus in the posterior superior temporal gyrus was highly similar in the deaf and hearing groups and is again very similar to prior VBM studies on nor-mal subjects.9,30,33This finding of preserved focal gray matter asymmetry in the deaf persons was also reported by Emmorey et al18and Penhune et al17on their manual morphometric measurements of the temporal lobe, suggesting that this form of more focal lateralization in the temporal lobe “speech” area is independent of hearing and speech experience. It should be noted, however, that the deaf subjects were all fluent in sign language, which has been shown in patients with stroke-re-lated sign language aphasia,34Wada studies on deaf patients,35
and more recent functional imaging studies36,37to be largely left-dominant.
In contrast to the gray matter analysis, the white matter analysis revealed no above-threshold left dominance asymme-try in the posterior superior temporal gyrus. Instead, the right-dominant white matter asymmetry appeared to trail off pos-teriorly in the superior temporal gyrus. Although the finding of similar patterns of auditory cortex asymmetry in the deaf and hearing persons might appear to conflict with the direct deaf versus hearing white matter comparison discussed above, this apparent discrepancy might be related in part to the dif-ference in statistical significance thresholds in the 2 comparisons.
VBM Analysis Technique
The VBM technique has strengths and weaknesses compared with more traditional explicit manual morphometric and volumetric measurement techniques. VBM’s greatest strength is that it is automated and unbiased by subjectivity or assump-tions of what forms of measurements in which specific regions are likely to be of interest. On the other hand, there is some loss of spatial resolution and inability to detect potentially inter-esting morphologic abnormalities not reflected in the smoothed and normalized gray and white matter attenuation maps.
The VBM approach lends itself to larger population studies because of its automated technique but also may require rela-tively large numbers of subjects to approach statistical signif-icance on whole-brain analysis. This may explain the lack of findings when using VBM by Penhune et al17with only 12 deaf subjects. Although VBM remains a relatively new technique, and there are controversies about some of the technical aspects and interpretation,38,39it has nevertheless been validated in a number of studies with direct comparison with traditional morphometric techniques40-42and has been shown to have good correlation with pathologic or traditional imaging tech-niques.43,44In some cases, VBM may demonstrate pathology on MR imaging previously seen only at autopsy, such as the multifocal atrophy in Alzheimer disease.45
Conclusion
The finding of focal white matter hypoplasia in the left poste-rior supeposte-rior temporal gyrus adjacent to language cortex in deaf persons supports the hypothesis that early hearing and/or speech experience may play a role in the development of spe-cific tracts related to speech. On the other hand, the preserva-tion of gray matter volume in these same temporal auditory and speech centers suggests that some form of cortical func-tion is probably preserved in these regions. Hemispheric asymmetries, both the broad right perisylvian and left occipi-tal “torquing” and the focal left posterior superior temporal gyrus enlargement, persist in congenital deafness, suggesting that hearing and speech experience are not critical for these developments.
some degree of altered cortical organization and, particularly in regard to language, customized preoperative functional im-aging and/or intraoperative mapping may be helpful.
Currently, much of the medical care of the deaf centers on cochlear implants, and although an improvement in hearing after implantation is almost universal, some patients may still be unable to adequately understand speech in normal conver-sations. This study suggests that there may be a critical period for formation of connections to the left temporal lobe speech centers, and the difficulty encountered by some adult implant patients may be related in part to the hypoplasia of these tracts. Future studies might look for anatomic changes after cochlear implant placement in children or explore changes in the dif-fusion tensor mapping of the auditory system tracts. One might predict that a greater severity of white matter volume loss or tract disorganization could be associated with less suc-cessful speech skills after cochlear implant surgery.
Acknowledgments
The National Technical Institute of the Deaf (NTID) at the Rochester Institute of Technology (Rochester, NY) provided assistance with subjects for this project. Rachel Yotter (Elec-trical Engineering, University of Washington), assisted with the data analysis.
References
1. Mehl AL, Thomson V.The Colorado newborn hearing screening project, 1992–1999: on the threshold of effective population-based universal newborn hearing screening.Pediatrics2002;109:E7
2. Svirsky MA, Teoh SW, Neuburger H.Development of language and speech perception in congenitally, profoundly deaf children as a function of age at cochlear implantation.Audiol Neurootol2004;9:224 –33
3. Lee JS, Lee DS, Oh SH, et al.PET evidence of neuroplasticity in adult auditory cortex of postlingual deafness.J Nucl Med2003;44:1435–39
4. Neville HJ, Bavelier D, Corina D, et al.Cerebral organization for language in deaf and hearing subjects: biological constraints and effects of experience.
Proc Natl Acad Sci U S A1998;95:922–29
5. Finney EM, Clementz BA, Hickok G, et al.Visual stimuli activate auditory cortex in deaf subjects: evidence from MEG.Neuroreport2003;14:1425–27 6. Morita T, Naito Y, Tsuji J, et al.Relationship between cochlear implant
out-come and the diameter of the cochlear nerve depicted on MRI.Acta Otolaryn-gol Suppl2004;56 –59
7. Geschwind N, Levitsky W.Human brain: left-right asymmetries in temporal speech region.Science1968;161:186 – 87
8. Bonvillian JD, Orlansky MD, Garland JB.Handedness patterns in deaf persons.
Brain Cogn1982;1:141–57
9. Good CD, Johnsrude IS, Ashburner J, et al.A voxel-based morphometric study of ageing in 465 normal adult human brains.Neuroimage2001;14:21–36 10. Good CD, Johnsrude I, Ashburner J, et al.Cerebral asymmetry and the effects
of sex and handedness on brain structure: a voxel-based morphometric anal-ysis of 465 normal adult human brains.Neuroimage2001;14:685–700 11. Nichols T, Hayasaka S.Controlling the familywise error rate in functional
neuroimaging: a comparative review.Stat Methods Med Res2003;12:419 – 46 12. Westbury CF, Zatorre RJ, Evans AC.Quantifying variability in the planum
temporale: a probability map.Cereb Cortex1999;9:392– 405
13. Rademacher J, Morosan P, Schormann T, et al.Probabilistic mapping and volume measurement of human primary auditory cortex. Neuroimage
2001;13:669 – 83
14. Brett M.The MNI brain and the Talairach atlas.Available at: http://www.mrc-cbu.cam.ac.uk/Imaging/Common/mnispace.shtml.
15. Lancaster JL, Woldorff MG, Parsons LM, et al.Automated Talairach atlas labels for functional brain mapping.Hum Brain Mapping2000;10:120 –31 16. Moore JK, Niparko JK, Perazzo LM, et al.Effect of adult-onset deafness on the
human central auditory system.Ann Otol Rhinol Laryngol1997;106:385–90 17. Penhune VB, Cismaru R, Dorsaint-Pierre R, et al.The morphometry of
audi-tory cortex in the congenitally deaf measured using MRI.Neuroimage
2003;20:1215–25
18. Emmorey K, Allen JS, Bruss J, et al.A morphometric analysis of auditory brain regions in congenitally deaf adults.Proc Natl Acad Sci U S A2003;100: 10049 –54
19. Kang E, Lee DS, Kang H, et al.Age-associated changes of cerebral glucose metabolic activity in both male and female deaf children: parametric analysis using objective volume of interest and voxel-based mapping.Neuroimage
2004;22:1543–53
20. Finney EM, Fine I, Dobkins KR.Visual stimuli activate auditory cortex in the deaf.Nat Neurosci2001;4:1171–73
21. Shibata DK, Zhong J.Tactile vibrations are heard in auditory cortex in the deaf: study with FMRI.Annual Meeting of the Radiological Society of North America; Chicago, Ill; 2001; p. 259
22. Mamata H, Mamata Y, Westin CF, et al.High-resolution line scan diffusion tensor MR imaging of white matter fiber tract anatomy.AJNR Am J Neurora-diol2002;23:67–75
23. Chang Y, Lee SH, Lee YJ, et al.Auditory neural pathway evaluation on senso-rineural hearing loss using diffusion tensor imaging. Neuroreport
2004;15:1699 –703
24. Gates L, Yoon MG.Distinct and shared cortical regions of the human brain activated by pictorial depictions versus verbal descriptions: an fMRI study.
Neuroimage2005;24:473– 86
25. Shibata DK, Kwok E.Temporal lobe perfusion in the deaf: MR measurement with pulsed arterial spin labeling.Acad Radiol2006;13:738 – 43
26. Munte TF, Altenmuller E, Jancke L.The musician’s brain as a model of neuro-plasticity.Nat Rev Neurosci2002;3:473–78
27. Toga AW, Thompson PM.Mapping brain asymmetry. Nat Rev Neurosci
2003;4:37– 48
28. Kertesz A, Black SE, Polk M, et al.Cerebral asymmetries on magnetic reso-nance imaging.Cortex1986;22:117–27
29. Kertesz A, Polk M, Black SE, et al.Sex, handedness, and the morphometry of cerebral asymmetries on magnetic resonance imaging. Brain Res
1990;530:40 – 48
30. Watkins KE, Paus T, Lerch JP, et al.Structural asymmetries in the human brain: a voxel-based statistical analysis of 142 MRI scans.Cereb Cortex
2001;11:868 –77
31. Pilcher DL, Hammock EA, Hopkins WD.Cerebral volumetric asymmetries in non-human primates: a magnetic resonance imaging study. Laterality
2001;6:165–79
32. Crow TJ.Handedness, language lateralisation and anatomical asymmetry: relevance of protocadherin XY to hominid speciation and the aetiology of psychosis. Point of view.Br J Psychiatry2002;181:295–97
33. Luders E, Gaser C, Jancke L, et al.A voxel-based approach to gray matter asymmetries.Neuroimage2004;22:656 – 64
34. Bellugi U, Poizner H, Klima ES.Brain organization for language: clues from sign aphasia.Hum Neurobiol1983;2:155–70
35. Damasio A, Bellugi U, Damasio H, et al.Sign language aphasia during left-hemisphere Amytal injection.Nature1986;322:363– 65
36. Corina DP, San Jose-Robertson L, Guillemin A, et al.Language lateralization in a bimanual language.J Cogn Neurosci2003;15:718 –30
37. Emmorey K, Damasio H, McCullough S, et al.Neural systems underlying spa-tial language in American Sign Language.Neuroimage2002;17:812–24 38. Ashburner J, Friston KJ.Why voxel-based morphometry should be used.
Neu-roimage2001;14:1238 – 43
39. Bookstein FL.“Voxel-based morphometry” should not be used with imper-fectly registered images.Neuroimage2001;14:1454 – 62
40. Testa C, Laakso MP, Sabattoli F, et al.A comparison between the accuracy of voxel-based morphometry and hippocampal volumetry in Alzheimer’s dis-ease.J Magn Reson Imaging2004;19:274 – 82
41. Giuliani NR, Calhoun VD, Pearlson GD, et al.Voxel-based morphometry ver-sus region of interest: a comparison of two methods for analyzing gray matter differences in schizophrenia.Schizophr Res2005;74:135– 47
42. Eckert MA, Leonard CM, Wilke M, et al.Anatomical signatures of dyslexia in children: unique information from manual and voxel based morphometry brain measures.Cortex2005;41:304 –15
43. Valente AA, Jr., Miguel EC, Castro CC, et al.Regional gray matter abnormali-ties in obsessive-compulsive disorder: a voxel-based morphometry study.Biol Psychiatry2005;58:479 – 87
44. Padovani A, Borroni B, Brambati SM, et al.Diffusion tensor imaging and voxel-based morphometry study in early progressive supranuclear palsy.
J Neurol Neurosurg Psychiatry2005;10:1136 – 48