Metabolite Phantom Correction of the
Nonuniform Volume-Selection Profiles in MR
Spectroscopic Imaging: Application to Temporal
Lobe Epilepsy
J. O. Jesper Lundbom, Kim E. Vuori, Eija K. Gaily, R. I. Marja-Liisa Granstro¨m, Go¨ran C. Blomstedt, Anna-Maija Ha¨kkinen, Sami M. Heikkinen, and Nina M. I. Lundbom
BACKGROUND AND PURPOSE:In MR spectroscopic imaging (MRSI), the volume-selection profiles of metabolites differ from each other. These differences cause variations in metabolite intensities, which are particularly prominent when the hippocampi are evaluated. We hypoth-esize that the errors arising from these effects cause notable artifact when temporal lobe epilepsy (TLE) is lateralized with MRSI.
METHODS:We examined a metabolite phantom, control subjects, and patients with TLE by using MRSI. We calculated the error arising from the different volume-selection profiles of metabolitesin vitroand evaluated this correction in the examination of the control subjects and in the lateralization of epilepsy in the patients.
RESULTS:Without a correction, a considerable error in the metabolite content existed, even deep inside the spectroscopic volume of interest. The result was false asymmetry (P< .008) in the hippocampi of control subjects. Among the 11 patients, TLE was correctly lateralized in three only after the correction was made, and in one, TLE was incorrectly lateralized.
CONCLUSION: The volume-selection profiles of N-acetylaspartate, choline, and creatine differ enough to cause a significant error, even in the metabolite ratios, when patients with TLE are examined with MRSI. We propose a simple phantom method to correct for this error without a need to modify the pulse sequence.
MR spectroscopic imaging (MRSI) is useful in local-izing the focus of seizure in patients with temporal lobe epilepsy (TLE) (1–5) or frontal lobe epilepsy (6, 7). The diseased lobe is identified by assigning an asymmetry percentage that reflects the difference in
N-acetylaspartate(NAA)/(choline [Cho] ⫹ creatine [Cr]) between the temporal lobes. A decreased value of NAA/(Cho ⫹ Cr) defines the ipsilateral or dis-eased side (8).
Spectroscopic imaging with a point-resolved spec-troscopy (PRESS) chemical-shift imaging (CSI) se-quence (9) combines MRSI with the selection of a
volume of interest (VOI) with PRESS localization. The VOI is localized with three section-selective pulses (one 90° and two 180° pulses), and the spatial distribution of metabolites is obtained by using phase encoding. Because the VOI is selected by using pulses applied simultaneously with magnetic field gradients, protons of metabolites with different chemical shifts obtain different excitation volumes. These volumes are displaced with respect to the transmitter fre-quency. The displacement for the signal intensity of a metabolite is proportional to the difference between the resonance frequency of the signal intensity and the transmitter frequency and inversely proportional to the gradient strength. The dimensions of the VOI are determined by using the pulse bandwidth and the gradient strength. Because of radiofrequency power requirements, the bandwidth of the pulse is usually kept constant, and the desired VOI dimension is obtained by varying the gradient strength. This method leads to different volume displacements for VOIs of different sizes. Furthermore, the excitation profiles of section-selective pulses that define the VOI deviate from an ideal rectangular shape (10). This feature is especially pronounced for the 180°
Received May 18, 2004; accepted after revision September 24. From the Helsinki Medical Imaging Center (J.O.J.L., K.E.V., S.M.H., N.M.I.L.); the Department of Pediatric Neurology, Hos-pital for Children and Adolescents (E.K.G., R.I.M.-L.G.); and the Departments of Neurosurgery (G.C.B.) and Oncology (A.-M.H.), Helsinki University Central Hospital, Finland.
Supported by a Special Federal Grant of Helsinki University Hospital, no. TYH 0227, and the Academy of Finland.
Address correspondence to Sami Heikkinen, Helsinki Medical Imaging Center, Helsinki University Central Hospital, Helsinki, Finland, FIN-00029 HUS, Finland, PB 340.
©American Society of Neuroradiology
section-selective pulses of the PRESS sequence. The nonideal excitation profile, together with the volume-displacement artifact originated from the chemical shift, leads to different volume-selection profiles for the metabolites and therefore distorts the spatial dis-tribution of their signals.
The problem associated with the nonideal volume-selection profiles of metabolites in the PRESS CSI sequence is known, and techniques have been imple-mented to correct for it or minimize it. These tech-niques include modification of the pulse sequences (i.e., imaging of the excitation profile and calculating a correction or switching the order of the 90° and 180° pulses) (11–13). To our knowledge, the effect of this error in the lateralization of epileptic foci has not been reported. We hypothesized that the errors aris-ing from these effects cause a significant artifact when TLE is lateralized by using MRSI. To address this problem, we corrected the effects of different vol-ume-selection profiles of metabolites by using a ho-mogenous phantom containing the metabolites stud-ied in vivo. This correction was evaluated in control subjects and in patients with TLE.
Methods
Patients and Control Subjects
Fifteen patients (age range, 9 –50 years) with epilepsy (one left handed [patient 15], 14 right handed) and eight healthy, right-handed control subjects (age range, 11– 46 years) were examined by using MRSI. The diagnoses of epilepsy were based on detailed seizure histories, clinical findings, and EEG
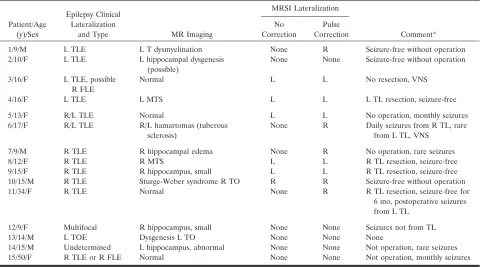
or video EEG (ictal video EEG recordings 11 patients) and MR imaging results. On the basis of these data, 11 patients were determined to have TLE, one had TLE or frontal lobe epilepsy, one had temporo-occipital epilepsy, one had multifo-cal epilepsy (with an abnormal right hippocampus), and one had undetermined epilepsy (with abnormal left hippocampus on MR imaging) (Table 1). The study protocol was approved by the Ethical Committee of Helsinki University Central Hospital, and written informed consent was obtained from all patients and parents. The MRSI data were not used for clinical decision making in planning temporal lobectomy. In the epilepsy sur-gery program, four patients (Table 1) proceeded to temporal lobectomy.
MRSI Study
The measurements were performed on a 1.5-T MR system (Magnetom Vision; Siemens, Erlangen, Germany). A standard PRESS-CSI sequence was used with a TR/TE of 2600/270 and a 16⫻16-cm FOV with 16⫻16 phase encoding steps. In the PRESS CSI sequence, the transmitter frequency is set at water resonance. The VOI was carefully placed to symmetrically cover the hippocampi by using T1-weighted localizer images. The VOI dimensions were as follows: thickness ⫽ 15 mm, anteroposterior dimension ⫽ 60 mm, and right-left dimen-sion⫽80 or 100 mm depending on the size of the brain (80 mm in 11 patients and six control subjects and 100 mm in four patients and two control subjects). Shimming of the VOI and water suppression were manually adjusted after automatic global shimming was done. In the shimming process, the three linear shim gradients were adjusted by maximizing the peak intensity and by minimizing the full width of the water reso-nance at half height while the shape of the peak was simulta-neously preserved.
[image:2.585.54.537.71.339.2]The data were processed by using a CSI postprocessing program (Luise program, Vision; Siemens). Preprocessing steps included zero filling to 1024 data points, filtering with a
TABLE 1: Clinical, MR imaging, and MRSI findings in patients with TLE
Patient/Age (y)/Sex
Epilepsy Clinical Lateralization
and Type MR Imaging
MRSI Lateralization
Comment* No
Correction
Pulse Correction
1/9/M L TLE L T dysmyelination None R Seizure-free without operation 2/10/F L TLE L hippocampal dysgenesis
(possible)
None None Seizure-free without operation
3/16/F L TLE, possible R FLE
Normal L L No resection, VNS
4/16/F L TLE L MTS L L L TL resection, seizure-free
5/13/F R/L TLE Normal L L No operation, monthly seizures
6/17/F R/L TLE R/L hamartomas (tuberous sclerosis)
None R Daily seizures from R TL, rare from L TL, VNS
7/9/M R TLE R hippocampal edema None R No operation, rare seizures
8/12/F R TLE R MTS L L R TL resection, seizure-free
9/15/F R TLE R hippocampus, small L L R TL resection, seizure-free 10/15/M R TLE Sturge-Weber syndrome R TO R R Seizure-free without operation 11/34/F R TLE Normal None R R TL resection, seizure-free for
6 mo, postoperative seizures from L TL
12/9/F Multifocal R hippocampus, small None None Seizures not from TL
13/14/M L TOE Dysgenesis L TO None None None
14/15/M Undetermined L hippocampus, abnormal None None Not operation, rare seizures 15/50/F R TLE or R FLE Normal None None Not operation, monthly seizures
Note.—FLE⫽frontal lobe epilepsy, TOE⫽temporo-occipital epilepsy, MTS⫽mesial temporal sclerosis, TL⫽temporal lobe, VNS⫽vagal nerve stimulation.
50% Hamming filter, and Fourier transformation. One author (J.O.J.L.) without knowledge of the participants manually cor-rected the phase and baseline of the spectra. The signal inten-sities (i.e., signal intensity areas) of NAA, Cho, and Cr were determined by using Gaussian line-shape fitting. To lateralize the patients’ epilepsy, we used an average asymmetry percent-age from the three voxels per hippocampus (Fig 1) as follows: 2⫻100(C⫺I)/(C⫹I) , whereCandIindicate contralateral and ipsilateral NAA/(Cho ⫹ Cr), respectively. The maximal asymmetry of the controls was used as a threshold to classify the patients.
Phantom Correction
A homogenous spherical phantom (GE Medical Systems, Milwaukee, WI) containing an aqueous solution of NAA, Cho, and Cr was measured by using parameters and VOIs identical to those used for measurements in patient, both without and with water suppression. The result of the unsuppressed mea-surement was used to examine the combined effect of volume displacement and the nonideal excitation profile of the PRESS CSI sequence in the right-left direction. The profile was calcu-lated by averaging the water intensity of the two middle rows of voxels from the entire FOV. Water-suppressed MRSI was used to determine the error and the corrections for NAA, Cho and Cr. The principle behind the phantom correction was the valid assumption that the metabolites are homogeneously distrib-uted throughout the phantom. Therefore, any systematic errors in the spatial metabolite profile were due to imperfections in the PRESS CSI sequence. To correct for the errors resulting from the sequence, each voxel in the phantom was used to correct the corresponding voxel from thein vivomeasurements with the identical VOI. The equation used for correction was the following: SC ⫽SM(SPmax/SP), where C is the corrected signal intensity, M is the measured signal intensityin vivo, P is the corresponding voxel signal intensity in the phantom, and Pmax is the voxel with maximum signal intensity in the phan-tom The average metabolite asymmetries of the phanphan-tom were studied with the percentage 2⫻100[(R⫺L)/(R⫹L)], where R and L are the right and left voxels, respectively, that corre-sponded to the location of the hippocampus.
Evaluation of the Method
To evaluate the phantom correction, we examined the me-tabolite content of the hippocampi in the control subjects. The content of NAA and Cho⫹Cr the right and left hippocampus was calculated from representative voxels 1–3. The paired Stu-dent ttest was used to test for differences in the metabolite content between the right and left hippocampus in the control subjects. The mean and standard deviation of the right-to-left ratio of NAA, Cho ⫹ Cr, and NAA/(Cho⫹ Cr) were also calculated.
Results
Phantom Measurements
Figure 2 shows the measured water excitation pro-file in the right-left direction, a propro-file artificially displaced by 10 mm, and their difference. This 10-mm displacement was a good approximation of the vol-ume displacement induced by the chemical-shift dif-ference between NAA and water for a 100-mm-wide VOI on our system. Figure 2 demonstrates the prob-lems arising from effects originating from the chem-ical shift when metabolite intensities with different chemical shifts are compared. The difference was minimal at the center of the VOI but increased with increasing distance from the center.
In the metabolite measurements in the phantom, the voxels on the right side of the VOI had consis-tently increased intensities for all three metabolites. Table 2 presents the asymmetries of NAA, Cr, Cho, and NAA/(Cho⫹Cr) for the averaged voxels corre-sponding to the location of the hippocampus for the
in vivo measurements with the-80 and 100-mm-wide FIG 1. Axial/coronal T1-weighted image at the level of the
hippocampi with the MRSI voxels1,2, and3chosen to repre-sent the hippocampus. The 100- and 80-mm-wide VOIs are shown (white rectangles).
FIG 2. Phantom profile for water signal intensity with the 180°
Hamming-weighted sinc pulse of the PRESS CSI sequence (solid linewithblack boxes) obtained by selecting the right-left dimension of the 100-mm VOI (vertical lines). Profile shifted by 10 mm (dashed linewith white boxes). This displacement ap-proximately corresponds to the chemical-shift difference be-tween water and NAA with the typical excitation bandwidth of 1500 Hz for the section-selective 180° pulse. Images shows the difference between the original profile and the shifted profile spanning the VOI (dotted linewithgray circles). The water inten-sity on theyaxis is expressed in institutional units (i.u.), and the
[image:3.585.53.284.57.269.2] [image:3.585.304.531.58.244.2]VOIs. NAA had the largest asymmetry and Cho the smallest asymmetry, in accordance with their respec-tive chemical shifts. The error for NAA was 18% for the 80-mm VOI.
In Vivo Measurements
Figure 1 shows the six voxels (three per hippocam-pus) chosen to represent the hippocampi. The loca-tion of the hippocampus near the base of the skull and the paranasal sinuses complicated shimming and water suppression in the measurements. Because of this effect, 50% of the spectra in voxel 1, which was closest to the most inhomogeneous region, had to be discarded from the analysis. In voxels 2 and 3, 90% of the spectra were free from distortion and were included.
Control Subjects
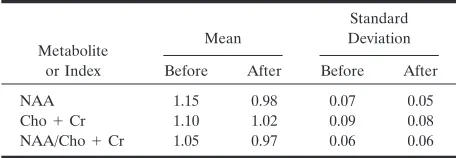
Without the correction, the right hippocampus had NAA (P⫽.0009) and Cho⫹Cr (P⫽.008) intensities significantly higher than those of the left hippocam-pus. After phantom correction, no significant asym-metry remained (P⬎ .21). When the correction was applied, the right-left ratio approached the value for one for the individual metabolites, as well as for NAA/(Cho ⫹ Cr). The standard deviation of the right-left ratio decreased for NAA and Cho⫹Cr but did not change considerably for NAA/(Cho ⫹ Cr) (Table 3).
The asymmetry percentages for NAA/(Cho ⫹Cr) in control subjects were calculated, and the highest was chosen as the threshold level for the evaluation of patients. The threshold levels were 13% and 16% with and without correction, respectively.
Patients
The patients were classified according to their asymmetry percentage for NAA/(Cho ⫹ Cr). In
pa-tients whose asymmetry percentage exceeded the threshold level of the control subjects, epilepsy was considered lateralized. With uncorrected MRSI, epi-lepsy was lateralized to the left in five patients, it was lateralized to the right in one patient, and it was not lateralized in nine. Correction for the effects of the volume-selection profile changed the MRSI lateral-ization in four patients from not lateralized to later-alized to the right, resulting in five cases laterlater-alized to the left, five to the right, and five not lateralized.
In 11 patients, the classification did not change after the correction. In four patients, the asymmetry increased by 9% for NAA/(Cho ⫹ Cr) with the 80-mm VOI (Table 2) from 7–15% to 16 –24%, alter-ing the classification from not lateralized to ized to the right. In three of these patients, lateral-ization could be considered accurate after the correction: Two (patients 7 and 11) had converging clinical, video EEG, and MR imaging findings, and one (patient 6) had daily right temporal seizures and monthly left temporal seizures. (Both seizure types were documented on video EEG.) In the fourth pa-tient (papa-tient 1), the corrected lateralization dis-agreed with MR imaging data; this patient, whose seizures had not been recorded on video EEG, had had left temporal dysmyelination but was seizure-free for several years before MRSI. In one patient with TLE (patient 2) and all four patients with other types of epilepsy (patients 12–15), their condition was not lateralized even after the correction. In three patients (patients 1, 8, and 9), MRSI lateralization disagreed with clinical lateralization. In two (patients 8 and 9), lateralization to the right was confirmed by a good outcome after right temporal lobectomy.
Discussion
[image:4.585.54.282.81.134.2]Various techniques have been developed to mini-mize or correct for the effects of the nonideal excita-tion profiles of volume-selecexcita-tion pulses and for vol-ume-displacement effects with MRSI. The VOI-prescribing pulses have been switched to minimize the error in the most important direction. When the less distorted 90° pulse prescribes the VOI in the right-left direction, less error is introduced (11). The transmitter frequency can also be shifted from water at 4.7 ppm to the metabolite region at 2.7 ppm to minimize the chemical shift– originated displace-ments of the metabolite VOIs, if the MR spectro-scopic sequence supports this feature. The excitation profiles of the volume-selection pulses can also be measured and corrected for in postprocessing. The PRESS sequence can be modified to measure the pulse profile with conventional imaging (12, 13). When the profile is known, the errors resulting from the volume displacement of the PRESS VOI can be calculated. However, this calculation requires rela-tively detailed knowledge of sequence parameters, which is usually not readily available. The proposed phantom method is simple for correcting the problem without the need to resort to technical modifications or to detailed parameter data. For example, no TABLE 2: Intensity asymmetry percentage in the phantom voxels
corresponding to the hippocampi
VOI Width
(mm) Cho Cr NAA
NAA/ (Cho⫹Cr)
80 mm 7.9⫾3.2 9.3⫾3.4 18.1⫾1.4 9.4⫾1.5 100 mm 4.0⫾4.4 7.5⫾1.9 9.3⫾1.3 3.8⫾1.5
Note.—Intensity asymmetry percentage⫽2⫻100[(R⫺L)/(R⫹
[image:4.585.53.281.191.270.2]L)]. Data are the mean percentage⫾standard deviation.
TABLE 3: Means and standard deviations for the right-left ratios of hippocampal metabolites in control subjects before and after correction
Metabolite or Index
Mean
Standard Deviation
Before After Before After
NAA 1.15 0.98 0.07 0.05
knowledge of the gradients, pulse bandwidths, or transmitter frequency is needed. The method can easily be applied in a clinical environment, and the state of the hippocampi can be evaluated by means of direct left-right comparison of metabolite levels and ratios in a single patient.
Our phantom measurements showed that the me-tabolite profiles of a homogeneous sample were con-siderably asymmetric. The voxels on the right side of the phantom that corresponded to the location of the hippocampus had consistently increased metabolite intensities for the 80- and 100-mm VOI. This finding is demonstrated in Figure 2, where the displaced profile corresponding to NAA produced high inten-sity on the right side of VOI. Also, Cho and Cr had similar effects, as both signals had resonance frequen-cies lower than that of water. The degree of asymtry was proportional to the chemical shift of the me-tabolite and the size of the VOI (Table 2), as predicted in theory. The asymmetries of the 100-mm VOI were small because the voxels corresponding to the hippocampus were deep inside the VOI, as shown in Figure 1. The evaluation of the control subjects showed that the correction improved the standard deviation of the right-left ratio for NAA and Cho ⫹ Cr and that the maximal asymmetry decreased.
In healthy control subjects, an even metabolite dis-tribution between the right and left hippocampi can be assumed. This assumption has been shown to be true with single-voxel spectroscopy (14) and with MRSI (15). However, there is speculation about a natural asymmetry of NAA/(Cho⫹Cr) in the human brain, mainly due to the domination of the left hemi-sphere in more than 90% of the population. Accord-ingly, the right-left ratio would be less than 1, as Bernard et al (16) reported. Our original data showed significantly increased signal intensity for NAA and Cho ⫹ Cr in the right hippocampus, which contra-dicts the views of an even metabolite distribution and that of a natural asymmetry. By applying the phantom correction, the significant difference between the right and left hippocampi disappeared, and the aver-age right-left ratio approached 1.
When we classified the patients’ condition as later-alized or not laterlater-alized with the threshold obtained from the control subjects, the classification changed in four patients from not lateralized to lateralized with the correction. In all patients whose classifica-tion changed, their disease was finally lateralized to the right. This was a result of the original tendency of the sequence to cause overestimation of the metabo-lites, as well as the NAA/(Cho ⫹ Cr) value, in the right hippocampus compared with the left (Fig 2). MRSI lateralization agreed with clinical lateralization in three of these patients (patients 6, 7, and 11) and with the postoperative result in one (patient 11).
In five patients, MRSI result were not lateralized even after the correction. This group included all four patients (patients 12–15) who were clinically deter-mined not to have mesial TLE (multifocal, undeter-mined, temporal or frontal, and temporo-occipital TLE) and one patient (patient 2) with left
hippocam-pal dysgenesis. In two of the three patients whose MRSI lateralization disagreed with clinical lateraliza-tion (patients 8 and 9), the latter was confirmed by a good outcome after resection of the temporal lobe. This result supports the view Suhy et al (17) pre-sented, in that metabolically abnormal hippocampus, as shown on MRSI lateralization, may not always be the primary origin of seizures. Accordingly, the de-gree of metabolic asymmetry between the hip-pocampi (i.e., lateralization) would not be a good prediction of the surgical outcome. Rather, the gen-eral metabolite level (i.e., the degree of NAA de-crease) of both hippocampi would be a more impor-tant factor, where better-preserved hippocampal metabolism is predictive of a good outcome indepen-dent of asymmetry. Further studies are needed to elucidate the role of MRSI in the preoperative eval-uation of patients with TLE.
We did not use segmentation to correct for possible CSF contamination of the data for two reasons. First, because the control subjects did not have hippocam-pal atrophy, segmentation was not regarded as being necessary, even when individual metabolites were evaluated. Second, in the patient evaluation, only metabolite ratios were used.
Conclusion
We measured and corrected the effects that the nonideal excitation profiles of the volume-selection pulses and the chemical shift– originated volume dis-placement introduce to the metabolite distribution in MRSI. These distorting effects were significant at the location of the hippocampus. The different classifica-tions of the patients with and without correction in-dicated that a correction is necessary with MRSI. The use of a phantom correction for MRSI is easy to apply in clinical settings because it allows for direct and accurate left-right comparison of patient data, as well as for indications other than the assessment of TLE. The advantage of the method presented here is mainly its simplicity.
References
1. Connelly A, Jackson GD, Duncan JS, King MD, Gadian DG. Magnetic resonance spectroscopy in temporal lobe epilepsy. Neu-rology1994;44:1411–1417
2. Hugg JW, Laxer KD, Matson GB, Maudsley AA, Weiner MW. Neuron loss localizes human temporal lobe epilepsy by in vivo proton magnetic resonance spectroscopic imaging. Ann Neurol
1993;34:788 –794
3. Cendes F, Andermann F, Preul MC, Arnold DL.Lateralization of temporal lobe epilepsy based on regional metabolic abnormalities in proton magnetic resonance spectroscopic images.Ann Neurol
1994;35:211–216
4. Ng TC, Comair YG, Xue M, et al.Temporal lobe epilepsy: presur-gical localization with proton chemical shift imaging. Radiology
1994;193:465– 472
5. Mueller SG, Laxer KD, Suhy J, Lopez RC, Flenniken DL, Weiner MW.Spectroscopic metabolic abnormalities in mTLE with and without MRI evidence for mesial temporal sclerosis using hip-pocampal short-TE MRSI.Epilepsia2003;44:977–980
7. Stanley JA, Cendes F, Dubeau F, Andermann F, Arnold DL. Proton magnetic resonance spectroscopic imaging in patients with extratemporal epilepsy.Epilepsia1998;39:267–273
8. Vikhoff-Baaz B, Malmgren K, Jonsson L, et al.Lateralisation with magnetic resonance spectroscopic imaging in temporal lobe epi-lepsy: an evaluation of visual and region-of-interest analysis of metabolite concentration images.Neuroradiology2001;43:721–727 9. Luyten PR, Marie¨ JH, den Hollander JA.Acquistion and
quanti-tation in proton spectroscopy.NMR Biomed1991;4:64 – 69 10. Wild JM, Marshall I.Normalisation of metabolite images in 1H NMR
spectroscopic imaging.Magn Reson Imaging1997;15:1057–1066 11. Capizzano AA, Vermathen P, Laxer KD, et al. Temporal lobe
epilepsy: qualitative reading of 1H MR spectroscopic images for presurgical evaluation.Radiology2001;218:144 –151
12. McLean MA, Woermann FG, Barker GJ, Duncan JS.Quantitative analysis of short echo time (1)H-MRSI of cerebral gray and white matter.Magn Reson Med2000;44:401– 411
13. Weber-Fahr W, Ende G, Braus DF, et al.A fully automated method for tissue segmentation and CSF-correction of proton MRSI me-tabolites corroborates abnormal hippocampal NAA in schizophre-nia.Neuroimage2002;16:49 – 60
14. Choi CG, Frahm J.Localized proton MRS of the human hippocam-pus: metabolite concentrations and relaxation times.Magn Reson Med1999;41:204 –207
15. Schuff N, Ezekiel F, Gamst AC, et al.Region and tissue differences of metabolites in normally aged brain using multislice 1H magnetic resonance spectroscopic imaging.Magn Reson Med2001;45:899 –907 16. Bernard D, Walker PM, Baudouin-Poisson N, et al.Asymmetric metabolic profile in mesial temporal lobes: localized H-1 MR spec-troscopy in healthy right-handed and non-right-handed subjects.
Radiology1996;199:381–389