AGING AND CREEP OF
NON-PLASTIC SILTY SAND
A thesis submitted in partial fulfillment of the requirement for the
Degree of Doctor of Philosophy
in the
Department of Civil and Natural Resources Engineering
Muhamad Yusa
University of Canterbury
Christchurch, New Zealand
i
Abstract
Soil aging refers to the increase in strength and stiffness that is exhibited over time after it is disturbed. It is common in granular soils, such as sands, occurring over periods from hours to years. There have been relatively numerous laboratory studies on sand aging phenomena. However the majority of these studies were conducted on relatively clean sand (fines content <5%) and were performed under isotropic condition. In nature, granular soils with fines content > 5% are not uncommon.
This research is an attempt to gain further insight and understanding of mechanical aging on silty sand by conducting laboratory studies mostly under K0 condition, which better reflects the field condition, at both macro-scale (triaxial test) and micro-scale (fabric test). As many factors (e.g. plasticity of fines, fines content, grain size composition, angularity and shape) affect silty sand behaviour and not all those factors could be investigated during the study period, this study focused on mechanical aging of non-plastic silty sand with 15% fines content.
ii
in a tendency of increasing horizontal stress with time even at low stress. (2) Following K0 consolidation, density appears to have more significant effect on creep compared to initial shear stress ratio and mean effective stress; as demonstrated by loose samples (low stress ratio and mean effectives stress) which exhibited greater creep compared to those of dense sample (higher stress ratio and mean effective stress) (3) For loose soils, there is a trade-off between high confining stresses driving aging and collapsing pore space. Generally higher confining stress was found to increase creep tendency thus enhancing aging, however there was also found to be a certain confining pressure where the aging effects became less due to local structure collapse. (4) Initial fabric plays an important role on creep development, thus aging. For instance, dense dry pluviated samples developed larger axial strain over time but also gained less increase in stiffness compared to dense moist tamped samples. This suggests the importance of specimen preparation for laboratory testing that replicates the field scenarios e.g. natural deposition and associated fabric; (5) Dense K0 consolidated samples produce more increase in stiffness with time than corresponding isotropically consolidated samples. Hence, as the K0 condition generally reflects the level-ground free field stress condition better, it is important to test under K0 if the degree of stiffness gain is important; (6) The number of cycles to trigger cyclic softening and liquefaction for one way cyclic loading increases with the aging duration. In addition there is tendency that the aging effect is more pronounced at lower cyclic stress ratios.
iii
dense samples while those of loose samples contracted; (4) A new parameter, variance to mean void ratio of void distance, was introduced as a measure of the degree of interlocking during aging. The variance to mean ratio of void distance for moist tamped samples tends to decrease whereas those of dry pluviated samples tends to increase with time. An increase in variance and variance to mean ratio for dry pluviated samples indicates that particles are more clustered together with time; (5) Original work on spatial void distance for the numerical analysis of creep induced aging based on Kang et al. (2012) was conducted (note: the model’s boundary condition allows lateral expansion, which is not the same as the fabric tests conducted). The analysis showed that mean void size in dense soil tends to increase with time under constant load while for loose sample it tends to decrease. However the particles also clustered together more – increasing structure. (6)
A microstructural study of “undisturbed samples”, obtained by gel-push sampling, of clean sand (fines content = 4%) and silty sand (fines content = 30%), was conducted to investigate anisotropy of natural fabric of granular soils. The results show that dry pluviation reflects the field condition more, in terms of natural deposition, than moist tamping. In addition, spatial void distance qualitatively indicated the undisturbed samples are relatively “very young”, even in terms of engineering time, as indicated by similar variance to mean ratio and kurtosis with those of 1 hour and 1 week reconstituted samples.
iv
Acknowledgements
All praise and thank belong to the Allah, Lord of all universe.
Firstly, I would like to thank Prof. Misko Cubrinovski and Dr. Elisabeth
Bowman. Their advise, expertise and continuous support have been invaluable.
I would like to express my sincere gratitude to Dr. Elisabeth Bowman for
introducing me to the topic and for being patient in guiding and encouraging
me throughout of the course of my Phd research. I would like also to say my
sincere gratitude to Prof. Misko Cubrinovski who has opened the way for the
funding during my study.
I am also indebted to Sean Rees who have taught and helped me
regarding the use GDS Triaxial. Many thank for Siale Faitatonu who helped to
order the required materials for my experimental test. I am obliged also to say
thank you to others technician, in particular John Koolos, who spent his skill
and time developing the local data logging systems and fixing all the
mechanical and electrical problems; Rob spiers and Kevin Stobbs who taught
me how to grind and polish the sample; Mike Flaws, who helped me with the
scanning electron microscope. Many thanks also to all departmental staffs who
have been very supportive. I wish to extend my thanks to other students of
geotechnical group: Jawad, Merrick, Catherine, Kelly who have made my Phd
experience more enjoyable. I am grateful to Directorate of Higher Education of
Indonesia and EQC Capability Funding Research Project who funded my
study.
Finally and foremost, I must express million thanks to my wife Evelyn,
my daughter Shavina Alifia whose love always accompany me throughout my
winding Phd journey. To my beloved parents, without whom I would not be
v
love, moral support to keep me going and for all your sincere pray during night
vi
CONTENT
Abstract
…...………i
Acknowledgement
………iv
Content
………vi
List of Figures
………ix
List of Tables
………xvii
CONTENT ... vi
LIST OF FIGURES ... ix
LIST OF TABLES ... xviii
1 Introduction ... 1
1.1 Background ... 1
1.2 Aim and Objectives ... 3
1.3 Limitation ... 3
1.4 Thesis Organization ... 4
1.5 Terminology ... 5
2 Aging and Creep of Granular Soil ... 7
2.1 Introduction ... 7
2.2 Aging of Granular Materials ... 7
2.2.1 Sand aging previous studies based on soil types ... 7
2.2.2 Aging effects ... 10
2.2.3 Aging Mechanism ... 24
2.3 Creep ... 29
2.3.1 General ... 29
2.3.2 Observation of Creep from Experimental Tests ... 31
2.3.3 Creep Induced Aging Observed in Numerical Simulations.... 32
2.4 Summary ... 38
3 Materials and Methods ... 39
3.1 Introduction ... 39
3.2 Materials ... 39
3.2.1 Index properties... 39
3.2.2 Particle shape and mineralogy ... 41
3.3 Experimental Method - Triaxial Tests ... 44
3.3.1 Apparatus ... 45
3.3.2 Development of Local LVDT data logging system ... 51
3.3.3 Sample preparation ... 53
3.3.4 Sample set up ... 55
3.3.5 Saturation ... 57
3.3.6 Consolidation ... 57
3.3.7 Creep ... 59
3.3.8 Shear... 59
vii
3.4.1 Specimen preservation ... 60
3.4.2 Coupon preparation ... 63
3.4.3 Image capture ... 66
3.4.4 Image Processing ... 68
3.4.5 Overview of preliminary image analysis ... 70
3.5 Summary ... 71
4 Observation of Creep ... 73
4.1 Introduction ... 73
4.2 Definitions ... 75
4.3 Creep Following K0 Consolidation ... 76
4.3.1 K0 consolidation ... 76
4.3.2 Dense moist tamped samples ... 78
4.3.3 Loose moist tamped samples ... 81
4.3.4 Combined effects of confining pressure and stress ratio ... 82
4.4 Creep Following Isotropic Consolidation ... 89
4.4.1 General ... 89
4.4.2 Loose moist tamped samples ... 89
4.4.3 Dense moist tamped samples ... 91
4.4.4 Dry pluviated samples ... 96
4.5 Discussion ... 100
4.5.1 Local and external measurement ... 100
4.5.2 Creep behavior of K0 consolidated samples ... 101
4.5.3 Creep comparisons: K0 consolidated versus isotropically consolidated samples... 107
4.5.4 Creep comparisons: moist tamped versus dry pluviated samples 116 4.5.5 Overview of factors affecting creep used in this study ... 118
4.6 Summary ... 119
5 Aging Effects on Undrained Small-Strain Stiffness ... 122
5.1 Introduction ... 122
5.2 Review ... 122
5.2.1 Importance of small-strain stiffness ... 122
5.2.2 Undrained behavior of silty sand ... 123
5.3 Undrained Monotonic Compression Test ... 126
5.3.1 K0 consolidated samples ... 128
5.3.2 Isotropically consolidated samples ... 140
5.3.3 Discussion ... 142
5.4 Undrained Cyclic Compression Test ... 151
5.4.1 General ... 151
5.4.2 Results ... 153
5.4.3 Discussion ... 156
5.5 Summary ... 157
6 Microstructure Study of Aging of Silty Sand ... 159
6.1 Introduction ... 159
6.2 Review ... 161
viii
6.2.2 Fabric measurements ... 163
6.3 Microstructure changes of dense samples ... 168
6.3.1 Orientation distribution ... 168
6.3.2 Spatial distance distribution ... 174
6.4 Microstructure changes of loose samples ... 187
6.4.1 Orientation distribution ... 187
6.4.2 Spatial distance distribution ... 193
6.5 Observation of Void distance Changes due to Creep Induced Aging from Numerical Modeling ... 210
6.5.1 General ... 210
6.5.2 Results ... 213
6.6 Discussion ... 222
6.6.1 Initial fabric ... 222
6.6.2 Density and relative number of grain contacts ... 223
6.6.3 Density and role of fines ... 223
6.6.4 Effect of aging time ... 224
6.6.5 Force chain change over time from DEM ... 226
6.7 Microstructure of Natural Sand from ‘Gel-Push Sampling’ ... 227
6.7.1 General ... 227
6.7.2 Material properties ... 228
6.7.3 Captured and processed images ... 228
6.7.4 Orientation measure ... 229
6.7.5 Void distance distribution ... 232
6.8 Summary ... 235
6.8.1 Microstructure of silty sand ... 236
6.8.2 Suggested creep induced aging mechanism of silty sand in this study 237 7 Conclusions and Future Research ... 239
7.1 General Conclusions ... 240
7.2 Creep Observations ... 241
7.3 Aging Effects on Undrained Small –Strain Stiffness ... 242
7.4 Silty Sand Microstructure and Its Changes during Aging ... 242
7.4.1 Initial fabric ... 242
7.4.2 Effect of sustained loading with time ... 243
7.5 Future Research ... 245
7.5.1 Experimental aspect ... 245
7.5.2 Theoretical aspect ... 245
References ... 246
ix
LIST OF FIGURES
Figure 1-1 Normalized increase in cone penetration resistance with time after deep dynamic compaction on 10 m sand with layer of silty sand (After
Schmertmann, 1991) ... 2
Figure 2-1 Rate of cone penetration resistance as result of sand aging (Mitchell, 2008) ... 12
Figure 2-2 Increase in axial pile capacity with time for driven piles in sand (Axelsson, 2000) ... 12
Figure 2-3 Aging effects on small stress-strain response (Howie et al., 2002) 14 Figure 2-4 Variations in the small-strain shear-modulus increment and the axial strain in Ottawa sand samples with different relative densities (Wang & Tsui, 2008) ... 15
Figure 2-5 Effect of fines on aging behavior (Wang & Tsui, 2009) ... 15
Figure 2-6 Aging effect to shear wave velocity from seismic cone Penetration test (Howie & Amini, 2004) ... 17
Figure 2-7 Aging effect on angle of friction and compressibility (Al-Sanad & Ismael, 1996) ... 18
Figure 2-8 Aging effect on cyclic strength of silty sand (Troncoso et al. 1990)19 Figure 2-9 Aging effects to lateral stress in retaining wall (Terzaghi, 1934) .. 20
Figure 2-10 Horizontal stress and surface settlement during sustained vertical load (Jirathanathaworn, 2009) ... 22
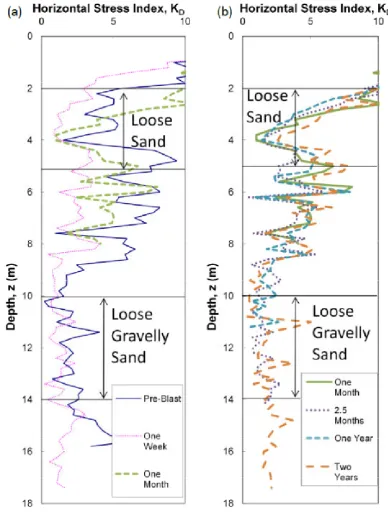
Figure 2-11(a) Horizontal stress index versus time up to one month ... 23
Figure 2-12 Dissolution rate of silica as a function of time (Wilding et al., 1977) ... 27
Figure 2-13 Silica dissolution and precipitation under contact stress (After Sheldon et al., 2003) ... 27
Figure 2-14 Grains under constant pressure: (a) initial state (b) precipitated silica around grains providing cementation between grains (after Sheldon et al., 2003) ... 28
Figure 2-15 Blast-gas bubble producing arching of particles and loose sand pockets (adapted from Hryciw, 1986) ... 29
Figure 2-16 Definition of creep (Augustesen et al., 2004) ... 30
Figure 2-17 Creep classification (Augustesen et al., 2004) ... 30
Figure 2-18 Typical post-aging stress-strain relationship (Tatsuoka et al., 2000) ... 32
Figure 2-19 Aging modelling (Suarez et al, 2009)... 34
Figure 2-20 Pore size distribution (Kang, 2012) ... 35
Figure 2-21 Evolution of average coordination number during creep (Kang, 2012) ... 36
Figure 2-22 Evolution of pore space during creep (a) loose (b) dense ... 37
Figure 2-23 Change in pore orientation during creep (Kang et al, 2012) ... 38
Figure 3-1 Grain size distribution of sand and silt fraction (inset) ... 40
x
Figure 3-4 Microphotograph of sand used in this study ... 42
Figure 3-5 Microphotograph of silt used in this study ... 43
Figure 3-6 Analytical spectrums of the material in this study ... 44
Figure 3-7 Overview of triaxial testing system ... 46
Figure 3-8 Schematic diagram of digital volume change controller (GDS Handbook, 2000) ... 48
Figure 3-9 ‘In house’ axial LVDT pads (a) and gauge length (b) ... 50
Figure 3-10 ‘In house’ radial belt ... 50
Figure 3-11 Temperature effect on volume change ... 53
Figure 3-12 Specimen after set up inside the triaxial chamber ... 56
Figure 3-13 Radial strain control during K0 consolidation (a) local (b) external 58 Figure 3-14 Relationship between K0 and mean effective stress ... 59
Figure 3-15 Impregnation set up ... 62
Figure 3-16 Impregnated specimen ... 63
Figure 3-17 Diamond slab saw (left) and Isomet precision saw (right) ... 64
Figure 3-18 Grinder/Polisher machine and jig ... 65
Figure 3-19 Example image after grounded using no. 600 abrasive disc ... 66
Figure 3-20 Image sample under light microscope (a) thin section (b) thick section ... 67
Figure 3-21 SEM image from secondary electron (a) back scatter mode (b).. 68
Figure 3-22 Example of image processing using ImageJ ... 70
Figure 3-23 Determination of representative elementary area ... 71
Figure 4-1 Typical strain path before creep i.e. 1 day of aging samples at 120, 60 and 30 kPa confining pressure (a) dense samples: CKoU-2; CKoU-5; CKoU-8 (b) loose samples: CKoU-14; CKoU-17; CKoU-20 ... 77
Figure 4-2 Typical stress path before creep i.e. .e. 1 day of aging samples (a) dense samples: 2; 5; 8 (b) loose samples: CKoU-14; CKoU-17; CKoU-2 at 120, 60 and 30 kPa confining pressure, respectively ... 77
Figure 4-3 Typical strains development during creep of dense samples at 60 kPa confining pressure (CKoU-4, CKoU-5 and CKoU-6) for 1 hour, 1 day and 1 week of creep time, respectively ... 79
Figure 4-4 Typical strains development during creep of loose sample at 60 kPa confining pressure (CKoU-16, CKoU-17 and CKoU-18) for 1 hour, 1 day and 1 week of creep time, respectively ... 82
Figure 4-5 Creep of K0 consolidated dense samples i.e. 1 day creep (CKoU-2, CKoU-5 and CKoU-8) at 120, 60 and 30 kPa confining pressure, respectively ... 84
Figure 4-6 Creep of K0 consolidated dense samples i.e. 1 week creep (CKoU-3, CKoU-6 and CKoU-9) at 120, 60 and 30 kPa confining pressure, respectively ... 85
xi
Figure 4-8 Creep of K0 consolidated loose samples i.e. 1 week creep (CKoU-15,
CKoU-18 and CKoU-21) at 120, 60 and 30 kPa of confining pressure, respectively ... 88 Figure 4-9 Strains of isotropically consolidated loose samples at 30kPa confining
pressure (TWIU-34 and TWIU-35) for 1 hour and 1 week creep, respectively ... 90 Figure 4-10 Strains of isotropically consolidated dense samples at 30kPa
confining pressure (CIU-10, CIU-11&CIU-12) for 1 hour, 1 day and 1 week of creep... 92 Figure 4-11 Average peak stress and cumulative force during tamping for
various relative densities (Frost & Park, 2003) ... 93 Figure 4-12 Strains of isotropically consolidated dense samples of 1 day creep
(CIU-11 &CIU-27) at 30 kPa and 60 kPa of confining pressure, respectively ... 95 Figure 4-13 Strains of K0 consolidated dry pluviated dense samples at 60kPa
confining pressure (CIU-22&CIU-23) for 1 min and 1 day creep time98 Figure 4-14 Strains of isotropically consolidated dry pluviated dense samples at
60kPa confining pressure (CIU-24&CIU-25) for 1 min and 1 day creep time ... 99 Figure 4-15 Suggested non-uniform creep strains between both end of the sample
and that in the middle due to the use of lubricated ends ... 101 Figure 4-16 Development of strain with time for dense sample (after Bowman,
2002) ... 105 Figure 4-17 Development of strain with time for loose sample (after Bowman,
2002) ... 105 Figure 4-18 Comparison of 1 hour creep of loose moist tamped samples at 30
kPa confining pressure following K0 and isotropic consolidation
(CKoU-19&TWIU-34) ... 108 Figure 4-19 Comparison of 1 week creep of loose moist tamped samples at 30
kPa confining pressure following K0 and isotropic consolidation
(CKoU-21&TWIU-35) ... 109 Figure 4-20 Comparison of 1 day creep of dense moist tamped samples at 30kPa
confining pressure following K0 and isotropic consolidation (CKoU-8
&CIU-11) ... 111 Figure 4-21 Comparison of 1 week creep of dense moist tamped samples at
30kPa confining pressure following K0 and isotropic consolidation
(CKoU-9 & CIU-12) ... 112 Figure 4-22 Comparison of 1 day creep of dense moist tamped samples at 60kPa
confining pressure following K0 and isotropic consolidation
(CKoU-5&CIU-27) ... 113 Figure 4-23 Comparison of 1 day creep of dense dry pluviated samples at 60kPa
confining pressure following K0 and isotropic consolidation
(CKoU-23&CIU-25) ... 115 Figure 4-24 Creep comparison of 1 day creep at 60kPa confining pressure
xii
Figure 5-1 Typical shear strains in geotechnical engineering (Atkinson & Sallfors, 1991) ... 123 Figure 5-2 Undrained behavior of dense silty sand (Yamamuro & Wood, 2004)
... 124 Figure 5-3 Undrained behavior of loose silty sand (Lade & Yamamuro, 1997)
... 125 Figure 5-4 Stress paths obtained from K0 consolidated samples after 1 week
aging (a) dense i.e. CKoU-3, CKoU-6&CKoU-9 (b) loose i.e. CKoU-15, CKoU-18&CKoU-21 at 120, 60 and 30 kPa confining pressure, respectively ... 128 Figure 5-5 Example of aging effects on stress-strain response of K0 dense
samples at 120 kPa confining pressure (CKoU-1 – 1 hour, CKoU-2 –1 day and CKoU-3 – 1 week of aging time, respectively) ... 129 Figure 5-6 Example of the influence of aging on stress-strain response of loose
samples at 120 kPa confining pressure (CKoU-13-1 hour, CKoU-14-1 day and CKoU-15-1 week aging, respectively) ... 130 Figure 5-7 Small-strain q versus εs of dense K0 consolidated samples for 1 hour,
1 day and 1 week of aging times respectively at (a) 120kPa (CKoU-1, CKoU-2&CKoU-3); (b) 60 kPa (CKoU-4, CKoU-5&CKoU-6) and (c) 30kPa (CKoU-3, CKoU-6&CKoU-9) of confining pressure ... 132 Figure 5-8 Small-strain ∆q versus εs of dense K0 consolidated samples for 1
hour, 1 day and 1 week of aging times, respectively at (a) 120 kPa (CKoU-1, CKoU-2&CKoU-3), (b) 60 kPa (CKoU-4, CKoU-5&CKoU-6) and (c) 30 kPa (CKoU-3, CKoU-6&CKoU-9) of confining pressure ... 133 Figure 5-9 Shear modulus of dense K0 consolidated samples for 1 hour, 1 day
and 1 week of aging times, respectively at (a) 120 kPa (1, CKoU-2&CKoU-3), (b) 60 kPa (CKoU-4, CKoU-5&CKoU-6) and (c) 30 kPa (CKoU-3, CKoU-6&CKoU-9) of confining pressure ... 135 Figure 5-10 Shear modulus dense K0 consolidated samples for (a) 1 hour
(CKoU-1, CKoU-4& CKoU-7), (b) 1 day (CKoU-2, CKoU-5& CKoU-8) and (c) 1 week (CKoU-3, CKoU-6& CKoU-9) of aging time ... 136 Figure 5-11 Small-strain q versus εs of loose K0 consolidated samples for 1 hour,
1 day and 1 week of aging times, respectively at (a) 120 kPa (CKoU-13, CKoU-14&CKoU-15), (b) 60 kPa (CKoU-16, CKoU-17&CKoU-18) and (c) 30 kPa (CKoU-19, CKoU-20&CKoU-21) of confining pressure 137 Figure 5-12 Small-strain ∆q versus εs of loose K0 consolidated samples for 1
hour, 1 day and 1 week of aging times, respectively (a) 120 kPa (CKoU-13, CKoU-14&CKoU-15), (b) 60 kPa (CKoU-16, CKoU-17&CKoU-18) and (c) 30 kPa (CKoU-19, CKoU-20&CKoU-21) of confining pressure ... 138 Figure 5-13 Shear modulus of loose K0 consolidated samples for 1 hour, 1 day
xiii
Figure 5-14 Aging effects of 30 kPa confining pressure for 1 hour and 1 week of aging time, respectively on dense isotropically consolidated i.e. CIU-10&CIU-12 (p’=30kPa) and dense K0 consolidated samples i.e.
CKoU-7&CK0U-9 (p’=40.4 kPa)... 141
Figure 5-15 Shear modulus of isotropic consolidated dense samples (60 kPa confining pressure) for 1 minute and 1 day of aging time, respectively for moist tamped (CIU-26&CIU-27) vs. dry pluviated (CIU-24&CIU-25) preparation... 142 Figure 5-16 One way and two way cyclic loading. Note A=loading amplitude,
T=loading period (Rees, n.d.) ... 151 Figure 5-17 Aging effects on two-way cyclic resistance (Saftner, 2011) ... 152 Figure 5-18 Definition of number of cycles to trigger strain-softening (N) used in
this study ... 153 Figure 5-19 Stress-strain relationship of K0 consolidated samples under one-way
cyclic loading at σ’3=60kPa; CSR=0.12 for 1 min (OWKoU-28), 1 day
(OWKoU-29) and 1 week (OWKoU-30) of aging time ... 154 Figure 5-20 Stress path of K0 consolidated samples under one-way cyclic loading
at σ’3=60kPa; CSR=0.12 for 1 min (OWKoU-28), 1 day (OWKoU-29)
and 1 week (OWKoU-30) of aging time ... 154 Figure 5-21 Stress-strain of loose K0 consolidated samples at σ’3=60kPa under
one-way cyclic loading; CSR=0.18 for 1 min (OWKoU-31), 1 day (OWKoU-32) and 1 week (OWKoU-33) ... 155 Figure 5-22 Stress path of K0 consolidated samples under one-way cyclic loading
at σ’3=60kPa; CSR=0.18 for 1 min (OWKoU-28), 1 day (OWKoU-29)
and 1 week (OWKoU-30) of aging time ... 156 Figure 5-23 Aging effects on number of cycles to trigger strain-softening and
consequent liquefaction under one way cyclic test ... 157 Figure 6-1 Theoretical microstructure of silty sand (a) metastable structure
(Hanzawa, 1980); (b) sheared silty sand (Yamamuro & Lade, 1997)161 Figure 6-2 Variation of void ratio and fines content for material used in this
study... 162 Figure 6-3 Typical Force chain network in polydisperse (well graded) granular
material (Voivret et al., 2009)... 163 Figure 6-4 Mean free path ... 166 Figure 6-5 Surface map of element ... 169 Figure 6-6 Change in grains orientation for dense dry pluviated sample at σ’v
=113kPa i.e. 70601H_DD (left) and 70601W-DD (right) ... 171 Figure 6-7 Change in grains orientation for dense moist tamped sample at σ’v
=67kPa i.e. 70301H_MT (left) and 70301W-MT (right) ... 173 Figure 6-8 Typical void distance distribution based on 70301H in arithmetic (a)
and log (b) scale ... 174 Figure 6-9 Mean log void distance for dense dry pluviated samples (all) at σ’v
xiv
Figure 6-10 Mean log void distance for dense dry pluviated samples (all) at σ’v
=113kPa co i.e. 70601H_DD&70601W_DD: (a) horizontal (b) vertical ... 178 Figure 6-11 Mean log void distance for dense dry pluviated sample (sand) at σ’v
=113kPa co i.e. 70601H_DD&70601W_DD: (a) horizontal (b) vertical ... 178 Figure 6-12 Variance log void distance for dense dry pluviated sample (all) at
σ’v= 113kPa co i.e. 70601H_DD&70601W_DD: (a) horizontal (b)
vertical ... 179 Figure 6-13 Variance log void distance for dense dry pluviated sample (sand) at
σ’v= 113kPa co i.e. 70601H_DD&70601W_DD: (a) horizontal (b)
vertical ... 179 Figure 6-14 Kurtosis log void distance for dense dry pluviated sample (all
particles) at σ’v =113kPa co i.e. 70601H_DD&70601W_DD: (a)
horizontal (b) vertical ... 180 Figure 6-15 Kurtosis log void distance for dense dry pluviated sample (sand
particles) at σ’v =113kPa i.e. 70601H_DD&70601W_DD: (a) horizontal
(b) vertical ... 180 Figure 6-16 Variance/mean void distance (all particles) for dense dry pluviated
sample at σ’v =113kPa co i.e. 70601H&70601W: (a) horizontal (b)
vertical ... 181 Figure 6-17 Variance/mean void distance (sand particles) for dense dry pluviated
sample at σ’v =113kPa co i.e. 70601H&70601W: (a) horizontal (b)
vertical ... 181 Figure 6-18 Mean log void distance (all particles) for dense moist tamped sample
at σ’v= 67kPa i.e. 70301H and 70301W): (a) horizontal (b) vertical 182
Figure 6-19 Mean log void distance (sand particles) for dense moist tamped sample at σ’v= 67kPa i.e. 70301H and 70301W): (a) horizontal (b)
vertical ... 183 Figure 6-20 Variance log void distance (all particles) for dense moist tamped
sample at σ’v =67kPa i.e. 70301H_ and 70301W: (a) horizontal (b)
vertical ... 184 Figure 6-21 Variance log void distance (sand particles) for dense moist tamped
sample at σ’v =67kPa i.e. 70301H_ and 70301W: (a) horizontal (b)
vertical ... 184 Figure 6-22 Kurtosis log void distance (all particles) for dense moist tamped
sample at σ’v =67kPa i.e. 70301H_ and 70301W: (a) horizontal (b)
vertical ... 185 Figure 6-23 Kurtosis log void distance (sand particles) for dense moist tamped
sample at σ’v =67kPa i.e. 70301H_ and 70301W: (a) horizontal (b)
vertical ... 185 Figure 6-24 Variance/mean log void distance (all particles) for dense moist
tamped sample at σ’v =67kPa i.e. 70301H_ and 70301W (a) horizontal
xv
Figure 6-25 Variance/mean log void distance (sand particles) for dense moist tamped sample at σ’v =67kPa i.e. 70301H_ and 70301W (a) horizontal
(b) vertical ... 187 Figure 6-26 Change in grains orientation for loose moist tamped samples
(40301H, 40301W, 40304m and 40308m) at σ’v=57kPa ... 190
Figure 6-27 Change in orientation of loose moist tamped samples at σ’v=125kPa
i.e.40601H (left) and 40601W (right) ... 192 Figure 6-28 Change in orientation of loose dry pluviated samples at σ’v=125kPa
i.e. 40601H-DD (left) and 40601W-DD (right) ... 193 Figure 6-29 Mean log void distance (all particles) for loose moist tamped
samples (40301H, 40301W, 40304M and 40308M) at σ’v=57kPa .. 196
Figure 6-30 Mean log void distance (all particles) for loose moist tamped samples at σ’v=57kPa for each aging time (40301H, 40301W, 40304M
and 40308M) ... 196 Figure 6-31 Mean log void distance (sand particles) for loose moist tamped
samples at σ’v=57kPa for each aging time (40301H, 40301W, 40304M
and 40308M) ... 197 Figure 6-32 Variance log void distance (all particles) for loose moist tamped
samples at σ’v=57kPa i.e. 40301H, 40301W, 40304M and 40308M 198
Figure 6-33 Variance log void distance (sand particles) for loose moist tamped samples at σ’v=57kPa i.e. 40301H, 40301W, 40304M and 40308M 198
Figure 6-34 Kurtosis log void distance (all particles) for loose moist tamped samples at σ’v=57kPa i.e. 40301H, 40301W, 40304M and 40308M 199
Figure 6-35 Kurtosis log void distance (sand particles) for loose moist tamped samples at σ’v=57kPa i.e. 40301H, 40301W, 40304M and 40308M 200
Figure 6-36 Variance/mean log void distance (all particles) for loose moist tamped samples at σ’v=57kPa i.e. 40301H, 40301W, 40304M and
40308M ... 201 Figure 6-37 Variance/mean log void distance (sand particles) for loose moist
tamped samples at σ’v=57kPa i.e. 40301H, 40301W, 40304M and
40308M ... 201 Figure 6-38 Mean log void distance (all particles) for loose moist tamped
samples at σ’v=125 kPa i.e. 40601H & 40601W ... 202
Figure 6-39 Mean log void distance (sand particles) for loose moist tamped samples at σ’v=125 kPa i.e. 40601H & 40601W ... 202
Figure 6-40 Variance log void distance (all particles) for loose moist tamped samples at σ’v=125 kPa i.e. 40601H & 40601W ... 203
Figure 6-41 Variance log void distance (sand particles) for loose moist tamped samples at σ’v=125 kPa i.e. 40601H & 40601W ... 203
Figure 6-42 Kurtosis log void distance (all particles) for loose moist tamped samples at σ’v=125 kPa i.e. 40601H & 40601W ... 204
Figure 6-43 Kurtosis log void distance (sand particles) for loose moist tamped samples at σ’v=125 kPa i.e. 40601H & 40601W ... 204
xvi
Figure 6-45 Variance to mean ratio of log void distance (sand particles) for loose moist tamped samples at σ’v=125 kPa i.e. 40601H & 40601W ... 205
Figure 6-46 Mean log void distance for loose dry pluviated samples (all) at σ’v
=125kPa co i.e. 40601H_DD&40601W_DD: (a) horizontal (b) vertical ... 206 Figure 6-47 Mean log void distance for loose dry pluviated samples (sand) at σ’v
=125kPa co i.e. 40601H_DD&40601W_DD: (a) horizontal (b) vertical ... 207 Figure 6-48 Variance log void distance for loose dry pluviated samples (all) at
σ’v =125kPa co i.e. 40601H_DD&40601W_DD: (a) horizontal (b)
vertical ... 207 Figure 6-49 Variance log void distance for loose dry pluviated samples (sand) at
σ’v =125kPa co i.e. 40601H_DD&40601W_DD: (a) horizontal (b)
vertical ... 208 Figure 6-50 Index of dispersion log void distance for loose dry pluviated samples
(all) at σ’v =125kPa co i.e. 40601H_DD&40601W_DD: (a) horizontal
(b) vertical ... 208 Figure 6-51 Index of dispersion log void distance for loose dry pluviated samples
(sand) at σ’v =125kPa co i.e. 40601H_DD&40601W_DD: (a) horizontal
(b) vertical ... 209 Figure 6-52 Kurtosis log void distance for loose dry pluviated samples (all) at σ’v
=125kPa co i.e. 40601H_DD&40601W_DD: (a) horizontal (b) vertical ... 209 Figure 6-53 Kurtosis log void distance for loose dry pluviated samples (sand) at
σ’v =125kPa co i.e. 40601H_DD&40601W_DD: (a) horizontal (b)
vertical ... 210 Figure 6-54 Example of DEM snapshot during creep stage (a) dense (b) loose
(courtesy of Kang, D.H) ... 212 Figure 6-55 Void distance distribution from DEM at stage 0 (a) dense: D0 (b)
loose: A20 ... 213 Figure 6-56 Log void distance vs. void ratio i.e. combined data in each direction
from stage 0, 8 and 20 of (a) dense and stage 0 and 20 of (b) loose . 215 Figure 6-57 Log void distance vs. void ratio for each stage (a) dense (b) loose215 Figure 6-58 Variance log void distance vs. void ratio (a) dense (b) loose .... 217 Figure 6-59 Variance log void distance vs. void ratio (a) dense (b) loose .... 218 Figure 6-60 Variance/mean log void distance vs. void ratio (a) dense (b) loose
... 219 Figure 6-61 Variance/mean per stages log void distance vs. void ratio (a) dense
(b) loose ... 220 Figure 6-62 Combined kurtosis log void distance vs. void ratio (a) dense (b)
loose ... 221 Figure 6-63 Kurtosis log void distance vs. void ratio of each stage (a) dense (b)
xvii
Figure 6-67 Overall rose diagram for gp-A and gp-B ... 231 Figure 6-68 Void distance distribution of undisturbed samples i.e. (a) gp-A and
(b) gp-B ... 232 Figure 6-69 Mean log void distance versus void ratio, gp-A (a) and gp-B (b)233 Figure 6-70 Variance log void distance versus void ratio for gp-A, gp-B,
40601H_DD and 40601W_DD (a) horizontal gp-B (b) vertical ... 234 Figure 6-71 Variance to mean ratio log void distance versus void ratio ratio for
gp-A, gp-B, 40601H_DD and 40601W_DD (a) horizontal gp-B (b) vertical ... 234 Figure 6-72 Kurtosis to mean ratio log void distance versus void ratio for gp-A,
xviii
LIST OF TABLES
Table 2-1 Field sand aging studies and soil types (Modified from Baxter (1999)
and Saftner (2009)) ... 8
Table 2-2 Sand aging from laboratory studies and their soil types (Modified from Saftner, 2009) ... 9
Table 2-3 Examples of sand aging on cone penetration test from ground improvement cases (modified after Baxter, 1999) ... 11
Table 4-1 Summary of performed creep tests ... 74
Table 4-2 Typical stress conditions at the end of K0 consolidation i.e. when creep starts ... 78
Table 4-3 Creep comparison of dense and loose K0 consolidated samples .. 107
Table 5-1 Samples Tested in Monotonic Undrained Test ... 127
Table 5-2 Aging effects on undrained shear modulus (G0, G0.02% and G0.06%) of K0 consolidated samples ... 146
Table 5-3 Aging effects on undrained shear modulus (G0, G0.02% and G0.06%) of isotropically consolidated samples ... 146
Table 5-4 Qualitative comparison of stiffness increase between silty sand and clean sand ... 150
Table 5-5 Samples Tested in Cyclic Test ... 153
Table 6-1 Creep tests ... 160
Table 6-2 Fischer statistical analysis for orientation of dense dry pluviated samples (70601H-DD&70601W-DD) and moist tamped samples (70301H&70301W) ... 170
Table 6-3 Void distance analysis for dense dry pluviated (70601H_DD&70601W_DD) and moist tamped (70301H&70301W) samples at σ’v =113kPa ... 175
Table 6-4 Fischer statistical analysis for orientation of loose samples ... 188
Table 6-5 Void distance analysis for loose samples... 194
Table 6-6 Comparison of material properties and stress condition of Kang’s DEM (sample A for Loose and sample D for dense) and real fabric tests ... 211
Table 6-7 Changes in void distance from DEM ... 213
Table 6-8 Particle orientation measures for gp-A and gp-B ... 231
1
1
Introduction
1.1
Background
Time has known to affect the behavior of soils. Over geological time, soils
can turn into rock (e.g. sand into sandstone), and rock weather to form soils. It
has been observed that over a shorter period, e.g. weeks, months, and years, soils
properties and behavior can also change. Some laboratory studies (Howie et al.,
2002) have even shown that the time effect in the range of minutes could also be
significant.
Generally, time has been widely recognized to have a pronounced effect on
clay. Gradual and measurable changes in clay properties over time are usually
related to its low permeability allowing slow pore water dissipation, and to its
chemical nature. However, in the last fifty years it has been revealed that
generally sands, after some disturbance, exhibit time dependent behavior
regardless of their near-instantaneous pore water dissipation and chemically hard
inert properties. The majority of this evidence comes from the increase in
penetration resistance in hydraulically placed fills and freshly disturbed deposits
after ground improvement, such as via explosive blasting and dynamic deep
compaction (e.g. Ashford et al., 2004; Debats & Sims, 1997; Mitchell &
Solymar, 1984; Saftner, 2009), This phenomenon usually is referred as sand
aging. Another phenomenon related to sand aging is the increase in pile capacity
of driven piles over sands.(e.g. Astedt et al., 1992; Bullock et al., 2005; Ng et al.,
2010) .
An example of sand aging is illustrated in the Jacksonville Power Plant
project at Florida (Schmertmann, 1991; Schmertmann et al., 1986b). The power
plant was to be built in a low-lying, naturally filled-in, former estuary consisting
of very loose to dense silty sand about 10 meters in thickness. Ground
improvement by dynamic deep compaction (DDC) was performed to provide a
2
area. Quality control cone penetration tests (CPT) were performed before and
after the treatment. Typical CPT profiles taken before and after densification
indicate a significant increase i.e. about 35% in penetration resistance in 40 days
(Figure 1-1). The ordinates in the figure represent the ratio of qc at time t to that
immediately after deep dynamic compaction (Mitchell, 2008). The figure clearly
shows that time has considerable effects on mechanical properties of the soil.
Figure 1-1 Normalized increase in cone penetration resistance with time after deep dynamic compaction on 10 m sand with layer of silty sand
(After Schmertmann, 1991)
Following numerous field observations, there has been relatively many
laboratory studies on sand aging (e.g. Afifi & Woods, 1971; Al-Sanad & Ismael,
1996; Bowman & Soga, 2003; Wang & Tsui, 2009). The majority of these
laboratory studies were performed on clean sand. Regardless of the practical
significance as exemplified in the figure above, few reported laboratory studies
have attempted to understand aging and creep on silty sand i.e. their mechanism
and their effects on undrained behavior particularly at small strain range (less
than 0.1%). This is relevant due to the fact that natural sand deposits, hydraulic
fills and tailing sands usually contain various amounts of fines. Additionally,
strain ranges under working loads for most geotechnical structures such as
tunnels, foundations and retaining walls are in the small range from 0.005-0.5%
3
1.2
Aim and Objectives
The aim of this research is to provide a direct link between changes in the
macro-mechanical undrained behavior of silty sand and its microstructural
change with time. The main objective is to investigate the relationship between
creep and aging of silty sand in order to shed some light on the aging mechanism
particularly under low effective stresses. Based on the aim several objectives
were defined as follows:
• To observe creep following K0 and isotropic consolidation in specimens
with different density, aging time and fabric.
• To investigate effects of creep induced aging of silty sand under undrained
condition at small strain range. The tests mainly consist of monotonic
undrained tests and one way cyclic undrained tests following K0 or
isotropic consolidation.
• To examine the change in microstructure during aging of silty sand.
• To directly observe and quantify the microstructure of silty sand for
‘undisturbed’ samples and reconstituted ones.
1.3
Limitation
As many other factors (e.g. plasticity of fines, fines content, grain size
composition, angularity and shape) could affect silty sand behavior (Carraro &
Salgado, 2004) and not all those factors could be investigated during the study
period, this study focused only on aging of non-plastic silty sand with 15% fine
4
1.4
Thesis Organization
This thesis is organized as follows:
Chapter 2 reviews past and recent research on sand aging from field tests,
laboratory tests and numerical micro-mechanical modelling. This chapter also
explains small strain behavior of granular soils.
Chapter 3 describes material and some experimental aspects of this study
related to both triaxial and fabric tests. For the triaxial tests, this chapter explains
the development of small strain measurements to the existing apparatus, whilst
for the fabric study this chapter presents the adopted system procedure for direct
observation of silty sand microstructure.
Chapter 4 is the first chapter on the triaxial test series. It presents the
observation of strain development during aging with different variables such as
density, aging time, consolidation stress path and inherent fabric.
Chapter 5 is the second part that discusses the triaxial tests performed in
this study to investigate the effects of creep and aging on undrained behavior
particularly in the small strain range. The majority of stress paths are monotonic
undrained compression tests under K0 consolidation. The K0 consolidation was
chosen as representative of the in-situ condition for level ground in a free field.
The stress path was chosen to simulate effects of time on freshly deposited or
disturbed granular soils (e.g. hydraulic sand fill, mine tailings, and sandy soil
following an earthquake) at shallow depth. Test variables are similar to those
investigated in Chapter 4. A few tests were also performed using one-way cyclic
loading to consider effects of creep on cyclic behavior relevant for natural slopes,
embankments and quay wall backfills.
Chapter 6 focuses on the microstructure changes occurring during aging
under K0 condition. In this study the sample was loaded one dimensionally in the
5
microstructure was preserved by introducing very low viscous epoxy resin into
the specimen and then cutting, grinding, and polishing of the specimen for
observation under high resolution scanning electron microscope (SEM) via back
scattered electron detector. Apparent particle orientation and mean free path
between particles were used as parameters to quantify the microstructure
changes. In addition, observation of undisturbed granular soils recovered by
gel-push sampling is also described.
Chapter 7 presents the conclusions of this research. Recommendations for
future research also are given.
1.5
Terminology
In this study, the following terms or phrases are often used:
Sand aging: Apparent time dependent increase in stiffness and strength of
granular materials.
Creep: continuous deformation of soils under constant stress where particle
rearrangement and internal inter-particle stress changes and redistribution among
groups of particles occur (including asperities damage and particle breakage)
Aging mechanism: Mechanism(s) underlying the sand aging. Hypothesized
mechanism includes mechanical and chemical aging. Although some evidence
now favours mechanical mechanism (Mitchell, 2008), particularly in engineering
time (e.g. days, months and years), no conclusions have been set thus further
study is required to understand the mechanism.
6
Silty sand : according to the Unified Soil Classification System, USCS,
(ASTM D 2487), silty sand are either soils that contain at least 50% of particles
smaller than 4.75 mm and more than 12% either low plasticity or non-plastic
fines.
7
2
Aging and Creep of Granular Soil
2.1
Introduction
Sand aging can be considered over two time scales, geological and
engineering scales respectively. The former considers the aging effect over the
age of the deposit since its deposition, and could be in the range of hundreds to
thousands of years or more. The latter are the changes associated with time over
a shorter period after disturbance of the ground in the range of minutes and days
to years, which is the interest of this study.
The first section of this chapter will illustrate aging effects both from field
observations and laboratory studies. The following section of this chapter will
summarize previous studies of sand aging based on soil types, different theories
underlying the phenomenon and last section of this chapter will discuss
observation of creep from triaxial test and numerical modelling perspective.
2.2
Aging of Granular Materials
2.2.1 Sand aging previous studies based on soil types
There have been many reported field and laboratory studies related to sand
aging. Table 2-1and Table 2-2 present previous studies on sand aging and their
soil types from field and laboratory tests, respectively. It can be seen from Table
2-1 that most of the field studies of sand aging involve clean sand with few field
studies involving silty sand. Likewise Table 2-2 shows that sand aging studies
from laboratory testing were mainly performed on clean sand. Table 2-2 also
reveal that most laboratory tests particularly from triaxial tests are under drained
condition. Limited studies investigate aging effect on monotonic and one way
8
Table 2-1 Field sand aging studies and soil types (Modified from Baxter (1999) and Saftner (2009))
Reference Cu Cc D10 D50 Description/USCS Dr(%) Location
Denisov et al. (1963)
- - - - fine to medium clean sand
NA Volga river Hryciw (1986) 1.6 1.11 0.075 0.12 SP 40-50 Harriet's
Bluff Mitchell (1986) 2.94 0.94 0.31 1 SP 40-70 Jebba Dam Schmertmann
(1986a)
- - - 0.25 Very loose to dense silty sand.
20-60 St. John River Petraborg
(1987)
<6 - - - FC<11%, sub rounded beach sand
60 Bay farm Island Dumas &
Beaton (1988)
3.06 - - 0.79 medium to coarse clean sand
NA Pointe Noire Harbour Handford
(1988)
2.3 1.17 0.09 0.16 Tailing sand/SP 40-60 Fort Mac Murray Brown (1989) 0.3 - - - Alluvial sand 40-45 Gray
Beverages Roger et al.
(1990)
2.67 1.04 0.14 0.33 clean sea sand (FC<8%) / SP
60 Beaufort Sea Thomann
(1990)
2.42 1.04 0.11 0.2 SP Douglas Laeke (Charlie et al.,
1992a)
4.17-5.75
- - 2.1-2.3
medium to fine sand and gravelly sand
70-85 South Plate River Human (1992) - - - - fine silty sand NA Bay farm
Island Gohl et al.
(1994)
- - - - fill overlying loose sand
NA Kelowna AGRA (1995)
1.9-4.5
- - 0.3-1.5
Loose river sand 40 Sept. Iles, Quebec
Ng et al.
(1996)
4.5 - - 0.8 Hydraulic sand fill (fines<12%)
30-40 Chep Lap Kok Airport
Howie and Amini (2004)
1.88 - 0.16 0.271 - - Fraser River Ashford et al.
(2004))
- - - 0.25 Clean fine sand /SP
20-70 Treasure Island Holzer & Youd
(2007)
- - - 0.091 SM - Wildlife site Rollins a&
Anderson (2008)
2.35 1.51 0.085 0.19 SP - Massey Tunnel
Safner (2009) 1.78 - 0.18 0.32 Loose sand / SP 40 Griffin Narsilio et al.
(2009)
1.47 - - 0.21 Loose fine sand/ SP
38-44 South Carolina
Note: Cu=coefficient of uniformity; Cc=Coefficient of gradation; D10=diameter
[image:28.595.109.504.155.685.2]9
Table 2-2 Sand aging from laboratory studies and their soil types (Modified from Saftner, 2009)
Reference D10 D50 Cu Cc USCS Sand Note
Afifi and
Woods (1971) 1.6 1.2 0.27 0.41 SP
Ottawa Resonant columnt
Seed ((1979) - 0.41 1.4 - - Monterey Undrained cyclic two ways Daramola
(1980)
- - - - -
Ham River Drained direct shear Ishihara
(1985)
-
0.3 2.5 - - -
Undrained cyclic two ways Hryciw
(1986) 1.5 1.03 0.15 0.2 SP
Evanston Beach Mini cone penetration Mejia et
al.(1988) 1.5
- -
0.4 - Ottawa C-109
Oedometer Thomann and Hryciw (1992) 1.89 - 0.07 - - Ottawa 100-200 Resonant columnt Miller (1994) 2 - - 0.3 Holliston Direct simple shear Joshi et al.
(1995) 2.39 1.12 0.12 0.45 SP River Mini cone penetration Lade & Liu
(1998) -1 -1
- - SP
Antelope Valley Drained triaxial Baxter (2004) 1.93 1.04 - 0.5 SP Density Mini cone penetration Shozen (2001) 0.16 0.271 1.88 SP Fraser River Drained triaxial Bowman
(2002)
- -
0.12 0.15 SP Leighton
Buzzard Drained triaxial Bowman
(2002)
- -
0.18 0.24 SP Montepellier
Drained triaxial Lam (2003) 0.16 0.271 1.88 SP Fraser River Drained triaxial LeClerc(2008) 1.28 1.08 0.4 0.5 SP Ottawa Triaxial (Lade et al.,
2009) -1 -1 0.15 NA
SP Crushed coral
Drained triaxial Wang and
Tsui (2009)
- -
0.65 0.85 SP
Ottawa 20-30 Resonant column Wang and
Tsui (2009)
- -
0.16 0.22 SP Toyoura
Resonant column Wang and
Tsui (2009)
- - - Toyoura+15%dry
kaoline Resonant column Gao et al.
(2011) SP
Toyoura &Leighton Buzzard
Bender element Wang & Gao
(2014)
- -
0.12 0.15 - Leighton
10
2.2.2 Aging effects
2.2.2.1 Effects of aging on penetration resistance
There have been numerous examples of aging since Mitchell (1986)
documented the increase in cone penetration resistance after vibro-compaction
and explosive blasting during the development of Jebba Hydroelectric Dam
Project at Nigeria. Table 2-3 shows some examples of aging effect on the
penetration resistance from different studies. Mitchell (2008) compiled
penetration resistance data after ground improvement from a number of cases
and noted a marked difference in the rate of increase in cone tip resistance, qc,
with time (Figure 2-1). There have been also some cases where qc has decreased
shortly after blast induced densification and then increased with time (e.g.
Mitchell & Solymar, 1984) or never reached the pre-densification value (e.g.
Thomann, 1990).
2.2.2.2 Aging effects on axial pile capacity
There are many field studies indicating that load bearing capacity of piles
driven into sands may increase significantly over months, long after pore water
pressures have dissipated, a phenomenon referred to as pile setup. The
magnitude of increase in the axial capacity is variable, as can be seen Figure 2-2
with most of it due to increase in the shaft resistance rather than the tip resistance
(Jardine et al., 2006).
Bowman and Soga (2005) hypothesized that there is an increase in radial
stress (i.e. horizontal effective stress) around the pile shaft after installation.
After the process of driving the piles into sands, they proposed that displacement
pile setup or restrained dilation occurs with time. With the presence of a pile in
the ground, sand particles adjacent to the pile shaft tend to rearrange (i.e. creep)
relative to the pile shaft. This process causes redistribution of the loads imposed
on individual sand particles. In this process, dense sand around the pile initially
11
Table 2-3 Examples of sand aging on cone penetration test from ground improvement cases (modified after Baxter, 1999)
Reference D50
(mm)
Cu Dr
%
σ'v
(kPa)
Densification Measured
Time Period (days) Improvement with Time Soil description/ Note Schmertmann et al. (1986)
0.25 NA 40-70 0-100 Dynamic deep
Compaction
80 As much as 240% increase
in qc .
Very loose to dense silty sand.
Handford (1988) 0.16 2.3 40-60 50 Blasting 45 30-50% increase in qc Tailing sand
Troncoso (1990) 0.12 6 NA 50-100 Earthquake 1460 As much as 50% increase in
SPT value
silty sand
Charlie et al. (1992)
2.1-2.3 4.17-5.75 70-85 30-90 Blasting 126 About 15% increase in qc medium to fine sand and
gravelly sand;dense to very dense;
AGRA (1995) 0.3-1.5 1.9-4.5 40 0-200 Blasting 30 200-300% increase in qc
after 12 days; no further increase after 30 days
Loose river sand
Ng(1996); Covil et al.(1997)
0.8 4.5 30-40 100 Vibro-compaction 42 Average 35 % increase in qc Hydraulic sand fill
(fines<12%)
Ashford (2004) 0.25 NA 20-70 36 Blasting 294 qc between 2 and 5 m depth
tip had increased to twice the pre-blast value and 2.5 times the value two days after the second blast.
Clean fine sand to silty sand
Safner(2009) 0.32 1.78 40 46 Blasting 671 43% increase in qc Loose sand
Narsillo et.al (2009)
0.21 1.47 38-44 112 Blasting 1292 Limited increase in qc during
first year, clear increase 2 years after
Loose fine sand
12
Figure 2-1 Rate of cone penetration resistance as result of sand aging (Mitchell, 2008)
[image:32.595.144.477.417.667.2]13
2.2.2.3 Aging effects on small-strain properties
Afifi and Woods (1971), based on resonant column tests on Ottawa clean
sand, silt and clay, showed that the small strain shear modulus increased linearly
with the logarithm of time. This can be expressed by the following expression
) log( 1
) (
) (
max max
p G
p t
t N
t G
t G
+
= Eq. 2-1
Where tp is the time to the end of primary compression, t is any time greater than
tp, G max (t) is Gmax at time t, Gmax(tp) is Gmax at time tp. The reference time, tp,
was taken as 1000 minutes. NG is a coefficient that can be back calculated from
monitoring the increase in stiffness with time. NG values were found to be
between 1 and 12% with a typical value of 2%. Based on bender element tests on
Evanston beach sand, Baxter and Mitchell (2004) found NG values less than 4%
and showed that NG was influenced by sand type, pore-fluid and density, but did
not find any obvious effect from temperature.
Howie et al. (2002) and Lam (2003) studied the effect of aging periods of
up to 10,000 minutes on the stress-strain response of very loose clean Fraser
River sand (mean diameter, D50=0.27 mm and coefficient of uniformity, Cu=
1.9). The average mineral composition is 40% of quart, quartzite and chert, 11%
feldspar, 45% unstable rock fragment, 4% miscellaneous detritus (Garrison et al.,
1969). A period of aging resulted in a much stiffer (small strain stiffness Young
Modulus, E) response during the initial portion of the stress-strain curve (Figure
2-3) but the effect of aging tended to disappear at larger strains. The result
suggests that aging increases initial (small strains) stiffness but has little effect on
larger strain properties, including shear strength. It also revealed that contractive
14
Wang and Tsui (2008) investigated density effect on the aging behavior of
rounded Ottawa sands and sub angular Toyoura sands using resonant column
tests. The results on Ottawa sand demonstrated that medium-dense samples had
the highest aging rate, as determined by shear modulus increase, followed by the
dense and loose samples (Figure 2-4). The trend did not apply to Toyoura sand
which suggests that the effect of packing density on the aging behavior of sand
indeed varies with the characteristic/type of sand. Using bender elements in a
true triaxial apparatus, the authors also demonstrated that aging is not isotropic
by nature. The increase in shear wave velocities in different polarization planes
varied under an isotropic stress state.
Wang and Tsui (2009) investigated the effect of fines (dry kaolinite
powder) on aging behavior of the same materials. The period of aging was two
days. It was revealed that sand containing fines has a greater shear-modulus
increase than the clean sand does, which can be attributed to the more significant
creep and aging rate made by the kaolinite (Figure 2-5). The sample with 15%
kaolinite had a higher modulus increase than the sample with 3% kaolinite in the
early aging period, but the two modulus growth curves came close to each other
at the end of the test. This suggests that the contact properties vary from time to
time and so do the associated aging effects.
Figure 2-3 Aging effects on small stress-strain response (Howie et al., 2002)
D
ev
ia
to
r
st
re
ss
(
k
P
15
Figure 2-4 Variations in the small-strain shear-modulus increment and the axial strain in Ottawa sand samples with different relative densities (Wang
& Tsui, 2008)
Figure 2-5 Effect of fines on aging behavior (Wang & Tsui, 2009)
The aging effect on the stiffness anisotropy of Toyoura sand and Leighton
Buzzard sand were investigated by Gao et al. (2011) using bender elements in a
[image:35.595.131.485.414.651.2]16
micromechanical properties, e.g., the contact normals and normal contact forces;
continue with the same tendency that has already been established before the
initiation of aging.
Howie and Amini (2004) investigated the time effect on the shear wave
velocity thus small strain stiffness using seismic cone testing (SCPT). A seismic
cone was pushed to a depth in medium fine sand to silty sand and the shear wave
velocity was measured at different wait times after stoppage. The cone pushing
disturbed a zone around the cone and set the aging time to zero for this zone.
Aging stiffened up the disturbed zone with time which could be detected by
seismic tests, Figure 2-6. As can be seen in the figure the aging rate is higher in
the first 10 minutes (about 5% increases in Vs), and then becomes smaller (about
2.5% over 50 minutes). This is similar to the laboratory observations which show
that aging rate is decreasing with time. The faster arrival of shear waves was
attributed to the effects of aging of the soil in the disturbed zone around the cone.
The advantage of this test is that it clearly shows the time effect and it is not
affected by site variability since the tests at different times are carried out
without changing the location. Moreover, no disturbance was imposed to the
ground after the start of the aging process. Seismic tests impose very small shear
strains on the soil and hence their aging effect would be negligible. Therefore,
any change to the soil response with time could be directly attributed to the
17
Figure 2-6 Aging effect to shear wave velocity from seismic cone Penetration test (Howie & Amini, 2004)
2.2.2.4 Aging effects on static shear strength and compressibility
Al-Sanad and Ismael (1996) investigated the effects of aging on strength
(direct shear test) and compressibility of Khaldiya Gatch sand. The sand is a
fine-to-medium, calcareous silty sand and can be classified as SM (low plasticity
silty sand) according to the Unified Soil Classification System. The sand has a
natural moisture content of 1.9%, a specific gravity of 2.67, and the amount of
fines passing a No. 200 sieve is 17.5%. It is well graded, with a coefficient of
uniformity (Cu) of 6, mean diameter (D50) of 0.33 mm, minimum dry density
1449 kg/m3, maximum dry density from modified Proctor (at optimum water
content 10.3%) of 2068 kg/m3. Chemical analyses indicate that quartz is the
principal component of the particles. However, calcium carbonate, calcium
magnesium carbonate (dolomite), and gypsum represent nearly 20% of the total
composition.
Direct shear test results indicated that the friction angle of the specimens
increased with time (Figure 2-7left) as they aged under vertical stress. The increase
in strength is about 10% over 6 months. In their research, specimens were built at a
18
months. The increase in strength over time appears to be in contradiction with
Howie’s et al. (2002) and Lam’s (2003) observation, who suggested that aging has
little effects on large strain properties such as strength. This may be due to the
present of calcium carbonate, dolomite and gypsum which may act as cementing
agents. Cementation is likely when carbonate is present (Mitchell, 2008). It is likely
that the aging mechanism (see 2.2.3) in Al Sanad and Ismael’s study is a
combination of mechanical and chemical (see 2.2.3). Whereas aging mechanism in
Howie’s et al. and Lam’s studies is mainly mechanical due to lack of cementing
agents.
Consolidation tests were carried out on compacted sand at zero time
(immediately after preparation) and at 3 months. Samples tested after 3 months were
kept under a constant normal pressure of 40 kPa during the aging period. All
specimens, 75 mm in diameter and 20 mm thick, were prepared at a relative density
of 60% and saturated with water for 2 hours before the tests. The compressibility
coefficient Cc decreased slightly from 0.23 to 0.20 for the aged samples over the
3-month period (Figure 2-7 right).
Figure 2-7 Aging effect on angle of friction and compressibility (Al-Sanad & Ismael, 1996)
2.2.2.5 Aging effects on cyclic strength and liquefaction
resistance
Seed (1979) conducted cyclic triaxial tests on Monterey sand of about 50%
19
for sands aged for 10 and 100 days, respectively. He also compared the
resistance to liquefaction of some undisturbed and reconstituted samples which
are plotted in the same figure. He concluded that the liquefaction resistance of
natural deposits might be as high as 75% greater than that of freshly reconstituted
samples in the lab.
Troncoso et al. (1988) investigated the effect of aging of tailing materials,
by conducting a series of cyclic triaxial tests on undisturbed silty sands. The
samples were recovered from two tailing dams at El Cobre in Chile. The sands
are well graded with mean diameter of 0.12 mm and average fine content about
25%. Figure 2-8 shows that the sand with an age of one, 5, and 30.5 years of
deposition possesses about 2.0 times, 2.4 times and times 3.5 times higher
resistance to cyclic stress application, respectively, as compared to the freshly
reconstituted sample using water pluviation.
Figure 2-8 Aging effect on cyclic strength of silty sand (Troncoso et al. 1990)
2.2.2.6 Aging effects on horizontal stress
An experiment using a rigid retaining wall was conducted Terzaghi (1934)
to measure the lateral earth pressure of dry Plum Island sand. After the sand was
20
hours as shown in Figure 2-9 (from point d to point e), although the position of
[image:40.595.166.436.166.499.2]the wall did not change.
Figure 2-9 Aging effects to lateral stress in retaining wall (Terzaghi, 1934)
Continuous rearrangement of individual particles after deposition was
believed by Terzaghi (1934) as the cause of the time-dependent increase in σ′h in
sand. The rearrangement, under constant pressure, results in the movement of the
individual sand grains into more stable positions. This is turn reduces the
frictional (shear) stress at contacts of sand grains.
Jirathanathaworn (2009) designed a system using photo-elasticity to
measure changes in horizontal stress during aging of glass rods, representing a
2-dimensional (2-D) soil assembly. As depicted in Figure 2-10, during sustained
load, the horizontal stress increases with time. Time-dependent surface
21
stress, particle shape, and particle surface roughness. Time-dependent surface
settlement and particle re-arrangement occur more rapidly at higher vertical
stresses. Assemblies of cylindrical particles showed more surface settlement than
those of angular prism particles under the same applied stress. Surface settlement
for assemblies of smooth cylinders was higher than those for assemblies of rough
cylinders.
Horizontal stress increases during aging also observed following explosive
blasting at the Griffin’s sand and gravel quarry, Indiana USA (Saftner, 2011a).
The soil layers consisted of a loose sand layer (poorly graded sand, SP, with
coefficient of uniformity, Cu of 1.78 ; mean grain size diameter, D50 of 0.32 mm)
and gravelly sand layer (classified as poorly graded sand with gravel, SP with
>15% of gravel; Cu=2.42; D50=0.8 mm). Horizontal stress was measured using
flat dilatometer through horizontal stress index, KD. Typical results from the flat
dilatometer test are shown by Figure 2-11. There was an initial decrease in KD
following the blast and an increase between one week and one month.
Measurements taken after one month do not show time-dependent behavior. In
the loose sand layer, KD was greater than pre-blast values, but other layers to not
22
23
[image:43.595.114.503.155.668.2]