Journal of the American Chemical Society is published by the American Chemical Society. 1155 Sixteenth Street N.W., Washington, DC 20036
Selective Double Electron-Electron Resonance Spectroscopy
Alice M. Bowen, Eachan O.D. Johnson, Francesco Mercuri, Nicola J. Hoskins,
Ruihong Qiao, James S.O. McCullagh, Janet E. Lovett, Stephen G. Bell,
Weihong Zhou, Christiane R. Timmel, Luet Lok Wong, and Jeffrey R. Harmer
J. Am. Chem. Soc., Just Accepted Manuscript • DOI: 10.1021/jacs.7b11056 • Publication Date (Web): 21 Dec 2017
Downloaded from http://pubs.acs.org on January 8, 2018
Just Accepted
A Structural Model of a P450-Ferredoxin Complex from Orientation-Selective Double
Electron-Electron Resonance Spectroscopy
Alice M. Bowen,1 Eachan O.D. Johnson,2,† Francesco Mercuri,3 Nicola J. Hoskins,2 Ruihong Qiao,4 James S.O. McCullagh,5 Janet E. Lovett,1,^ Stephen G. Bell,2,♯ Weihong Zhou,4,* Christiane R. Timmel,1,* Luet Lok Wong,2,* and Jeffrey R. Harmer1,§,*
1
Centre for Applied Electron Spin Resonance, Department of Chemistry, University of Oxford, Inorganic Chemistry Laboratory, South Parks Road, Oxford OX1 3QR, UK.
2
Department of Chemistry, University of Oxford, Inorganic Chemistry Laboratory, South Parks Road, Oxford OX1 3QR, UK.
3
Consiglio Nazionale delle Ricerche (CNR), Istituto per lo Studio dei Materiali Nanostrutturati (ISMN) Via P. Gobetti 101, 40129, Bologna, Italy.
4
College of Life Sciences and The State Key Laboratory of Medicinal Chemical Biology, Nankai University, Tianjin 300071, China.
5
Department of Chemistry, University of Oxford, Chemistry Research Laboratory, Mansfield Road, Oxford OX1 3TA, UK.
†
Current address: Broad Institute of MIT and Harvard, 415 Main St, Cambridge, MA 02142, USA. ♯
Current address: Department of Chemistry, University of Adelaide, Adelaide, SA 5005, Australia. §
Current address: Centre for Advanced Imaging, University of Queensland, St Lucia, QLD 4072, Australia.
^
Current address: SUPA, School of Physics & Astronomy, University of St Andrews, North Haugh, St Andrews, KY16 9SS, UK.
Professor W. Zhou, E-mail: zhouwh@nankai.edu.cn
Professor C. R. Timmel, E-mail: christiane.timmel@chem.ox.ac.uk Professor L. L. Wong, E-mail: luet.wong@chem.ox.ac.uk
Professor J. R. Harmer, E-mail: jeffrey.harmer@cai.uq.edu.au
Abstract: Cytochrome P450 (CYP) monooxygenases catalyze the oxidation of chemically inert carbon-hydrogen bonds in diverse endogenous and exogenous organic compounds by atmospheric oxygen. This C–H bond oxy-functionalization activity has huge potential in biotechnological applications. Class I CYPs receive the two electrons required for oxygen activation from NAD(P)H via a ferredoxin reductase and ferredoxin. The interaction of Class I CYPs with their cognate ferredoxin is specific. In order to reconstitute the activity of diverse CYPs, structural characterization of CYP-ferredoxin complexes is necessary, but little structural information is available. Here we report a structural model of such a complex (CYP199A2-HaPux) in frozen solution derived from distance and orientation restraints gathered by the EPR technique of orientation-selective double electron-electron resonance (os-DEER). The long-lived oscillations in the os-DEER spectra were well modeled by a single orientation of the CYP199A2-HaPux complex. The structure is different from the two known Class I CYP-Fdx structures: CYP11A1-Adx and CYP101A1-Pdx. At the protein interface HaPux residues in the [Fe2S2] cluster-binding loop and the α3 helix, and the C-terminus residue interact with CYP199A2 residues in the proximal loop and the C helix. These residue contacts are consistent with biochemical data on CYP199A2-ferredoxin binding and electron transfer. Electron tunneling calculations indicate an efficient electron transfer pathway from the [Fe2S2] cluster to the heme. This new structural model of a CYP-Fdx complex provides the basis for tailoring CYP enzymes for which the cognate ferredoxin is not known, to accept electrons from HaPux and display monooxygenase activity.
INTRODUCTION
Initially identified as a red, CO-sensitive pigment in porcine liver microsomes,1 the superfamily of cytochrome P450 (CYP) monooxygenases are found throughout the domains of life from eukaryotes through nematodes to bacteria and even viruses.2-4 Their most common activity is catalysis of the insertion of an oxygen atom from dioxygen into a carbon-hydrogen bond of organic molecules with concomitant formation of water and oxidation of NAD(P)H, although related reactions have been observed in some isoforms, such as demethylation and epoxidation and even more complex reactivity such as C–C bond cleavage and skeletal rearrangements.5
Class I CYPs, found in bacteria and mitochondria, are terminal oxidases of a three-enzyme redox chain, typically
comprising a FAD- or FMN-dependent ferredoxin reductase (FdR) that oxidizes NAD(P)H, and an iron-sulfur (typically [Fe2S2]) dependent ferredoxin (Fdx) that then shuttles single reducing equivalents from the FdR to the CYP.6 Often the rate of electron transfer from the Fdx to the CYP is controlled by specific protein recognition requirements.
Members of this class facilitate vital processes in eukaryotes, such as CYP11A1 that is responsible for cholesterol side-chain cleavage7 and CYP24A1 that ensures calcium homeostasis through vitamin D3 hydroxylation.8 Bacterial Class I CYPs are particularly diverse and oxidize a broad range of organic compounds, fulfilling roles in biosynthesis but especially in the metabolism and catabolism of xenobiotics. Often this enables the organism to grow on, and degrade, chemically inert substances. Some wild-type
organisms have found applications in drug synthesis.9 The solubility and ease of high level heterologous production of bacterial CYPs in Escherichia coli make them attractive for developing new biotechnological applications in, for example, the synthesis of fine chemicals,10-19 intermediates,14,20-22 drugs,23-28 and antibiotics.29-31 However, many of the Class I CYP enzymes are not genetically associated with their Fdx. Monooxygenase activity reconstitution for these enzymes relies on coincidental binding and electron transfer by an Fdx from other CYP systems. With sub-optimal CYP-Fdx complementarity, a larger excess of the Fdx is often required and the turnover frequency can be low, leading to a significant bottleneck to research and process development.32
A canon of high-resolution data on CYP-Fdx complexes is therefore highly desirable to remove this obstruction through enzyme engineering to improve protein binding and accelerate electron transfer. Nevertheless, there has been little successful characterization of any such complexes, with the X-ray crystal structure and NMR-derived solution structure of the CYP101A1-putidaredoxin (CYP101A1-Pdx) complex of the camphor-oxidizing system from Pseudomonas putida and the X-ray crystal structure of the mitochondrial CYP11A1-adrenodoxin (CYP11A1-Adx) complex being the only representatives.7,33,34 No other structures are available, demonstrating the generally transient nature of redox enzyme complexes and their crystallographic intractability.35 Although not a class I CYP system, there is also crystallographic data of a heme–FMN domain complex of CYP102A1 – the first CYP electron transfer complex to be crystalized.32
The CYP101A1-Pdx system is the best characterized but also unique among Class I CYPs because of the effector role of Pdx whereby only Pdx induces specific CYP101A1 conformational changes such that only Pdx can transfer the second electron to effect O–O bond cleavage and CYP101A1 monooxygenase activity.36 Such a stringent effector role has not been found for other Class I systems. The CYP101A1-Pdx crystal structure has CYP101A1 in an open form,33,34 which was shown also to be the case in solution by DEER.37 Recently DEER data on a CYP101A1-Pdx complex confirmed that Pdx binds to the open form of CYP101A1 in frozen solution in the same way as found for the crystal structure.38 It was proposed that the effector role is a result of contact of the Pdx C-terminus residue Trp106 with the CYP101A1 proximal face. This leads to conformational changes in the CYP101A1 C helix that are transmitted to other parts of the structure, including the I helix.33, 39 Whether the open form of CYP101A1 persists in the catalytically competent electron transfer complex remains to be confirmed.
CYP199A2 from Rhodopseudomonas palustris CGA009,40 for which the X-ray crystal structure has been solved,41,42 catalyzes the oxidation of para-substituted benzoic acids. HaPux is a [Fe2S2] ferredoxin belonging to the R. palustris HaA2 strain that supports electron transfer to CYP199A2 with virtually the same binding and activity as the physiological ferredoxin palustrisredoxin (Pux). Furthermore, HaPux is more readily produced at high levels
in Escherichia coli than Pux,43 making it easier to study in the laboratory.
To overcome the difficulty in obtaining crystals of P450 complexes for x-ray structure determination, we report here the use of the pulse EPR technique of double electron-electron resonance (DEER) spectroscopy.44-46 DEER measurements in combination with site-directed mutagenesis and spin labeling is a methodology growing in importance in structural biology.47,48 Techniques to orientate two rigid-body objects using a series of DEER measurements between spin label pairs has been well-established either with only DEER data,49,50 or in conjunction with other data such as from NMR.51,52 Methods are available to calculate rotamer distributions of a given spin label attached to a protein.53-55 In addition to measurement of a distance distribution between nitroxide-based spin labels, methods to extract orientation information between the spins44-46 in the case of rigid spin labels,46,56,45 metal centers,57 and metal clusters,58-60 are well-established.
Here we use DEER to obtain distance and orientation restraints between a series of extrinsic nitroxide spin labels on the surface of CYP199A2 and the reduced [Fe2S2]
+• center of HaPux. This combination of spin probes provides several advantages as compared to the standard approach using two spin labels with a flexible linker such as MTSSL (1-oxyl-
2,2,5,5-tetramethyl-∆3-pyrroline-3-methyl)-methanethiosulfonate spin label). The [Fe2S2] +•
spin improves the accuracy of the distance information since the HaPux coordinates are accurately known and there is a single [Fe2S2] conformation, and the anisotropic [Fe2S2]
+•
EPR spectrum enables angular restraints to be obtained that assist in structure determination. In addition, site-direct mutagenesis and spin labeling of HaPux proved problematic as introduction of a surface cysteine lowered protein expression levels and the labeling reaction caused loss of the [Fe2S2] cluster. However, we were able to prepare and label one stable surface cysteine mutant, D54C, which was required to uniquely define the complex orientation.
Rigid-body docking and molecular dynamics simulations ranked by fitting of DEER spectra led to a unique solution and a model for the structure of the CYP199A2-HaPux complex that is consistent with biochemical and mutagenesis data for CYP199A2-ferredoxin binding and electron transfer.
MATERIALS AND METHODS
General
Microbiology, molecular biology, and general enzymology experiments were carried out by standard and published methods and are summarized in the Supplementary Material (Sections S1–S6). Site-directed mutagenesis was carried out using the QuikChange kit (Stratagene). Nitroxide spin labels were introduced using (1-oxyl-2,2,5,5-tetramethyl-∆3-pyrroline-3-methyl)-methanethiosulfonate (MTSSL) (Toronto Research Chemicals).
Crystal structure of HaPux
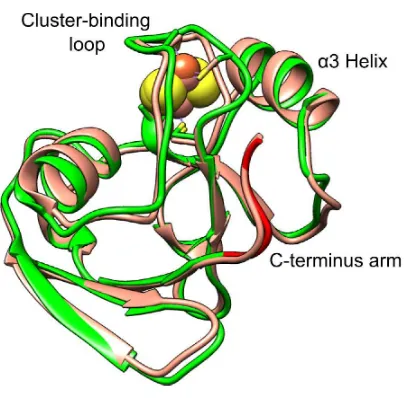
Crystals of HaPux belonged to the space group P212121. The structure was solved at 2.30 Å resolution by molecular replacement using the structure of putidaredoxin (Pdx) as a search model (PDB code: 1R7S).61 The crystallization conditions and data collection and structure refinement statistics are given in Section S7 of the ESI. All 106 residues of HaPux were traced and the structure was virtually identical to that of Pdx, including the conformation of the C-terminal arm (Fig. 1). The coordinates have been deposited in the PDB (PDB code: 4LTU).
Spin-labeling of wild-type CYP199A2
The crystal structure of wild-type CYP199A2 indicated a single solvent-accessible cysteine residue, Cys226. Electrospray mass spectrometry showed that CYP199A2 attached MTSSL in a 1:1 ratio, as shown by an increase in apparent mass by 184 Da, corresponding to the mass of MTSSL with its methanesulfonyl group displaced by a cysteine thiolate (Fig. S1 of ESI). When the C226S mutant was subjected to the same reaction conditions, the mass spectrum showed no change in mass, demonstrating that this mutation was sufficient to block spin-labeling of CYP199A2.
Preparation of DEER samples
Cysteine substitutions for nitroxide spin label attachment were introduced to the C226S mutant of CYP199A2 on the distal side of the heme at the solvent-accessible residues Thr42, Thr315, Thr345 and Ser404. These sites are approximately evenly distributed over the surface of CYP199A2 as shown in Fig. S2. Residues Thr42, Cys226, Thr351 and Ser404 are located within helices or β strands while Thr345 is within a loop. The double-mutation variants C226S/T42C, C226S/T315C, C226S/T345C and C226S/S404C showed 85%–97% of the NADH consumption activity and gave the same demethylation product from 4-methoxybenzoic acid as the wild type enzyme (data not shown). In order to allow each of these residues to form a spin pair with the reduced [Fe2S2]+• cluster of HaPux for DEER measurements the mutated sites must be labeled with MTSSL and the [Fe2S2] cluster prepared in a reduced form. A catalytic amount (0.01 eq.) of HaPuR, the cognate ferredoxin reductase of HaPux,43 was added to a 1:1 mixture of 0.2– 0.4 mM each of HaPux and spin-labeled CYP199A2 in the presence of 1 mM 4-methoxybenzoic acid. The solution was saturated with CO before adding 1.5 equivalents of NADH to generate a complex between the EPR-silent FeII(CO) form of CYP199A2 and the paramagnetic reduced [Fe2S2]
+•
form of HaPux. Glycerol-d8 was added to 30% v/v and the samples frozen at –196 °C. These samples provided the orientation-selective DEER NO•−to−[Fe2S2]
+•
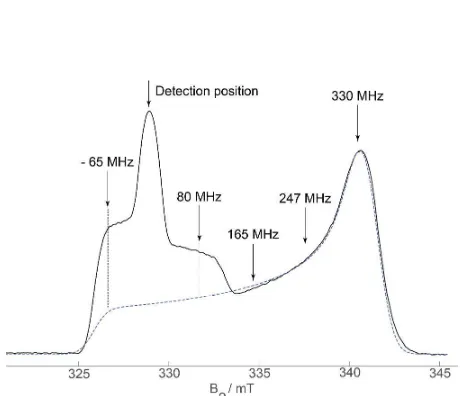
structural constraints. Figure 2 shows a typical echo-detected EPR spectrum from these samples which contains the MTSSL and [Fe2S2]+• signal.
Due to the axial symmetry of the [Fe2S2] +•
cluster g-matrix the orientation information from DEER in the g⊥ plane
(the azimuthal angle) is undefined. Therefore, to help orientate the complex from the DEER measurements a complex of the FeII(CO) form of the spin-labeled CYP199A2 with the oxidized form of the spin-labeled D54C mutant of HaPux (Section S5 of the ESI) was prepared to provide an
NO•–NO• distance. The EPR spectrum from this sample exhibits only an MTSSL signal (data not shown).
EPR spectroscopy
Four-pulse DEER measurements were made on an X-band Bruker E680 spectrometer using a Bruker 3-mm split ring EPR resonator (ER 4118X_MS3) equipped with an Oxford instruments CF935 cryostat and an ITC 503 variable temperature unit. The detection microwave sequence
π/2−τ1−π−τ1−τ2−π−τ2−echo at frequency νdet was positioned at the maximum of the nitroxide (NO•) signal and employed pulse lengths of tπ/tπ/2 = 32/32 or 40/40 ns and was phase-cycled according to [+x, +x, +x, +; –x, +x, +x, −]. For each sample with a NO•−[Fe2S2]
+•
spin pair, five time-traces were recorded with the π pump pulse positioned across the [Fe2S2]
+•
EPR spectrum (Fig. 2) by varying the pump frequency νpump from ∆ν = (νdet –νpump) = –65, 80, 165, 247 and 330 MHz. Depending on the maximum achievable excitation B1 field, tπ = 16–20 ns. The measurement
temperature was 20 K. For the NO•–NO• sample the pump pulse (tπ = 16 ns) was positioned at the maximum of the NO
•
signal, −65 MHz from νdet, and measurements were made at 50 K. All DEER experiments used a variable τ1 time to minimize distortions due to nuclear modulations caused by overlap of the excitation bandwidths of the pump and detection pulses.62 This τ1 averaging was not sufficient to completely remove nuclear modulations (see later, Fig. 3).
Rigid-body docking to create trial protein complexes A comprehensive set of trial protein complexes were generated using the programs PatchDock and FireDock63-67 and each trial complex was ranked according to the goodness-of-fit of data simulated for this complex compared to experimental DEER data (see equation 3). PatchDock is a rigid-body docking program that uses object recognition and image segmentation techniques to create docked complexes; surfaces for both docking partners are generated and then classified into concave, convex or flat patches according to their shape. The patches on the two partner proteins are matched together like a jigsaw puzzle (concave patches with convex and flat patches with either concave, convex or other flat patches). PatchDock ranks the docked conformers according to geometric shape complementarity and removes any results where the penetration of atoms from one of the binding partners into the other is unacceptable. FireDock, part of the same suite of programs, was used to refine the PatchDock output by allowing the side chains on the protein interface to be flexible. Two refinement levels were used; a Full Interface Side Chain Optimization (FISCO) where all side chains on the interface are made flexible and the overall protein positions optimized to reduce clashes, or a Reduced Interface Side Chain Optimization (RISCO) where only the side chains deemed to clash are allowed flexibility.
A test of the software was undertaken by docking P450cam to Pdx and comparing these structures with the complex determined by X-ray crystallography (PDB code: 5GXG).68 PatchDock produced a P450cam-Pdx complex that is essentially identical to the one from crystallography, with a root-mean-squared-deviation (RMSD) of 1.53 Å between all
the atoms. Further details are provided in Fig. S3 of the Supporting Information.
PDB files 4DNJ (CYP199A2) and 4LTU (HaPux) were used as input for the PatchDock calculations. These were prepared for docking by removing water molecules and adding missing protons using the addH feature in UCSF Chimera.69,70 Biochemical information was included in the PatchDock calculation by defining interfacial residues after the interaction surface was identified by optimized fits to the DEER spectra (vide infra).
For HaPux, residues in the cluster-binding loop and the
α3 helix, as well as the C-terminus residue were in the interfacial region. The involvement of these regions in CYP-Fdx binding is in agreement with previous mutagenesis studies;71,72 in HaPux the residues correspond to: Val36, Glu38, Asn42, Ala43, Val44, Asn66, Asp69, Asp72, and Gln105. PatchDock calculations specifying interfacial residues only for HaPux yielded 7152 possible docked CYP199A2-HaPux complexes.
In the case of CYP199A2, Arg111, Met360 and Gln364 were selected on the basis of their location on the proximal surface and close proximity to the heme. Arg285 was also included since it was on the proximal surface but further removed from the heme – it could function as an initial recognition/docking site. Patchdock calculations specifying interfacial residues only for CYP199A2 yielded 2076 possible docked CYP199A2-HaPux complexes.
Both sets of calculations were then refined further using FireDock FISC and RISC optimizations, yielding a total of 27,684 trial complexes for subsequent ranking according to the quality of the DEER simulations they produce.
In order to study the effect of restricting the parameter space further, three groups of docking calculations using different specified interfacial residues for both CYP199A2 and HaPux simultaneously were performed. These were used to assess the robustness of the modeling with respect to the uncertainty in the residues specified. The three groups of residues used in turn were: (Arg111, Arg285, Met360, Gln364), (Arg285, Met360, Gln364) and (Arg285). In all three calculations, the full list of residues for HaPux was used. PatchDock computations with the three groups of interfacial resides specified yielded 602 trial CYP199A2-HaPux complexes after duplicates were removed. Refinement by FireDock FISCO and RISCO yielded a set of 1806 trial complexes after duplicates were removed. Combining all calculations yielded a total 28,295 structures after duplicates were removed.
Note that PatchDock and FireDock are not parameterized to take into account the presence of the heme or iron-sulfur cluster prosthetic groups or the 4-methoxybenzoic acid substrate. However, these groups and molecule are not surface accessible, therefore their exclusion will not affect the outcome of the PatchDock docking calculations. Our methodology employs PatchDock and FireDock solely as tools to generate a large set of trial protein complexes and this trial set is ranked independently using the DEER data. In FireDock computations the cofactors were taken into consideration by fixing the position of the side chains that ligate these moieties in order to preserve the space they occupy. In the case of HaPux these residues were:
Cys39, Cys45, Cys48 and Cys86. For CYP199A2 these residues were: Arg94, Ser97, His107, Arg111, Ser247, Arg303, His359 and Cys361. In principle PatchDock and FireDock could be used to rank the complexes with respect to various types of intermolecular interactions but, in addition to other short comings, the absence of the cofactors is likely to make this ranking inaccurate and, as stated above, we searched for the best solution according to the DEER data.
Calculation of rotamer distributions
Rotamer distributions for the MTSSL spin labels introduced to CYP199A2 and HaPux were computed using a rotamer library approach as implemented in MMM,73,74 and an accessible volume approach as implemented in mtsslWizard.53 Briefly, MMM calculates the probability for each of the pre-calculated rotamers in a library according to a Boltzmann weighting at 298 K or 175 K (glass forming temperature of the frozen solution) with rotamer energies computed using Lennard-Jones potentials. MtsslWizard calculations used the settings, tight with thorough search, which outputs 200 rotamers per residue site. A total of 14 rotamer libraries (see later, Table 2) were used for structure modelling to allow an estimate of the error stemming from uncertainties in the rotamer distributions. Calculations of the rotamer libraries used as input the 4DNJ (CYP199A2) and 4LTU (HaPux) PDB files.
DEER simulations with [Fe2S2] +•
–NO• spins
Our algorithm to simulate orientation-selection DEER traces has been described in detail,75 and is briefly summarized below. The magnetic parameters of the [Fe2S2]
+•
cluster are listed in Table 1 and are based on our CW EPR, ENDOR and HYSCORE study on palustrisredoxin-B (PuxB) from R. palustris CGA00915 (PuxB and HaPuX have essentially identical EPR spectra and structure, see Fig. 1) . In a DEER experiment the electron-electron dipolar frequency between the [Fe2S2] cluster spin and nitroxide spin for a particular angle θ of the spin-spin vector relative to the magnetic field vector B0 is given by,58,59
dd=
NO• Fe2S2∑
cos
! . Eq. 1
Here NO• and Fe2S2 are the sample g-values along the spectrometer magnetic field B0, ki a spin projection factor, θi
the angle between the B0 vector and a vector between the NO• spin (taken as the midpoint between the NO bond) and the i-th coordinate of the [Fe2S2] cluster, and ri is the corresponding
spin-spin distance. We summed over 8 [Fe2S2] cluster coordinates corresponding to the two iron centers and two sulfur atoms in the [Fe2S2] cluster and the sulfurs from the four ligating cysteine residues.
A simulated DEER time trace includes only orientations excited by the pump and detection pulses and is given by "#$%& = '1 − ∆1 − +#$%&,-& Eq. 2 where ∆ is the modulation depth and B(t) the intermolecular or background function which for a homogenous distribution of randomly orientated spins is given by B(t) = exp(−ct). Both
∆ and c are treated as fit parameters whose values are optimized by minimizing the sum-of-the-squares of the
residues, Vsim(t) −Vexp(t), where fsim(t) and Vexp(t) are the simulated and experimental DEER traces, respectively. As a large number of trial CYP199A2-HaPux complexes are considered, a library of simulated DEER traces76,77 was generated for each experimental pump/detection pulse position that spans all possible orientations and distances between an NO spin and the [Fe
2S2] cluster. For this, a grid with 3366 points evenly distributed over a full sphere was used, and the radius (NO• to [Fe2S2] distance) was varied from r = 14 to 70 Å with ∆r = 1 Å, giving a library with 3366×57 = 191862 traces. A full sphere of orientations is required due to the low symmetry of the [Fe2S2] spin projection factors (Table 1).
Table 1: DEER simulation-frame coordinates and spin projection factors ki for the reduced [Fe2S2]
+•
cluster of HaPux (g⊥ = 1.934, g|| = 2.025) where g|| is along the z
-axis in this coordinate system. S* are bridging sulfide atoms, and Scys are from the coordinated cysteine residues.
Atom Coordinates ki
Fe3+ 0,0,0 1.5554
Soxcys −1.3677,0.4579,−1.9555
−1.6729,−0.6980,1.6465
0.0894
S* 1.3851,−1.6040,−0.7058 1.2979, 1.6148, 0.8541
0.0834
Fe2+ 2.6869, 0.0000, 0.1505 −0.841 Sredcys 3.9069, −0.8986, 2.0111
4.2024, 0.7678, −1.4739
−0.03
Ranking CYP199A2-HaPux complexes using a goodness-of-fit parameter from the DEER simulations
The goodness-of-fit of simulated to experimental DEER traces was quantified by the objective function Rtot which is the sum-of-the-squares of the residuals, R, and the derivative of the residuals dR/dt, from the six spin-labeled CYP199A2-HaPux samples. The derivative term is not critical to the results but is included in the objective function as it puts extra weight on accurately modelling the important DEER oscillation frequencies and thus aids the algorithm in its convergence to the minimum (a similar approach can be used in fitting CW EPR spectra). Parameters (x, y, z,α, β, γ) define the position (x, y, z) and orientation (Euler angles α, β, γ) of CYP199A2 relative to HaPux.
./0/1, 3, 4, 5, 6, 7 = . + 1/4;./;& Eq. 3a
where
. = .<+ .=+.>+.<>+.<?<+.=>< Eq. 3b
.mutant= ∑GQ E∑OHF∆+G,Hexp− ∆+G,HsimL⁄MP⁄R Eq. 3c
The contributions R and dR/dt from each mutant in equation 3a are normalized by the number of points N in each DEER trace, and the number of DEER traces M as indicated in equation 3c. For each sample with orientation-selective DEER data M = 5, and M = 1 for the NO•−NO• DEER trace.
Rtot uses the reduced form factor ∆f(t) to compute residual Rmutant and dRmutant/dt as it contains the information on the dipolar coupling between the two spins of the CYP199A2-HaPux complex. This quantity has the background B(t) and un-modulated (1−∆) contributions to Vexp(t) removed.
Optimized DEER fits to model CYP199A2-HaPux complexes In this approach, the relative position of the five MTSSL rotamer distributions for CYP199A2 and one for HaPux were computed using MMM or mtsslWizard and stored. The position and orientation of CYP199A2 and its five spin labels are defined relative to the fixed HaPux position (Table 1) by the variables (x, y, z,α, β, γ).
Optimized fits of the simulated DEER traces to the experimental traces used a pattern-search algorithm to minimize Rtot from some initial starting position/orientation in an iterative way. At each iteration, a grid or mesh of Rtot values is computed around the current position, defined by variables (x±dx, y±dy, z±dz, α±dα, β±dβ, γ±dγ). The current position is then either moved to the mesh position of the most successful poll (current minimum Rtot value) and the mesh size expanded for the next iteration, or, if the poll is unsuccessful the mesh size is decreased and the current position retained. This iterative procedure is repeated until Rtot converges to its minimum value. Parameters for the mesh and the pattern-search algorithm are described further in section S8 of the ESI.
Protein complex relaxation using molecular dynamics. To optimize the molecular structure of the top DEER-ranked complexes from PatchDock and FireDock we undertook a short energy minimization using the molecular dynamics (MD) program Gromacs.78 For these computations the X-ray structures of CYP199A2 (4DNJ) and HaPux (4LTU) were orientated according to the corresponding output rotation angles (α, β, γ) and Cartesian coordinates (x, y, z) from PatchDock and FireDock. The following relaxation protocol was applied to all structures considered. The docked complex was initially relaxed in vacuum to the closest energy minimum by application of the steepest descent method until a maximum force of 10 kJ mol–1nm–1 on atoms was reached. Then, the structure was inserted into a cubic box (10 nm × 10 nm × 10 nm) and solvated by SPC/E water molecules. Sodium ions (Na+) were added to the system to ensure charge neutrality. The system was subsequently relaxed to the closest energy minimum by steepest descent, applying position restraints on the center of mass of protein residues. A short (20 ps) MD simulation run in the NVT ensemble at 300 K, followed by a longer (0.5 ns) MD run in the NPT ensemble, with position restraints on the protein residues, was performed to relieve close contacts with solvent molecules. Finally, the system was fully optimized by steepest descent, without any restraint. The standard GROMOS96 53a6 force field,79 which includes the heme parameters and is augmented by bonded and non-bonded parameters for the description of the [Fe2S2] cluster,80 was used in all simulations. The Berendsen coupling scheme81 was used to equilibrate the system in the thermodynamic ensemble for NVT and NPT simulations, with coupling
constants set to 0.1 ps and 1.0 ps for the thermostat and the barostat, respectively. Electrostatic interactions were described through the Particle Mesh Ewald (PME) scheme and a cutoff of 9 Å and 10 Å was used for short-range Coulomb and van der Waals interactions, respectively. Equations of motion were integrated according to the leapfrog scheme with a time-step of 1 fs.
RESULTS AND DISCUSSION
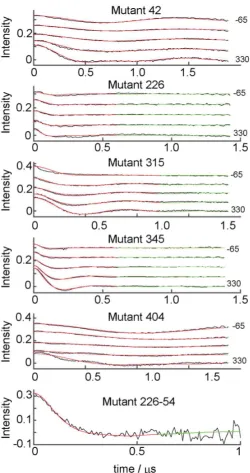
Rigid-Body CYP199A2-HaPux complexesDEER spectra of high quality were obtained for all six mutant complexes as shown in Fig. 3 (Fig. S4 shows the raw data). Significant changes in the oscillation frequencies of the DEER traces as the pump pulse position is moved across the [Fe2S2]+• EPR spectrum were observed for each mutant indicating the expected orientation selection. The relatively long-lived oscillations (more than a period is observed) in the traces suggest a well-defined complex as opposed to a distribution of protein complexes in frozen solution which would typically dampen the DEER oscillations to a monotonic decay.
Firstly, the CYP199A2-HaPux orientation which best fits the DEER data was determined using the pattern-search algorithm outlined in the Materials and Methods section. In this optimization no information from the protein surfaces was used, and hence the two protein molecules could overlap or be far apart. The algorithm optimizes the position of CYP199A2 with its five spin label rotamer distributions by adjusting the parameters (x, y, z,α, β, γ) to minimize the sum-of-the-squares of the residuals Rtot (Eq. 3). In all calculations in this study HaPux is defined by the fixed [Fe2S2]cluster coordinates given in Table 1. Results from this procedure are denoted as ‘DEER-fit’ complexes. A large number (>100) of initial guesses for the CYP199A2 position and orientation defined by variables (x0, y0, z0, α0, β0, γ0) were generated to ensure that the pattern-search algorithm converges to the global minimum rather than local minima.
To estimate the structural error in the determination of the DEER-fit complex, calculations using a comprehensive set of rotamer libraries were undertaken as listed in Table 2. DEER-fit complexes are computed to determine how accurately the DEER data alone defines a CYP199A2- HaPux complex and to provide information on the residues that are involved in the binding interface that can subsequently be used to reduce the conformation space that PatchDock and FireDock calculations need to explore.
The best fit (lowest Rtot = 0.035) was obtained with ‘mtsslWizard’ and this fit is plotted in Fig. 3 (Fig. S5 compares the best DEER-fit and DEER-docked simulations, see later). Given the entire DEER data set is very well modelled by a single orientation we interpret this result as indicating that a single population of CYP199A2-HaPux complexes dominate in frozen solution. However, the resolution is not sufficient to exclude the existence of small populations of additional conformers with alternate CYP199A2-HaPux orientations.68 The worst DEER-fit was obtained with ‘175K-UFF-216-CASD’ with Rtot = 0.051 and inspection of these fits reveals that this rotamer library describes the data reasonably well but is unable to accurately model the position of the first oscillation for all the DEER
traces (Fig. S6). This is also the case for the related libraries, entries 4, 5, 6 in Table 2. Nevertheless, the set of complexes defined by the 14 different rotamer libraries all have the same basic orientation as shown in Fig. 4A&B. This demonstrates that structure determination is not critically sensitive to inadequacies in computation of the rotamer distributions and that there are sufficient DEER constraints to provide a stable solution. The binding interface of the DEER-fit complex is entirely consistent with those residues identified by mutagenesis studies for both CYP199A2 and HaPux.
The standard deviation (STD) of the Cα atoms for the set of 14 DEER-fit complexes is 2.3 Å. The largest root-mean-squared-deviation (RMSD) between the members of the set and the average structure is 6.4 Å and not surprisingly belongs to the rotamer library with the largest Rtot value, ‘175K-UFF-216-CASD’. The average redox center distance (shortest heme Fe to [Fe2S2] cluster distance) of 16.3 ± 1.8 Å (range 14.0-20.4 Å) is entirely consistent with expectations for an electron transfer complex.
Table 2: Fit (Rtot) and structural (RMSD / Å) parameters for the ‘DEER-fit’ and ‘DEER-fit-docked’ complexes for the set of rotamer libraries. RMSD1 is between a DEER-fit and the average DEER-DEER-fit complex(a), and RMSD2 is between a DEER-fit and the corresponding DEER-fit-docked complex.
Rotamer Library DEER-fit DEER-fit-docked
Rtot RMSD1 Rtot RMSD2
1. 175K–090619 0.038 3.4 0.042 1.9
2. 298K–090619 0.038 2.9 0.049 2.1
3. MtsslWizard 0.034 2.1 0.065 2.8
4. 175K–UFF–216–CASD 0.051 5.4 0.091 4.1
5. 298K–UFF–216–CASD 0.047 6.4 0.075 3.8
6. 298K–UFF–216–r1–CASD 0.047 6.4 0.075 3.8
7. 175K–sezer12 0.039 3.1 0.046 2.0
8. 298K–sezer12 0.039 2.0 0.052 1.5
9. 175K–sezer13 0.043 2.6 0.050 2.4
10. 298K–sezer13 0.042 2.2 0.057 2.3
11. 175K–UFF–210–H–Hubbell 0.042 6.3 0.058 3.6
12. 175K–UFF–210–SH–Hubbell 0.037 3.1 0.068 3.7
13. 175K–flat 0.035 4.1 0.041 2.5
14. 298K–flat 0.036 3.4 0.041 2.5
a the average DEER-fit orientation is determined by the
least-squares fit of the distances between the Cα atoms of CYP199A2 and
the corresponding average Cα atom positions computed from the set
of DEER-fit complexes
Next each DEER-fit complex was matched to the closest PatchDock/FireDock complex to define a DEER-fit-docked complex for each rotamer library. This was achieved by computing the RMSD between a DEER-fit complex and each of the total 28,295 PatchDock and FireDock trial complexes, with the best match having the lowest RMSD. The 14 DEER-fit-docked complexes all exhibit a small RMSD difference with their corresponding DEER-fit complex which ranges from 1.9 Å to 4.1 Å (Table 2, RMSD2 and Fig. S7). This indicates that the DEER data alone is accurate enough to define complexes which are close to docked at an atomic resolution. The STD of the Cα atoms for the set of DEER-fit-docked complexes is 2.5 Å, and the largest RMSD between the members of this set and the average DEER-fit complex is 7.0 Å. The redox center
distance of 15.3±0.5 is equivalent within error to the DEER-fit result (16.3±1.8 Å).
The protein-protein interface (resides) defined by the average DEER-fit complex and largest RMSD defines a conservative estimate of the error in terms of the protein complex structure variability which is used further below to constrain the search space in the PatchDock and FireDock ranking procedure.
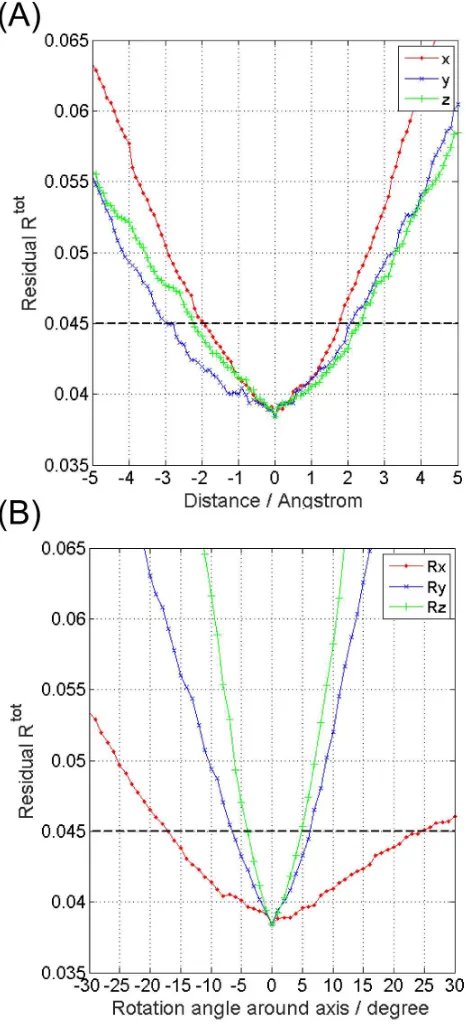
Note that the Rtot values for the DEER-fit-docked complexes range from 0.041 to 0.091 (Table 2), which indicates that this procedure locates a range of structures that can be further refined using in addition the Rtot values. Therefore a cut-off value for the residuals Rtot was computed using the gradients of Rtot with respect to the parameters (x, y, z, α, β, γ) at the global minimum82 for a DEER-fit complex. Fig. 5 shows a representative result for the example of data computed using the rotamer library 175K-090619.
These data indicate that a well-defined and sharp global minimum exists in this 6-dimensional parameter space. The standard deviations in the model parameters are:
σx≅σy≅σz ~ 0.5 Å, σα ~ 8°, σβ ~ 3°, σγ ~ 2°(see Fig. S8 for
computation details).82 This error analysis defines an acceptable fitting accuracy of Rtotcut-off ~ 0.045 by considering the Rtot values at 2σ from the minimum. Consistent with this computation a visual examination of the fits with an Rtot ~ 0.045 reveals that the data is satisfactorily modelled even though the solution has deteriorated as compared to the optimum (Fig. S9).
We thus searched the set of 27,684 PatchDock and FireDock complexes (formed without specifying interfacial residue constraints on either the HaPux or the CYP199A2 in turn) to find those structures that have a RMSD < 7.0 Å (=RMSDcut-off) from the average DEER-fit complex (defined in Table 2) and produce a simulation with Rtot < 0.045 (=Rtotcut-off). All 14 rotamer libraries were included in this computation. The best ranked DEER-docked complex with the lowest residual (Rtot = 0.040, RMSD = 1.9 Å < RMSDcut-off) was found using the library 175K-flat. The DEER simulations are shown in Fig. S5 and again demonstrates that an excellent fit to all 26 DEER traces is achieved with a single docked protein complex. Using the above criterion, only six ‘DEER-docked’ complexes from within the complete cannon of trial complexes are identified as producing simulations that acceptably match the experimental traces, and these structures are analyzed in detail in the next section. Fig. 4C&D show the structure of the six best DEER-docked complexes; it is clear that these can be interconverted by slight movement of HaPux on the CYP199A2 surface (cif files are provided in the Supplementary Material).
As already described, the DEER-fit complexes from the set of rotamer libraries all produced complexes with a similar orientation (Fig. 4A&B), but Table 2 shows Rtot values that are above Rtotcut-off = 0.045, see libraries 4, 5, and 6. Given this it is not surprising that these rotamer libraries performed poorly when trying to rank DEER-docked complexes. For example, rotamer library 4 have all 28,295 PatchDock and FireDock complexes with Rtot values larger than 0.051 and hence larger than Rtotcut-off, and the best ranked complexes in terms of Rtot have a large structural variability including cases
where RMSD > 7.0 Å from the average DEER fit complex. However, the libraries which fit the data best using docked complexes from PatchDock and FireDock (entries 1, 13, 14 in Table 2) produce a small set of DEER-docked and a DEER-fit complexes all with Rtot < 0.045 that have very similar structures well within RMSDcut-off. Ultimately the resolution of the methodology is limited by computation of the MTSSL rotamer distributions,52,83-86 the orientation information obtained from the axial g-matrix of the [Fe2S2]
+•
cluster, the number and quality of the DEER traces (constraints), and the restriction of the modeling to rigid bodies.
Statistics for the set of six best ranked DEER-docked complexes with Rtot <Rtotcut-off are listed in Table 3. The uncertainties in the mean distances between the five NO•−[Fe2S2]
+•
spin pairs and one NO•−NO• spin pair are small (rSTD<1Å) which demonstrates that the DEER distances are accurately defined.
Table 3: Structural parameters for the set of fourteen DEER-fit and six DEER-docked complexes. Cα,STD is the overall standard deviation of the Cα atoms of CYP199A2, rmean is the mean distance and rSTD the corresponding standard deviation for the [Fe2S2] cluster to spin label residue Cα distances, Cα− Cα distances between the spin
label residue C226 and D54C, and the heme Fe to [Fe2S2] cluster Fe1 distances.
Mutant DEER-fit
Cα,STD = 2.3 Å
DEER-Docked Cα,STD = 0.6 Å rmean rSTD rmean rSTD
T42C 40.6 1.4 41.2 0.8
C226 24.6 1.0 23.0 0.4
T315C 34.3 0.5 35.2 0.4
T345C 25.2 0.8 26.8 0.8
S404C 44.9 1.6 44.2 0.8
C226-D54C (HaPux) 31.4 0.4 31.0 0.3
heme Fe-[Fe2S2] Fe1 16.3 1.8 15.3 0.5
The same ranking procedure was then repeated using the 1806 complexes computed by PatchDock/FireDock with interfacial residue constraints specified for both proteins. A comparison of the best ranked complexes from the restricted and unrestricted docking protocols show that they are all very similar (again acceptable fits have Rtot <Rtotcut-off and RMSD < RMSDcut-off). The RMSD of the Cα atoms between the top ranked complex (lowest Rtot value) with and without interfacial residue constraints is 1.1 Å. The convergence of the two sets of PatchDock/FireDock computations demonstrates that the DEER simulation ranking converged to a common CYP199A2-HaPux orientation.
The analysis including the DEER-fit and DEER-docked structures demonstrate that (1) the DEER ranking procedure defines a unique interfacial surface on each protein which is consistent with mutagenesis data, and (2) the methodology provides a unique solution without the need to use additional constraints from the mutagenesis data. Of the interfacial residue constraints included in the computations all are involved in the interfacial surface.
[image:8.612.314.550.377.489.2]It is noteworthy that the orientation constraints from the DEER data are required to define the relative orientation of the CYP199A2-HaPux complex to an acceptable accuracy. If just the measured NO•−[Fe2S2] distances are considered (by summing up DEER traces from each sample and computing its distance distribution), then the range of possible structures matching the DEER data increases dramatically even considering only the PatchDock and FireDock structures.
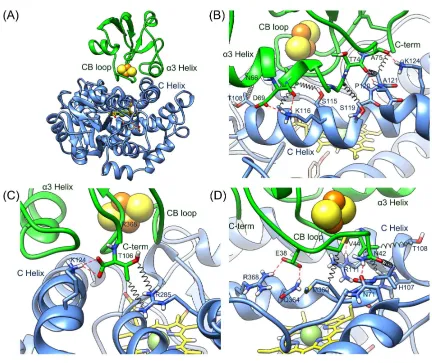
Protein recognition in the CYP199A2-HaPux complex For surface side-chain contact analysis the top six best-ranked DEER-docked complexes were geometry-optimized using the MD program Gromacs, firstly in vacuum and then in water (see Methods and Materials and Fig. S10). As shown in Table S2 the orientations and residue contacts between the two proteins in the structures optimized in vacuum are similar to one another. The heme iron and Fe1 are 15.4–16.0 Å apart while the Fe1 atoms in the different structures are within 1 Å. Optimization in water led to minor side chain conformation changes at the interfacial region that generally resulted in improved residue contacts (Fig. 6; Table S2 & S3).
The structure of the best-ranked DEER-docked model (lowest Rtot) is shown in Fig. 6A, the interaction region in Fig. 6(B)–6(D), and the residue interactions across the interface are summarized in Table 4. We highlight two caveats in analyzing the inter-protein interactions in the model of the CYP199A2-HaPux complex. Firstly, the crystal structures of the individual proteins were used in the docking to generate the structural model of the complex while the short MD simulations do not allow time for significant conformational changes to the backbone. This approach can therefore accommodate small side-chain reorganizations but not larger conformation changes such as those observed for the CYP101A1-Pdx complex.33 Secondly, the DEER experiments were performed on the FeII(CO) form of the CYP while the ferredoxin was in its reduced state. It is possible that the physiologically relevant complex of the oxidized CYP with reduced Fdx might have different local structure on the CYP proximal surface. Nevertheless, the gross features and the residue side-chains involved in protein binding should be largely similar, if not the same, for the different forms.
CYP199A2 and HaPux are held together by three sets of interactions, which can be grouped into residues within the [Fe2S2] cluster-binding loop (CB loop) and the α3 helix, and the C-terminus residue of HaPux. There are 3 salt bridges, 6 direct hydrogen bonds and numerous hydrophobic contacts.
Residues in the HaPux CB loop (Glu38–Cys45) interact with the proximal loop residues Gly357–Arg368 located just above the heme on the proximal face of CYP199A2. This is the contact region where the two redox centers are closest to each other. The Glu38 side chain forms a salt bridge with Arg368 and a H-bond with Gln364, Asn42 forms a H-bond with Asn71 while Val44 has extensive van der Waals contacts with Arg111 of the CYP199A2 C-helix. Residues in the α3 helix of HaPux contact the C helix on the periphery of the CYP199A2 proximal face. There is a salt bridge between Asp69 (α3 helix) and Lys116 (C helix). Gly73 and Thr74, immediately after the α3 helix, are buttressed against Ser119, Pro120 and Ala121 in the kink dividing the C and D helices
of CYP199A2 (Fig. 6B). The carboxylate group of the HaPux C-terminus residue Thr106 forms a salt bridge with Lys124 (D helix) but its side chain is exposed to the solvent. This complementary arc of inter-protein contacts, in particular at the CYP199A2 C/D helix kink, limits the translational movement of HaPux, but would not preclude rocking and rotation.
Table 4: Interfacial interactions of the top ranked CYP199A2-HaPux complex after MD optimization of side-chain positions in water.
HaPux residue
Locale CYP199A2
residue
Type
Glu38 CB loop Met360 Hydrophobic Gln364 H-bond Arg368 Salt bridge Cys39 CB loop Met360 Hydrophobic Asn42 CB loop Asn71 H-bond
Gly357 Hydrophobic Val358 Hydrophobic Val44 CB loop His107 Hydrophobic Thr108 Hydrophobic Arg111 H-bond Arg111 Hydrophobic Val358 Hydrophobic Cys45 CB loop Arg111 Hydrophobic Asn66 α3 helix Thr108 Hydrophobic Asp69 α3 helix Lys116 Salt bridge
H-bond Leu70 α3 helix Ala112 Hydrophobic
Ser115 Hydrophobic Gly73 α3 helix Ser119 Hydrophobic Pro120 Hydrophobic Thr74 α3 helix Pro120 Hydrophobic
Ala121 H-bond Ala75 α3 helix Lys124 H-bond Thr106 C-terminus Pro120 Hydrophobic
Lys124 Salt bridge Arg285 Hydrophobic
It is gratifying that the unbiased ensemble of DEER-fit complexes derived by fitting the DEER data were in full agreement with the location and orientation of the best ranked DEER simulations for the biased set of PatchDock/FireDock complexes. Moreover, of the four CYP199A2 residues selected for PatchDock analysis only Met360, Glus364 and Arg368 that are directly above the proximal residue Cys361 were critical for binding in the final best-ranked structure. Arg285, the other specified residue, plays only a minor role in the final model while the importance of Lys116 and Lys124 emerged from the protein docking analysis and best fits to the DEER traces.
[image:9.612.314.549.210.529.2]Structural rationalization of the effect of mutations at interfacial residues
The residue interactions identified in the model of the CYP199A2-HaPux complex are fully consistent with mutagenesis data on CYP199A2-Fdx binding.71,72 We have previously shown that PuxB, a [Fe2S2] ferredoxin in R. palustris CGA009 not genetically associated with a CYP enzyme, supported CYP199A2 turnover of 4-methoxybenzoic acid with low activity.71 This is primarily due to the high KM of 34.3 µM for the PuxB-to-CYP199A2 electron transfer step compared to 0.45 µM for the cognate ferredoxin Pux71 and 0.53 µM for HaPux.43 The lower kcat for PuxB of 19.1 s–1, compared to 37.9 s–1 for Pux and 48.4 s–1 for HaPux, also indicate lower donor-acceptor overlap for PuxB. Comparison of the crystal structures of PuxB and Pdx, as well as sequence alignment with Pux, allowed PuxB to be engineered to strengthen its binding to CYP199A2. We now expand the original analysis and consider structural comparison to HaPux. The effects of the mutations are explicable when the PuxB structure is superimposed onto HaPux in the model of the CYP199A2-HaPux complex (Fig. S11).
Of the interfacial residues, the HaPux C-terminus Thr106 aligns with Val in Pux and Ala in PuxB. Within the α3 helix Asp69 in HaPux is conserved in Pux and PuxB, while Asn66 and Leu70 in HaPux (Asp65 and Leu69 in Pux) align with Met66 and Met70 in PuxB. The M66D/A105V double mutant of PuxB mimicked Pux but its KM and kcat for CYP199A2 reduction were the same as for the wild type.71,72 This is consistent with the surface-exposed nature of these two residues and the minor contributions their side chains make to protein binding in our model structure.
As shown in Fig. S11 the side chain of Phe73 in PuxB (Gly in Pux and HaPux) clashes with CYP199A2 residues in this binding orientation. Unexpectedly, the F73G mutation did not alter KM or kcat for CYP199A2 reduction, indicating that differences in the third contact region – the [Fe2S2] cluster-binding loop – also play a crucial role. Within this loop, Glu38 and the cluster-ligating Cys39 and Cys45 are conserved across HaPux, Pux and PuxB but the Ala42/Cys43/Ala44 triad in PuxB differs significantly from the Asn42/Ala43/Val44 sequence in Pux and HaPux. However, changing this triad in the M66D/A105V PuxB double mutant to the HaPux and Pux sequence only slightly decreased KM to 28.3 µM for the quintuple mutant M66D/A105V/A42N/C43A/A44V.71 Most significantly though was the increase in kcat from 19.1 s–1 for WT PuxB to 37.2 s–1 for this quintuple mutant which closely matched that for Pux (37.9 s–1). Hence the H-bond between Asn42 in HaPux and Asn72 of CYP199A2, and the multiple van der Waals contacts between Val44 and Arg111 revealed in the model of the complex are crucial for attaining a binding orientation with high donor-acceptor overlap. Other complementary residue contacts are required for tighter protein binding. This proved to be the case as the KM was lowered dramatically to 3.8 µM when Phe73 in this quintuple mutant was changed to Gly.72
The DEER-derived model of the CYP199A2-HaPux complex is fully consistent with the mutagenesis results.
The model confirmed that the nature of C-terminus residue of the Fdx is not important but the C-terminus arm has to be the right length for the carboxylate group to form a salt bridge with Lys124 of CYP199A2. Within the [Fe2S2] cluster-binding loop the critical residues are Asn42 and Val44 while in the α3 helix Asn66 plays a minor role but Asp69 forms a key salt bridge with Lys116 of CYP199A2. The other surface residues of the C helix of CYP199A2, which interact with α3 helix residues, have small side chains. At the end of the α3 helix we find Gly73 and Ala74 which contact Ser119 and Pro120 at the C/D helix junction. Any substitutions with bulky side chains within these two helices and at these critical residues will introduce steric clashes that weaken binding. The mutagenesis results also revealed that good complementarity for both the cluster loop and the α3 helix regions are required to stabilize complex formation and promote electron transfer. We surmise that the minimal combination of PuxB substitutions A42N/A44V/F73G may lead to reasonable KM and kcat of CYP199A2 reduction and substrate turnover. The corollary of Fdx mutagenesis to bind and transfer electrons to CYP199A2 is proximal surface engineering of a CYP enzyme to bind and accept electrons from HaPux. The structure of the CYP enzyme can be overlaid with CYP199A2 in the model, from which residue differences are identified for mutagenesis to promote HaPux binding. In lieu of a crystal structure, sequence alignment may also provide candidate residues for mutagenesis.
Pux is the physiological electron transfer partner for CYP199A2 in R. palustris CGA009.40 Although HaPux from the R. palustris HaA2 strain supported CYP199A2 turnover with virtually identical Km and kcat values,70,71 it is possible that the two ferredoxins adopted different binding orientations. HaPux and Pux have 74% sequence identity, and the CYP199A2-HaPux interfacial contact residues are conserved. Residues Glu38–Cys45 in the cluster-binding loop are fully conserved, as are Asp69–Ala75. The Pux C-terminus residue is Val105 compared to Thr106 in HaPux. As noted above the HaPux C-terminus carboxylate interacts with Lys124 in CYP199A2 but the side chain is exposed to solvent. We conclude that Pux would almost certainly adopt the same binding orientation to CYP199A2 as HaPux.
Electron transfer pathway in the CYP199A2-HaPux complex Using the program PATHWAYS,87,88 the most efficient electron transfer path from the HaPux Fe1 to the heme iron of CYP199A2 was calculated (Fig. 7) for the complex. The highest scoring pathway of 1,000 calculated by this method (Table 5) was 20 Å long and involves a 4.2 Å through-space tunneling step between the Cys39 Cβ of HaPux and Met360 Cβ of CYP199A2 but is otherwise via covalent bonds. Overall, this reasonable pathway gives a donor-acceptor coupling, |HAB|, of the iron centers of 1.9 × 10⁻⁶ eV and, together with the mutagenesis data, offers compelling evidence that the binding orientation and inter-protein interactions in the model for the CYP199A2-HaPux complex derived from orientation-selective DEER traces is relevant under turnover conditions.
Table 5: Shortest-path/lowest-energy electron-transfer pathway as calculated by PATHWAYS. Each row except the first represents the acceptor atom for the donor atom above it. Atom names are given as in the PDB file for that enzyme. TS = through space; CB = covalent bond.
Step Enzyme Residue Atom Type ret/Å rtot/Å
0 HaPux [Fe2S2] Fe1 – – – 1 HaPux Cys39 Sγ CB 2.40 2.40 2 HaPux Cys39 Cβ CB 1.83 4.23 3 199A2 Met360 Cβ TS 4.15 8.38 4 199A2 Met360 Cα CB 1.53 9.92 5 199A2 Met360 C CB 1.54 11.46 6 199A2 Cys361 N CB 1.33 12.79 7 199A2 Cys361 Cα CB 1.48 14.27 8 199A2 Cys361 Cβ CB 1.53 15.80 9 199A2 Cys361 Sγ CB 1.83 17.63 10 199A2 Heme Fe CB 2.40 20.03
Binding orientation and interactions in other CYP-Fdx complexes
Previous work had elucidated the structure of two CYP-Fdx complexes, CYP11A1-Adx (PDB code: 3NA0)7 from mitochondria and CYP101A1-Pdx (PDB code: 4JWU)33 from P. putida. Relative to our CYP199A2-HaPux complex the CYP101A1 complex has Pdx rotated by ca. 90 degrees about the Fe-heme−[Fe2S2] cluster axis, and the CYP11A1 complex has Adx rotated by ca. 150 degrees (Fig. 8). It is instructive to examine how the DEER trace simulations would be affected for a hypothetical CYP199A2-HaPux complex with an orientation like that found for CYP11A1-Adx and CYP101A1-Pdx. These hypothetical orientations were examined by aligning CYP199A2 and HaPux to the respective complexes. Three aligned complexes were considered in each case, one generated using the ALIGN function in PyMOL and two by the best backbone match from the full set of PatchDock/FireDock complexes to the CYP11A1-Adx and CYP101A1-Pdx complex. All six models had their side-chains geometry optimized using Gromacs. DEER simulations of all of these aligned orientations for CYP199A2-HaPux showed poor agreement with the experimental DEER spectra, with Rtot > 0.1 (Fig. S12 & S13), significantly above the cut-off value, Rtotcut-off = 0.045.
Despite the different binding orientations there are aspects of the interactions that are common across the three complexes. Two of the three main HaPux structural motifs (the α3 helix, the cluster-binding loop and the C-terminus arm) involved in CYP199A2 binding also play crucial roles in the other two complexes. Adx binds to CYP11A1 through residues in its F-helix (aligns with the α3 helix in HaPux). There are few direct interactions between the Adx CB loop and CYP11A1, and the C-terminus residue is not involved in binding. Pdx interacts with CYP101A1 through the residues in the CB loop and the C-terminus but the α3 helix is not involved. The indole side chain of the C-terminus Trp106 residue of Pdx, which is critical for electron transfer in this system,89 interacts with CYP101A1 C-helix residues.
When HaPux and CYP199A2 are structurally aligned to their corresponding proteins in the P450cam-Pdx complex and the structure relaxed using energy minimization to relieve side chain clashes, Gly73 of HaPux is exposed to the solvent and not in the interfacial region (Fig. S14). Glu38 is hydrogen-bonded to Arg111. Hence the P450cam–Pdx binding orientation would result in weaker binding due to fewer interfacial contacts and is not consistent with the effect of the F73G mutation on PuxB. The alignment with the CYP11A1-Adx complex showed that the charged Glu38 side chain of HaPux (Ala45 in Adx) is oriented into a hydrophobic patch on CYP199A2 (Fig. S15). Asn42 is exposed to the solvent and the C-terminus Thr106 does not contact CYP199A2. However, Asp69 on the α3 helix forms a salt bridge with Arg368 while Gly73 contacts Tyr67 on CYP199A2. Hence, the CYP11A1-Adx orientation is more consistent with the mutagenesis data but the solvent-exposed nature of HaPux Asn42 and the location of the Glu38 are expected to weaken CYP199A2-HaPux binding compared to the DEER-derived structure.
CONCLUSION
Our methodology, using orientation-selective DEER, MTSSL spin labels and rigid-body docking, allowed us to determine a unique structural model for a CYP199A2-HaPux complex, the properties of which are consistent with biochemical and mutagenesis data. Using only DEER data and rigid-body structures the methodology is able to determine a small ensemble of CYP199A2-HaPux complexes with a narrow spatial distribution where the two proteins are approximately docked at an atomic resolution. The experimental DEER data were well modeled by a single protein complex, but the resolution of the methodology does not exclude the existence of other minor conformers.
The main error in structure determination comes from computation of the spin label rotamer distributions, and this error was estimated using fourteen rotamer computation methods to determine the corresponding DEER-fit complex error. This yields a standard deviation (STD) of the Cα atoms for the set of DEER-fit complexes of 2.3 Å, indicating that a stable solution results which is not critically sensitive to computation of rotamer distributions.
To determine docked complexes, PatchDock and FireDock were used to generate a comprehensive set (28,295) of trial CYP199A2-HaPux complexes, and these were subsequently ranked using the objective function Rtot computed from DEER simulations using fourteen rotamer libraries. This procedure identified six complexes with an acceptable Rtot which were consistent with the unbiased DEER-fit complexes.
Instead of a single canonical structure for this family of complexes, the available structures suggest that Class I CYPs have independently evolved electron transfer complexes, of which there may be many types. The reasons for this might include modulation of the electron transfer rate to suit the CYP-catalyzed monooxygenation and the prevention of cross-reactivity between a given CYP and non-cognate ferredoxins, which could be more abundant than the correct ferredoxin. However, the structures demonstrate that
[image:11.612.67.301.139.283.2]ferredoxin residues within the α3 helix, the [Fe2S2] cluster-binding loop and the C-terminus are likely to be involved in interactions with residues on the CYP proximal surface. Further work is required on the binding orientations of other known physiological CYP-Fdx complexes as well as how more promiscuous ferredoxins interact with the CYPs that they reduce. The structure of the CYP199A2-HaPux complex offers the possibility of using structural and sequence alignment of a CYP enzyme to identify mutations to tailor the enzyme to bind to and accept electrons from HaPux in order to reconstitute its monooxygenase activity.
The development of orientation-selective DEER provides a tool for advancing knowledge on Class I CYP electron transfer complexes. Since such transient complexes can be difficult to crystallize, our approach enables the needed information to be gathered from frozen-solution samples, allowing old and new questions to be answered and new applications of these enzymes in synthesis to be pursued.
Supporting Information
Mutagenesis, protein production, purification and activity assays, Spin labeling of CYP199A2, sample preparation, crystal structure determination of HaPux, EPR experimental, pattern search algorithm, Tables S1 to S3, Fig. S1 to S15 and structural files for the six complexes determined with acceptable Rtot values. This material is available free of charge via the Internet at http://pubs.acs.org. Additional information, including underlying spectroscopic data, is available by contacting the corresponding authors or at DOI: 10.1000/xyz123.
Acknowledgments
This research was supported by the Engineering & Physical Sciences Research Council (EPSRC) and the Biotechnology & Biological Sciences Research Council (BBSRC), UK (EP/D048559). AMB and EOJD were supported by graduate studentships from the BBSRC (BB/F01709X/1) and NJH and JEL were supported by graduate studentships from the EPSRC, and JEL after her DPhil by EP/D048559. AMB gratefully acknowledges her current fellowship support from the Royal Society and EPSRC for a Dorothy Hodgkin Fellowship (DH160004). JRH acknowledges support from the ARC (FT120100421) and the Centre for Advanced Imaging, The University of Queensland. Figures containing image of protein structures were generated using UCSF Chimera.69,70
REFERENCES
(1) Omura, T.; Sato, R. J. Biol. Chem.1964, 239, 2370. (2) Nelson, D. R. Hum Genomics2009, 4, 59.
(3) Laing, R.; Bartley, D. J.; Morrison, A. A.; Rezansoff, A.; Martinelli, A.; Laing, S. T.; Gilleard, J. S. Int. J. Parasitol.2015, 45, 243.
(4) Lamb, D. C.; Lei, L.; Warrilow, A. G.; Lepesheva, G. I.; Mullins, J. G.; Waterman, M. R.; Kelly, S. L. J. Virol. 2009, 83, 8266.
(5) Cytochrome P450: Structure, Mechanism, and Biochemistry 3rd ed.; Ortiz de Montellano, P. R., Ed.; Kluwer Academic/Plenum Press: New York, 2005.
(6) Hannemann, F.; Bichet, A.; Ewen, K. M.; Bernhardt, R. Biochim. Biophys. Acta2007, 1770, 330.
(7) Strushkevich, N.; MacKenzie, F.; Cherkesova, T.; Grabovec, I.; Usanov, S.; Park, H. W. Proc. Natl. Acad. Sci. U.S.A.2011, 108, 10139.
(8) Annalora, A. J.; Goodin, D. B.; Hong, W. X.; Zhang, Q.; Johnson, E. F.; Stout, C. D. J. Mol. Biol. 2010, 396, 441.
(9) Matsuoka, T.; Miyakoshi, S.; Tanzawa, K.; Nakahara, K.; Hosobuchi, M.; Serizawa, N. Eur. J. Biochem.1989, 184, 707.
(10) Wang, J. B.; Li, G.; Reetz, M. T. Chem. Commun.2017, 53, 3916.
(11) Urlacher, V. B.; Girhard, M. Trends Biotechnol. 2012, 30, 26.
(12) Weissenborn, M. J.; Notonier, S.; Lang, S. L.; Otte, K. B.; Herter, S.; Turner, N. J.; Flitsch, S. L.; Hauer, B. Chem. Commun.2016, 52, 6158.
(13) Jung, E.; Park, B. G.; Ahsan, M. M.; Kim, J.; Yun, H.; Choi, K. Y.; Kim, B. G. Appl. Microbiol. Biotechnol.2016, 100, 10375.
(14) Both, P.; Busch, H.; Kelly, P. P.; Mutti, F. G.; Turner, N. J.; Flitsch, S. L. Angew. Chem. Int. Ed.2016, 55, 1511.
(15) Abdalla, J. A.; Bowen, A. M.; Bell, S. G.; Wong, L. L.; Timmel, C. R.; Harmer, J. Phys. Chem. Chem. Phys. 2012, 14, 6526.
(16) Malca, S. H.; Scheps, D.; Kuhnel, L.; Venegas-Venegas, E.; Seifert, A.; Nestl, B. M.; Hauer, B. Chem. Commun.2012, 48, 5115.
(17) Yang, W.; Bell, S. G.; Wang, H.; Zhou, W. H.; Hoskins, N.; Dale, A.; Bartlam, M.; Wong, L. L.; Rao, Z. H. J. Biol. Chem.2010, 285, 27372.
(18) Hall, E. A.; Sarkar, M. R.; Lee, J. H. Z.; Munday, S. D.; Bell, S. G. Acs Catalysis2016, 6, 6306.
(19) Muller, A.; Muller, J. J.; Muller, Y. A.; Uhlmann, H.; Bernhardt, R.; Heinemann, U. Structure 1998, 6, 269.
(20) Eichler, A.; Gricman, L.; Herter, S.; Kelly, P. P.; Turner, N. J.; Pleiss, J.; Flitsch, S. L. ChemBioChem2016, 17, 426.
(21) Chao, R. R.; Lau, I. C. K.; De Voss, J. J.; Bell, S. G. Chemcatchem2016, 8, 3626.
(22) Pham, S. Q.; Pompidor, G.; Liu, J.; Li, X. D.; Li, Z. Chem. Commun.2012, 48, 4618.
(23) Yasuda, K.; Yogo, Y.; Sugimoto, H.; Mano, H.; Takita, T.; Ohta, M.; Kamakura, M.; Ikushiro, S.; Yasukawa, K.; Shiro, Y.; Sakaki, T. Biochem. Biophys. Res. Commun.2017, 486, 336.
(24) Nikolaus, J.; Nguyen, K. T.; Virus, C.; Riehm, J. L.; Hutter, M.; Bernhardt, R. Steroids2017, 120, 41.
(25) Hayashi, K.; Yasuda, K.; Yogo, Y.; Takita, T.; Yasukawa, K.; Ohta, M.; Kamakura, M.; Ikushiro, S.; Sakaki, T. Biochem. Biophys. Res. Commun. 2016, 473, 853.
(26) Khatri, Y.; Schifrin, A.; Bernhardt, R. FEBS Lett. 2017, 591, 1126.
(27) Schmitz, D.; Zapp, J.; Bernhardt, R. Microb. Cell. Fact.2014, 13, 81.