PROCEEDINGS OF SPIE
SPIEDigitalLibrary.org/conference-proceedings-of-spie
Millimeter-wave micro-Doppler
measurements of small UAVs
Samiur Rahman, Duncan A. Robertson
Samiur Rahman, Duncan A. Robertson, "Millimeter-wave micro-Doppler
measurements of small UAVs," Proc. SPIE 10188, Radar Sensor Technology
XXI, 101880T (1 May 2017); doi: 10.1117/12.2261942
Millimeter-wave micro-Doppler measurements of small UAVs
Samiur Rahman*
a, Duncan A. Robertson
aa
University of St Andrews, SUPA School of Physics & Astronomy,
St Andrews, Fife KY16 9SS, Scotland
ABSTRACT
This paper discusses the micro-Doppler signatures of small UAVs obtained from a millimeter-wave radar system. At first, simulation results are shown to demonstrate the theoretical concept. It is illustrated that whilst the propeller rotation rate of the small UAVs is quite high, millimeter-wave radar systems are capable of capturing the full micro-Doppler spread. Measurements of small UAVs have been performed with both CW and FMCW radars operating at 94 GHz. The CW radar was used for obtaining micro-Doppler signatures of individual propellers. The field test data of a flying small UAV was collected with the FMCW radar and was processed to extract micro-Doppler signatures. The high fidelity results clearly reveal features such as blade flashes and propeller rotation modulation lines which can be used to classify targets. This work confirms that millimeter-wave radar is suitable for the detection and classification of small UAVs at usefully long ranges.
Keywords: UAV, drone, Micro-Doppler, Radar, Millimeter-wave, FMCW, CW
1. INTRODUCTION
In the past few years, consumer drones have become readily available to the general public. Along with providing many opportunities, drones can also pose significant security threats. A user with malicious intent can use it for dropping/transferring explosives or contraband, illegal video recording etc. Equally importantly, even a novice user can create problems unintentionally which may disrupt a citizen’s privacy/safety or create damage to an important facility.
Radar micro-Doppler signatures are an intrinsic characteristics of any small UAV (sUAV) due to its propeller rotation. Any countermeasure system for sUAVs flying over restricted areas would require classification of the detected moving target, hence micro-Doppler signatures can be very useful for sUAV identification. In1, 2, 3, the concept of the
micro-Doppler signature of an object and its effect on radar signal returns have been elaborately discussed. These papers provide the mathematical approaches for extracting the micro-Doppler information from the radar data. In4, 5, experimental results
are shown where micro-Doppler features of a sUAV are demonstrated by means of spectrogram and range-Doppler plots. Those experiments were conducted with X-band FMCW and CW radars and demonstrated the micro-Doppler effect due to the propeller rotation of sUAVs. In6, 7, micro-Doppler results are reported for experiments conducted with with S-band
multistatic radar. They have shown the difference between micro-Doppler signatures of the sUAV propeller rotation and the wing flapping of birds. It infers that a coherent radar system which is sensitive enough to acquire micro-Doppler properties of a flying object can be used to classify the object (e.g. identifying the flying object as a sUAV or a bird). Even though quite a lot of research work has been carried out recently in the field of radar micro-Doppler signatures of a sUAV, the number of reports on millimeter-wave radar micro-Doppler sUAV data is very few. This paper intends to provide experimental results of micro-Doppler signatures of a sUAV obtained in the millimeter-wave band (94 GHz).
In this paper, the theoretical concept of micro-Doppler signatures is discussed. Simulations are performed to demonstrate the method of obtaining micro-Doppler signatures of an object from coherent radar data. The simulation parameters are determined by keeping in mind the practical specifications of a sUAV and the radar used for the field test. Different frequency values are used to compare micro-Doppler performance. The simulation of bird micro-Doppler is also performed for comparison. Finally, experimental results are shown and analyzed. The results were obtained with existing 94 GHz CW and FMCW radar systems at the University of St Andrews.
2. MICRO-DOPPLER SIGNATURE OF A SUAV
2.1 Basic concept of micro-Doppler
Periodic movement of any structural component of an object can be called “micro motion”8. Examples of micro motion
are the swinging arms and legs of a human body, the flapping wings of a bird or the propeller rotation of a sUAV. These micro motions induce side bands about the bulk Doppler frequency and are known as micro-Doppler frequencies.
The micro-Doppler effect in radar is heavily frequency dependent. For the purpose of this paper, explanation is provided in terms of the propeller blade rotation of helicopter-like flying objects. Considering L as the length of the blade from its center and Ω as the rotation rate in revolution/second, the blade tip velocity Vtip = 2πLΩ. The maximum Doppler shift can
be readily calculated as8,
{𝑓𝑑}𝑚𝑎𝑥 = (
2𝑉𝑡𝑖𝑝
𝜆 ) 𝑐𝑜𝑠 𝛽 (1)
where β is the elevation angle and λ is the radar wavelength. It can be seen from Eq. 1 that maximum Doppler frequency is proportional to radar operating frequency. This suggests that using a higher frequency radar would provide a comparatively higher frequency Doppler signal. It should be noted that the propeller rotation rate of a commercial sUAV can be within the range of 100-200 Hz or even more.
As micro-Doppler is time dependent, the feature extraction from the radar data should account for the time dependency as well. A standard Fourier transform provides frequency information but not temporal information. To achieve that, the Short Time Fourier Transform (STFT)9 is used. This method takes a signal chunk and divides it into small parts maintaining
time continuity. Each small part is windowed and Fourier transformed and the set of resulting spectra is shown as a spectrogram. This provides temporal information along with the frequency information while processing radar Doppler data. Also, due to the time dependency, a high sampling rate is required to unambiguously detect the micro-Doppler signal of the fast rotating propeller blades. For an FMCW radar, the maximum unambiguous micro-Doppler frequency is inversely proportional to the FMCW radar chirp period, fd, max = 1/2ts, where ts is the chirp period. The rate at which individual chirps are sampled in an FMCW radar can therefore be very high if a large unambiguous Doppler frequency is required. In contrast, the sampling rate required for a CW radar is lower, simply set by the maximum Doppler shift, which gives CW radar an apparent advantage. In practice though, a sUAV detection system will require to track the position of the vehicle as well so range information is required and solely using a CW radar is not a practical solution.
3. MICRO-DOPPLER SIMULATION RESULTS
This section illustrates and analyzes the micro-Doppler simulation results. The simulation parameters used here are based on actual physical dimensions and rotation rate of the propeller blades of a commercial drone. The chosen radar frequency is 94 GHz in order to maintain consistency with the subsequent experimental results.
3.1 Mathematical model and simulation parameters
For visual clarity, one rotor with two blades is modelled first. For propeller blade modelling, the equation from Chen8 for
the time domain signature of rotor blades is used. The total received signal in the time domain is8,
𝑠∑ (𝑡) = 𝐿𝑒{−𝑗 4𝜋
𝜆[𝑅𝑜+𝑧𝑜sin 𝛽]} ∑ sinc {4𝜋
𝜆 𝐿
2cos 𝛽 cos (Ω𝑡 + 𝜑𝑜+ 𝑘2𝜋
𝑁 )} 𝑒{−𝑗𝛷𝑘(𝑡)} (2)
𝑁−1
𝑘=0
o
,00
50 -15 ó
20 Ñ
-25 -30 m
-50 I I I I -35 T.)
-100
V V V 1 V IV 1 V
VI I I
I
1 V V I 1
V h VI
1 II?:
0 0.01 0.02 0.03 0.04 0.05 0.06 0.07 0.08 0.09 0.1
Time (s)
100
50
0
-50
-100
0.01 0.02 0.03 0.04 0.05 0.06 0.07 0.08 0.09 0.1 Time (s)
o
-s
10
-15 ó
-20 E
N
25
--30 0
i
-35 m
CC -40
-45
-50
rate can vary from 130-280 Hz. This corresponds to Doppler frequency range of 67-143 kHz. The sampling rate has been chosen accordingly to comply with the Nyquist criterion.
[image:4.612.153.463.134.309.2]3.2 Simulated micro-Doppler images
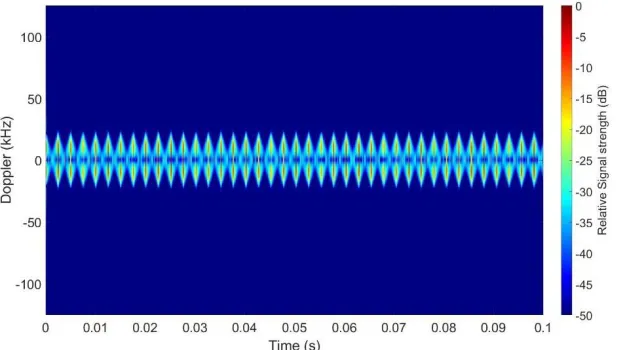
Figure 1. Simulated micro-Doppler signatures of 2 rotating blades of a rotor at 94 GHz
Figure 2. Simulated micro-Doppler signatures of 2 rotating blades of a rotor at 10 GHz
Figure 1 and Figure 2 show simulated results for a single rotor. The images are obtained by performing STFT. Modelling for 10 GHz is also performed to visually compare the effect of frequency on micro-Doppler signatures. Both images are performed by considering a rotor rotation rate of 200 Hz. This corresponds to a maximum Doppler frequency of 102.44 kHz for 94 GHz (from Eq. 1). The elevation angle has been considered to be zero degree for the sake of simplicity. For 10 GHz, the maximum Doppler is 10.9 kHz. Figure 1 and Figure 2 clearly show this difference in Doppler spread for the two frequencies. This simply confirms that transmitting radar signals at higher frequencies will generate higher Doppler frequencies. Continuous blade flashes (red vertical lines) are observed where at a given time, the top half corresponds to one blade and the bottom half corresponds to the other one, and they are momentarily aligned normal to the radar beam producing a strong reflection.
[image:4.612.154.463.350.525.2]0
0.8
-5
0.6
-10
0.4 -15 á
= 0.2 -20 2
0 -25 m
a
a-0.2 -30 m
-0.4 -35 m
-0.6 -40
-0.8 -45
-50
0.02 0.025 0.03 0.035 0.04 0.045 0.05 0.055 0.06
Time (s)
Doppler (kHz)
's
ú
°
Releve Signal strength 1dB)
Doppiar
(kHz)
o
ReleMeBlg el
t e
th d
temporal resolution. Increasing the window length will result into losing the temporal features such as the blade flashes but in contrast it illustrates lines with equal spacing which are known as the Helicopter Rotor Modulation (HERM)10 lines.
[image:5.612.157.464.127.304.2]The HERM line spacing depends directly on the rotor rotation rate and the number of blades.
[image:5.612.87.525.394.511.2]Figure 3. Simulated micro-Doppler signature (zoomed in) obtained with long STFT window showing the HERM lines
Figure 3 shows the HERM lines obtained by using a larger STFT window (25 milliseconds). The line spacing is the product of the rotor rotation rate and the number of blades. As the rotor rotation rate is 200 Hz and there are two blades, the line spacing should be 400 Hz which is seen in Figure 3. In a practical situation for a drone with more than one rotor and with different rotation rates, this constant spacing is highly unlikely to be observed.
Figure 4. Micro-Doppler signatures (zoomed in) obtained for four rotors with different constant rotation speeds by using short STFT window (left) and long STFT window (right)
Figure 4 shows the modelled results for four rotors rotating at different but constant speeds. It shows that the blade flash time spacing and the HERM line spacing are much more complicated.
Simulation results for the micro-Doppler signatures of a bird are also presented here for comparison. Simulation was done by using bird modelling equations from8. A 94 GHz signal frequency is used here as well. Also, different frequencies of
flapping wings of birds are used, which are significantly lower than the sUAV propeller blade rotation rates.
30 20 o -10 -20 -30 0
1
0.1 02 0.3 04 0.5 0.6
Time (s)
0.7 0.8 09 1-10 -5 -20 -25 30 20 10 -20 0
0 0.1 0.2 03 0.4 0.5 0.6 0.7 08 09 lime (s)
Ii.
10 9 6 i 7 6 5 ú 4 a ó 3 2Propeller on UAV Full Spectrogram
00
10 20 30 40 50 60 70 80
Time Im61
....im.i
90 100
om m s
m m m
50 -52 -54 E -50 ÿ -60 3 -62 ñ v -64 > w -66 60 >0
[image:6.612.78.534.124.245.2]temporal information in a 100 ms data capture. This could pose a problem for a single unit sUAV classification radar system design. A trade-off will be required in order to extract sufficient micro-Doppler information for both objects without significantly deteriorating the reliability of the classification algorithm.
Figure 5. Simulated results of bird micro-Doppler at 94 GHz with wing flapping frequency of 10 Hz (left) and 2 Hz (right)
4. CW AND FMCW RADAR EXPERIMENTAL RESULTS
The experimental results shown in this section are all obtained from the radar systems built at the University of St Andrews and operating at 94 GHz.
4.1 CW radar
[image:6.612.173.431.401.625.2]A lab based CW radar measurement was performed to examine the micro-Doppler characteristics of a single two bladed propeller at 94 GHz. Plastic rotor blades from a quadcopter mounted on a variable speed motor was used for the experiment (blade length is 11.81 cm). A digital oscilloscope with a 250 ksamples/second was used to sample the radar IF signal. The distance between the center of the blades and the radar was 57 cm. The CW radar does not have I-Q outputs so cannot distinguish between positive and negative velocities.
Figure 6. Micro-Doppler signatures of the propeller blades obtained from CW radar data (Courtesy: Euan S. Ward)
3
2
Ñ 1
0
a
o
-1
-2
-3
0 0.5 1 1.5 2 2.5 3 Time (s)
3.5 4 4.5
0 5 10
15 ó
20 c
25
30 u
35 m
rc
-40
-45
50
(i,
Á
Á
W
W
Ñ
Ñ
O
N
o
U
O
U
O
N
o
Relative Signal strength (dB)
(T
O
approaching or receding blades. It can be seen that the rotation period (two blade flashes) is about 56 ms so the rotation rate is about 17.9 Hz which agrees with the motor’s Hall sensor value. The maximum Doppler frequency observed from Figure 6 is 8.3 kHz which is consistent with the rotation rate and blade length.
4.2 FMCW radar
All the FMCW radar results presented in this paper were obtained with the 94 GHz NIRAD radar11. The data collection
[image:7.612.163.457.221.391.2]was done by operating the radar in staring mode while using two channels (I and Q). Circular polarization was used and signals collected for odd-bounce targets. The DDS chirp duration was 102.4 μs and the chirp repetition interval was 144 μs and the sampling rate was 10 MHz. The radar operating bandwidth was 600 MHz, corresponding to a range resolution of 25 cm. The maximum unambiguous Doppler signal obtained can be readily calculated from the chirp interval, and is 3.47 kHz.
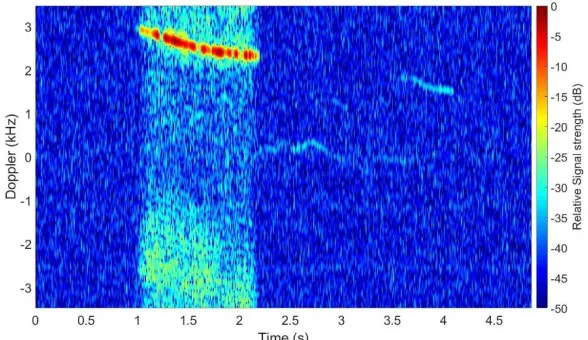
[image:7.612.162.459.498.671.2]Figure 7. Spectrogram of a flying DJI Phantom appearing on the radar beam and then disappearing again
Figure 7 illustrates a spectrogram result for a given range bin. The drone was flying approximately 120 m away from the radar at an angle to the radar beam. The bulk Doppler in bright red corresponds to approximately 2-3 kHz and the change in bulk Doppler value is clearly evident. The micro-Doppler features can be seen around both sides of the bulk Doppler. At around 2.1 seconds, the drone flies away from the radar beam, hence no Doppler feature is observed. The signal to noise ratio of the drone at this range is substantial.
010:11CCXX:IC
3
2
rû 1
2
0
d d
o
o-1
-2
-3
0 0.5 1 1.5 2 2.5 3
Time (s)
3.5 4 4.5 5
0
-5
-10
-15
-20 cm
-25
-30 m >
-35 Ñ
-40
-45
-50
-2
0 0.1 0.2 0.3 0.4 0.5 0.6 0.7 0.8 0.9
Time (s)
0 -5
-15 á
q
-20 é
25
--35
p
[image:8.612.160.462.127.305.2]
--40 -45 -50
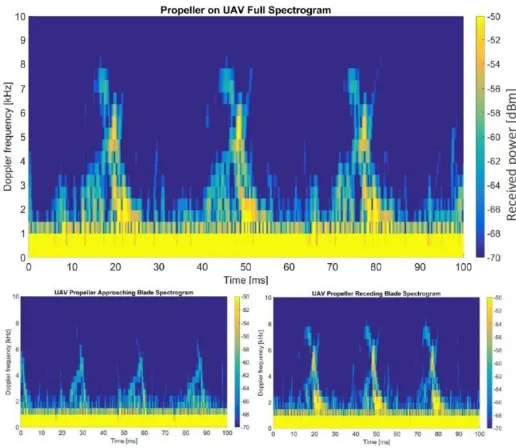
Figure 8 was obtained by keeping track of the range bins occupied by the drone during its flight. As can be seen in the first 0.5 seconds of the image, the bulk Doppler exceeds the maximum unambiguous value and Doppler aliasing has occurred. Micro-Doppler signatures are also clearly visible which can be used for classification.
Figure 9. Spectrogram of a human operating the drone at 120 m range from the radar
[image:8.612.81.540.405.532.2]In order to demonstrate that the micro-Doppler of a drone will be significantly different from a signature of some other object, the spectrogram of a human (the drone operator) is shown in Figure 9 for comparison. All the radar settings were exactly the same. As the operator was standing, the bulk Doppler is zero throughout. Slight jitters can be attributed to their movements whilst operating the drone. Comparing Figure 8 and Figure 9, the contrast in terms of micro-Doppler features is easily observed.
Figure 10. Spectrogram of the DJI Phantom using short STFT window (left) and long STFT window (right)
U
?\¡
1
1
r
1
[image:9.612.187.426.85.226.2]AA
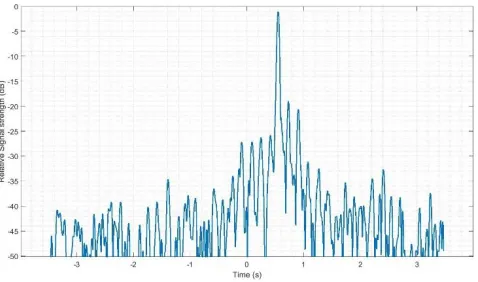
Figure 11. Doppler frequency slice obtained from the spectrogram with long STFT window showing the HERM lines
Comparing the two spectrogram results in Figure 10, it can be said that using different window length demonstrates different features. This can be used as an advantage during classification process. It should be mentioned that the micro-Doppler signal return is also dependent on the aspect angle of the drone with respect to the radar. So, in practice, developing an algorithm exclusively in terms of the blade flashes of a drone arbitrarily flying a few hundred meters away from the radar may be imprudent. Hence, combining both results can increase the reliability of the classification algorithm.
5. CONCLUSION AND FUTURE WORKS
The study of the micro-Doppler properties of sUAVs at millimeter-wave frequencies was the primary focus of this paper. Simulations were performed first to demonstrate the theoretical concepts. It was confirmed that using a higher radar frequency will generate higher Doppler frequencies, which can be advantageous for designing a system dedicated to detecting and classifying sUAVs. Also, the micro-Doppler signatures of a bird have been shown to be markedly different from those of a drone, which is also very useful for object identification. HERM lines produced due to the propeller rotation rate were demonstrated by using longer STFT window. Experimental results for both CW and FMCW radar data validate the simulated results.
Micro-Doppler signatures including blade flashes due to the propeller blades were observed from a DJI Phantom 3 Standard using a 94 GHz FMCW radar at a range of 120 m. High signal-to-noise ratio was obtained from the drone and its propellers at this range. Also, HERM lines can be revealed in the measured data by suitable processing. Comparison of spectrograms of a sUAV and a human was made which shows a clear difference in the micro-Doppler features. The processed micro-Doppler results can certainly be used for studying unique sUAV characteristics and target classification. From the experimental results, it can be suggested that millimeter-wave radar is very sensitive to the micro-Doppler returns of a sUAV and is suitable for the detection and classification of such targets at usefully long ranges.
Whilst different STFT window lengths can increase the consistency of a classifier, they can also increase the computational load. Hence, other joint time-frequency analysis methods will also be explored in the future. For instance, the wavelet transform method actually takes the window length into account. It plots a scalogram by correlating signals by varying the wavelet length. The two main factors that will be taken into consideration are the false alarm rate and the computation time (for STFT, the actual time would be the addition of the time taken for both short and long window). Also, the change in micro-Doppler returns due to varying the chirp repetition interval of the millimeter-wave FMCW radar will also be examined in the future.
6. ACKNOWLEDGEMENTS
REFERENCES
[1] V. C. Chen, F. Li, S. S. Ho and H. Wechsler, "Analysis of micro-Doppler signatures," IEE Proceedings - Radar, Sonar and Navigation, vol. 150, no. 4, pp. 271-6-, 1 Aug. 2003, DOI: 10.1049/ip-rsn:20030743.
[2] V. C. Chen, F. Li, S. S. Ho and H. Wechsler, "Micro-Doppler effect in radar: phenomenon, model, and simulation study," IEEE Transactions on Aerospace and Electronic Systems, vol. 42, no. 1, pp. 2-21, Jan. 2006, DOI: 10.1109/TAES.2006.1603402.
[3] V. C. Chen, and Shie Qian, "Joint time-frequency transform for radar range-Doppler imaging," IEEE Transactions on Aerospace and Electronic Systems, vol. 34, no. 2, pp. 486-499, Apr 1998, DOI: 10.1109/7.670330.
[4] J. J. M. de Wit, R. I. A. Harmanny and G. Prémel-Cabic, "Micro-Doppler analysis of small UAVs," 9th European Radar Conference, Amsterdam, 2012, pp. 210-213.
[5] J. J. M. de Wit, R. I. A. Harmanny and P. Molchanov, "Radar micro-Doppler feature extraction using the Singular
Value Decomposition," International Radar Conference, Lille, 2014, pp. 1-6, DOI:
10.1109/RADAR.2014.7060268.
[6] M. Ritchie, F. Fioranelli, H. Griffiths and B. Torvik, "Monostatic and bistatic radar measurements of birds and micro-drone," IEEE Radar Conference (RadarConf), Philadelphia, PA, 2016, pp. 1-5, DOI: 10.1109/RADAR.2016.7485181.
[7] F. Fioranelli, M. Ritchie, H. Griffiths and H. Borrion, "Classification of loaded/unloaded micro-drones using multistatic radar," Electronics Letters, vol. 51, no. 22, pp. 1813-1815, 10 22 2015, DOI: 10.1049/el.2015.3038. [8] V. C. Chen, The micro-Doppler effect in radar, Artech House, 2011.
[9] V. C. Chen, D. Tahmoush and W. J. Miceli, Radar micro-Doppler signature, IET Radar, Sonar and Navigation
series volume 34, 2014.
[10]D. Blacknell, and H. Griffiths, Radar automatic target recognition (ATR) and non-cooperative target recognition (NCTR), IET Radar, Sonar and Navigation series volume 33, 2013.