doi:10.4236/eng.2011.37084 Published Online July 2011 (http://www.SciRP.org/journal/eng)
Optimization of Bead Geometry in CO
2
Laser Welding of
Ti 6Al 4V Using Response Surface Methodology
Ali Khorram1, Majid Ghoreishi2, Mohammad Reza Soleymani Yazdi3, Mahmood Moradi4
1
Department of Mechanical Engineering, Iran University of Industries and Mines (IUIM), Tehran, Iran
2
Khaje Nasir University, Tehran, Iran
3
IH University, Tehran, Iran
4
Department of Mechanical Engineering, Khaje Nasir University, Tehran, Iran E-mail: [email protected]
Received February 24, 2011; revised May 3, 2011; accepted May 15, 2011
Abstract
In the presented study, the laser butt-welding of Ti 6Al 4V is investigated using 2.2 kw CO2 laser. Ti 6Al 4V alloy has widespread application in various fields of industries including the medical, nuclear and aerospace. In this study, Response Surface Methodology (RSM) is employed to establish the design of experiments and to optimize the bead geometry. The relationships between the input laser-welding parameters (i.e. laser power, welding speed and focal point position) and the process responses (i.e. welded zone width, heat af-fected zone width, welded zone area, heat afaf-fected zone area and penetration depth) are investigated. The multi-response optimizations are used to optimize the welding process. The optimum welding conditions are identified in order to increase the productivity and minimize the total operating cost. The validation results demonstrate that the developed models are accurate with low percentages of error (less than 12.5%).
Keywords:Laser Welding, Response Surface Method (RSM), Optimization, Ti 6Al 4V
1. Introduction
The laser beam focuses on a small area and creates high-power density to the material surface, thus its beam can be used as a welding process [1].
Since 1940S, titanium and its alloys have been one of the most important engineering materials which have been widely used in industries because of their specific physical, chemical and mechanical properties. High strength to weight ratio, good corrosion resistance and suitable adaptability to human body lead to its applica-tion in medical, chemistry and aerospace industries. Among titanium alloys, Ti 6Al 4v with + phase is widely used [2].
To decrease cost and time, it is comfortable to predict laser welding parameters based on process modeling. There are various methods for predicting and optimizing of the welding parameters. Recently, design of experi-ment (DOE) has been used for many applications in dif-ferent areas. Responses surface method (RSM) is the best known type of DOE design; the concept of RSM was introduced in the early 1950’s by Box and Wilson [3].
Boumerzoug et al. studied the effect of arc welding on
microstructures and mechanical properties of industrial low carbon steel. The results indicate that microstruc-tures are different in various zones. Also maximum hardness value is situated in weld metal and heat affected zone areas [4].
Dissimilar Welding of Superduplex Stainless Steel/ HSLA Steel were investigated by Mendoza et al. The dissimilar joint has acceptable properties which are supe-rior to the HSLA and lower than the SDSS [5].
Olabi et al. applied RSM to investigate the effect of laser welding parameters on residual stress distribution over the depth, at three locations from the weld centre line of AISI304 butt joints [6].
Casalino et al. investigated butt welding of Ti 6Al 4V alloy by using continuous CO2 laser [7]. Olabi et al. used
an ANN and Taguchi algorithms integrated approach to the optimization of CO2 laser welding of medium carbon
steel [8].
709
focal point position and gas pressure) assumed constant. Tensile strength, microhardness and weld geometrical dimension were considered as process responses [9].
Li et al. used a 6 KW CO2 laser for welding of
tita-nium. Helium and Argon gases were used to prevent oxidation [10]. Anava et al. in their investigation used a CO2 continuous laser welding for joining a dissimilar
AISI 316 stainless-steel and AISI 1009 low carbon steel plates. Taguchi approach was used as statistical design of experiment technique for optimization of welding pa-rameters (laser power, welding speed and defocusing distance) with the objective of producing welded joint with complete penetration, minimum fusion zone size and acceptable welding profile [11].
In the present study, firstly RSM is employed for de-velopment of mathematical models. Second aim is to find the optimal welding combination that would maxi-mize the penetration depth while minimizing other bead geometry (welded zone width, heat affected zone width, welded zone area and heat affected zone area). The la-ser-welding parameters used in this study were parame-ters that can be controlled on the welding machine.
2. Response Surface Methodology
Response Surface Methodology is one of the optimiza-tion techniques in describing the performance of the welding process and finding the optimum setting of pa-rameters. RSM is a mathematical-statistical method that used for modeling and predicting the response of interest affected by some input variables to optimize the response [12].
RSM also specifies the relationships among one or more measured responses and the essential controllable input factors [13].
When all independent variables are measurable, con-trollable and continuous in the process, with negligible error, the response surface model is as follow:
1, 2, n
y f x x x (1) where “n” is the number of independent variables.
To optimize the response “y”, it is necessary to find an appropriate approximation for the true functional rela-tionship between the independent variables and the re-sponse surface. Usually a second-order polynomial Equation (2) is used in RSM.
2
0 i i ii ii ij i j 0
yb
b x
b x
b x x (2)3. Experimental Design
A central composite design including five levels of fac-tors was employed. Linear and second order polynomials
were fitted to the experimental data to obtain the regres-sion equations. The lack of fit test, variance test and other adequacy measures were used in selecting optimum models. Laser power, welding speed and focal point po-sition considered as independent input variables. Table 1
shows laser input variables and experiment levels.
4. Experimental Work
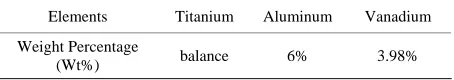
Titanium alloy Ti 6Al 4V with chemical composition presented in Table 2 was used as work piece material. The size of each sample was 85 mm long × 35 mm width with thickness of 1.7 mm.
To determine the working levels of each variable, sev-eral preliminary experiments were conducted. Absence of visible welding defects and at least half depth penetra-tion were the criteria of choosing the working ranges. To avoid any systematic error, experiments were conducted in random order using an Optimo model CO2 laser
ma-chine, provided by OPTIMA Industries. Argon gas with constant pressure of 0.1 bar was used as shielding gas. For metallography of specimens, each transverse section of specimen was mounted. Etch solvent with the chemi-cal composition of 2 ml HF + 10 ml HNO3 + 88 ml
de-ionized H2O was employed.
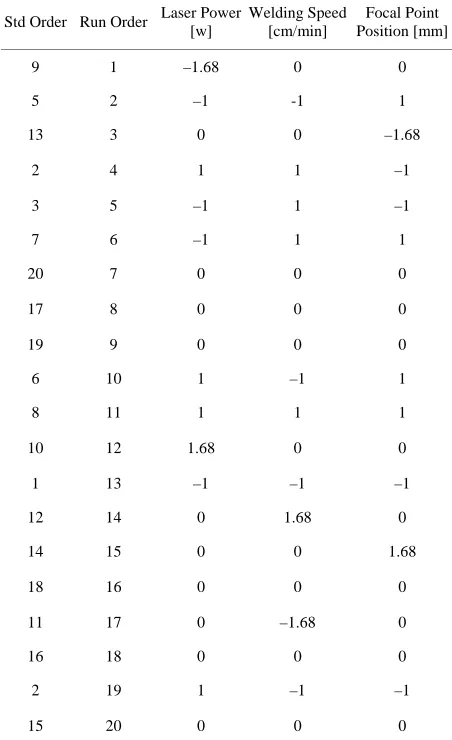
Welding geometrical parameters were measured using optical microscope and image Analyzer software. The designed experiments are shown in Table 3. Figure 1
presents the bead shape and size of the selected sample.
5. Result and Discussion
5.1. Development of Mathematical Models
[image:2.595.308.538.540.651.2]The geometry of weld bead was measured in accordance with parameter setting in Table 3. Statistical analysis
Table 1. Laser input variable and experimental levels.
Focal Point Position (F) [mm] Welding Speed (S)
[cm/min] Laser Power (P)
[W] Level (coded) –1 80 1200 –1.68 –0.8 145 1400 –1 –0.5 240 1700 0 –0.2 335 2000 1 0 400 2200 1.68
Table 2. Chemical composition of alloy Ti 6Al 4V.
[image:2.595.311.538.679.719.2]Table 3. Design matrix with code independent process variables.
Std Order Run Order Laser Power[w] Welding Speed [cm/min] Position [mm]Focal Point
9 1 –1.68 0 0
5 2 –1 -1 1
13 3 0 0 –1.68
2 4 1 1 –1
3 5 –1 1 –1
7 6 –1 1 1
20 7 0 0 0
17 8 0 0 0
19 9 0 0 0
6 10 1 –1 1
8 11 1 1 1
10 12 1.68 0 0
1 13 –1 –1 –1
12 14 0 1.68 0
14 15 0 0 1.68
18 16 0 0 0
11 17 0 –1.68 0
16 18 0 0 0
2 19 1 –1 –1
15 20 0 0 0
indicates that welding speed and laser power are effec-tive and focal point position has no influence on the de-veloped models.
Considering welded zone width, statistical analysis shows that welding speed, laser power, the second order effect of welding speed and second order effect of laser power are the significant model terms. In HAZ width model, welding speed, laser power, second order effect of welding speed, second order effect of laser power and the interaction of welding speed and laser power are the most important terms in the model.
Welding speed, laser power and second order effect of welding speed are significant in welding zone area and HAZ area models.
The final developed models in terms of significant coded factors are shown below:
2 2
1383.96 110.120 373.823
23.5005 170.6 fz
w P S
P S
(3)
P = 1.65 mm; Wfz = 1.357 mm; Whaz = 2.190 mm;
Afz = 1.5909 mm2; Ahaz = 1.6757 mm2
P = 1.7 mm; Wfz = 1.319 mm; Whaz = 2.087 mm;
[image:3.595.306.538.121.513.2]Afz = 1.2508 mm2; Ahaz = 1.8655 mm2
Figure 1. Shows the bead shape, width and penetration depth of the selected sample.
2
2
2159.85 177.406 626.881 50.6832
181.602 31.8750 haz
W P S P
S S P
(4)
2
1220976 2694446 851166 328657 fz
A P S S (5)
2 1684043 212449 734612 170194
haz
A P S S (6)
5.2. Optimization
711
or at least keeps them in desired ranges.
In this study, process optimization was carried out by RSM method considering simultaneously five responses (welded zone width, heat affected zone width, welded zone area, heat affected zone area and penetration depth).
The criterion for perfect welding was chosen when penetration depth was 1727 µm Based on experimental results. Welded zone width, heat affected zone width, heat affected zone area and welded zone area were set equal 1380 µm, 2060 µm, 167 × 104 µm2 and 1158 × 103 µm2, respectively, as can be seen in Table 4. Process optimization carried out to reach to the above targets. Optimum parameter setting considering five simultane-ous responses is shown in Table 5.
5.3. Validation of the Developed Models
[image:4.595.310.538.91.418.2]To validate the developed models, confirmation experi-ments were carried out with optimum parameters setting.
Table 6summarizes the results of optimization, the ac-tual experimental values and the percentages of error. The validation results demonstrated that the developed models are accurate as the percentages of errors are less than 12.5%. Cross section of bead at optimum setting is shown in Figure 2.
6. Conclusions
From the study the following points can be concluded: 1) RSM is an accurate technique to optimize the laser welding process in order to obtain the best bead geome-try.
[image:4.595.309.538.95.419.2]2) A laser power of 1837.4 W, welding speed of
Table 4. Set up of software method based on five responses.
Parameter Lower Target Upper
Penetration Depth (µm) 1720 1727 1730
Welded Zone Width (µm) 1063 1380 1600 Heat Affected Zone Width
(µm) 1528 2060 2500 Heat Affected Zone Area
[image:4.595.58.286.503.608.2](µm2) 831,058 1,670,000 1,800,000 Welded Zone Area (µm2) 431,517 1,158,000 1,800,000
Table 5. Optimum parameter setting considering five si-multaneous responses.
Variations Set up Value (Coded) Set up Value (Uncoded)
Laser Power [w] 0.458971 1837.4
Welding Speed [cm/min] 0.155326 254.25
Focal Point Position [mm] –0.647255 –0.6941
Table 6. Validation test results.
Parameter Optimization Results
Actual Experimen-tal Values
Percentages of Error Penetration Depth
(µm) 1727 1836 5.93% Welded Zone Width
(µm) 1375 1489 7.65% Heat Affected Zone
Width (µm) 2135 2425 11.95% Heat Affected Zone
Area (µm2) 1,671,489 1,912,194 12.58% Welded Zone Area
(µm2) 1,157,542 1,322,908 12.50%
Figure 2. Cross section of bead at optimum setting.
254.25 cm/min and focal point position of 0.6941 mm are optimum parameters for obtaining the best bead ge-ometry produced from Titanium alloy (Ti 6Al 4V).
3) The welding speed has a negative effect on all re-sponses. However, the laser power has appositive effect on them. The focal point position has no effect on bead geometry of titanium alloy Ti 6Al 4V welding.
4) Superior, efficient and economical welds could be achieved using the welding conditions drawn from the statistical optimization.
7. References
[1] C. Dawes, “Laser Welding,” Abington Publishing, Abington, 1992.
[2] M. J. Donachie, “Titanium: A Technical Guide,” Ameri-can Society for Microbiology International, Materials Park, 1988, pp. 133-156.
[3] G. E. P. Box and K. B. Wilson, “On the Experimental Attainment of Optimum Conditions,” Journal of the
Royal Statistical Society, Series B, Vol. 13, No. 1, 1951,
pp. 1-38.
[image:4.595.58.285.644.720.2]Welding on Microstructure and Mechanical Properties of an Industrial Low Carbon Steel,” Engineering, Vol. 2, No. 7, 2010, pp. 502-506. [5] B. I. Mendoza1, Z. C.Maldonado, H. A. Albiter and P. E.
Robles, “Dissimilar Welding of Superduplex Stainless Steel/HSLA Steel for Offshore Applications Joined by GTAW,” Engineering, Vol. 2, No. 7, 2010, pp. 520-528.
[6] A. G. Olabi, K. Y. Benyounis and M. S. J. Hashmi, “Ap-plication of Response Surface Methodology in Describ-ing the Residual Stress Distribution in CO2 Laser
Weld-ing of AISI304,” Strain: An International Journal
Ex-perimental Mechanics, Vol. 43, No. 1, 2007, pp. 37-46.
[7] G. Casalino, F. Curcio and F. M. C. Minutolo, “Investi-gation on Ti6Al4V Laser Welding Using Statistical and Taguchi Approaches,” Journal of Materials Processing
Technology, Vol. 167, No. 2-3, 2005, pp. 422-428.
[8] A. G. Olabi, G. Casalino, K. Y. Benyounis and M. S. J. Hashmi, “An ANN and Taguchi Algorithms Integrated Approach to the Optimization of CO2 Laser Welding,”
Advances in Engineering Software, Vol. 37, No. 10, 2006,
pp. 643-648.
[9] E. Akman, A. Demir, T. Canel and T. Sınmazcelik, “La-ser Welding of Ti6Al4V Titanium Alloys,” Journal of
Materials Processing Technology, Vol. 209, No. 8, 2009,
pp. 3705-3713.
[10] Z. Li, S. L. gobbi, I. Norris, S. Zolotosvkyand and K. H. Richter, “Laser Welding Technique for Titanium Alloy Sheet,” Journal of Material Process Technology, Vol. 65, No. 1-3, 1997, pp. 203-205.
[11] E. M. Anawa and A. G. Olabi, “Using Taguchi Method to Optimize Welding Pool of Dissimilar Laser-Welded Components,” Optics & Laser Technology, Vol. 40, No. 2, March 2008, pp. 379-388.
[12] D. C. Montgomery, “Design and Analysis of Experi-ments,” 2nd Edition, Wiley, New York, 2007.