p
doi:10.4236/jils
Categ
on Low
Rajen Bhatt 1Samsung India Delhi, India. Email: rajen.bh
Received June 2
ABSTRAC
A hierarchica sented. The pr At the second system has bee chine learning scalable boos sented on a co plications to v Keywords: Ca Sup
1. Introduc
Digital Conten of vital impor available to co internet, digita home recorde form of memo With the adva imaging techn images are in casions like fa iday tours, ad rates large nu present a DCM automatically ries and detec 270o} based o images is an im indexing, sea collections. O lem because o before image to the compu with the viewsa.2011.31001 P
orizati
w Lev
t1, Gaurav S
a Software Cente
22nd, 2010; revis
CT
al system to pe roposed system stage, it detect en specially de g algorithms o ting have been ollection of ab various digital ategorization, D
pport Vector M
ction
nt Managemen rtance with gro
onsumers thro al cameras, cam ers. Digital stil
ories captured ancements in d nologies, high ncreasing at th
amily parties a dventure, and s umber of stil M solution for
categorize im ct their orientat on the conten mportant step arching, and r Orientation det often digital ca
capture and w uter they are r w geometry an
Published Online
ion an
el Feat
harma1, Abh
er, Noida, India
, schaudhury@g
sed July 29th, 20
erform automa m first categoriz ts their correct esigned for em optimized to s n used to deve bout 7000 cons media product Digital Conten Machines
nt (DCM) has owing multime ugh various m mcorders, mob ll images are by various el digital cameras h resolution a he consumer en
and gatherings still photograp l images. In
still digital im mages into fou
tions from {0o nt analysis. Ca
for enabling m retrieving ima
tection is an i amera users ro when such ima rotated and no nd human visu
e February 2011
d Reor
tures
hinav Dhall1
; 2Electrical Eng
gmail.com
010; accepted Se
atic categoriza zes images to s t orientation ou mbedded device
suit the embed elop classifiers sumer images
ts and brings p nt Managemen
become an are edia informatio mediums such a bile phones, an most importan ectronic mean s and in-camer and fine qualit nd. Various o s, outbound ho hy hobby gen this paper, w mages which ca ur broad catego o, 90o, 180o, an
ategorization o many tasks, e.g ages from larg important prob otate the camer ages are fetche ot synchronize ual system. Au
1 (http://www.Sc
rientat
, Naresh Ku
gineering Depar
eptember 23rd, 2
ation and reor some a priori d ut of {0o, 90o, es applications dded implemen rs for categoriz collected from pattern recogni nt, Feature Sel
ea on as nd nt ns. ra ty c- ol- e-we an o-nd of g., ge b-ra ed ed u-tomatic as it eli tion of The
i.e., fir
For the broad c Archite of the i rotation Then w tion of features To m devices inexpen of imag fication machin scalable The p some o scribe orientat
ciRP.org/journa
tion of
umar1, Santa
rtment, Indian In
2010
ientation of im defined catego
180o
, and 270o s using only low
ntation like su zation and ori m open resourc ition solutions lection, Orienta
c orientation d iminates the n many rotated i solution propo rst categorizat e categorization categories name ecture, Water b input image is n invariant fe within each cat f images by t s of that partic make the propo s, we make u nsive features b ges. To further n and orientati nes (SVM) for e boosting for present paper of the related
the proposed tion detection
al/jilsa)
f Imag
nu Chaudhu
nstitution of Tec
mages using co ories using rota
o}
using catego w level color a upport vector
ientation detec ces. The propo
to the consum ation Detectio
detection adds need to manual
images. osed by us is
ion and then n of images we ely Mountains, bodies, and Po s unknown to t eatures for the tegory, we dete the method tu cular category. osed approach use of simple
based on color r speed up the on detection, w
categorization the orientation is organized a
work has bee d approach fo in Section 3.
ges Bas
ury2
chnology Delhi,
ontent analysis ation invariant
ory specific mo and edge featu
machines (SVM ction. Results osed system fin mer electronics n, Scalable Bo
convenience f lly correct the
hierarchical in orientation d e have conside , Monuments/B ortraits. As the
the system, we e categorizati ect the correct uned to the
suitable for em and computa r and edge info e later stages o we use Suppo n and highly op
n detection. s follows. In S en described. or categorizat
Computation
sed
New
is is pre-t feapre-tures. odel. The ures. Ma-VMs) and
expe-riments have been reported in Section 4. Section 5 con-cludes the paper with target applications and directions for further research.
2. Related Work
Image categorization is an area of much recent research. However, most of the work uses high time complexity point detector scale invariant features (SIFT) [1]. SIFT features require high computational complexity and memory usage. A recent representation of images, bag of words [2], derived from text document analysis has been shown to be very good for categorization tasks [2-4]. However, one cannot make use of such complex features because of hardware limitations and hence one cannot perform point detection and description for potentially multiple points on a full image.
Orientation detection is also a well researched field. A Bayesian learning approach has been proposed in [5]. In [6,7], authors have used SVMs with content-based fea-tures for orientation detection. They have used spatial color moments (CM) and edge direction histograms (EDH) and trained eight parallel SVMs, two for each class with the two different features, i.e., CM and EDH.
They have used classifier combination using averaging and another SVM on top of the eight SVM outputs. Adaboost-based approach proposed in [8] also used CM and EDH features. They have trained an indoor versus outdoor classifier using similar Adaboost algorithm and then used the category specific orientation detection. However, we feel that classifying images into indoor and outdoor is very broad and does not cover conceptually classes used by consumers to sort the images. Novel
fea-tures based on Quadrature Mirror Filters (QMF) were proposed in [9]. These features were used with a two stage hierarchy of nonlinear SVM. The first stage clas-sified the image as portrait or landscape and the second stage further classified landscape as 0 or 180 degrees and the portrait as 90 or 270 degrees. Scalable boost-ing-based approach has been invented by Google re-searcher in [10]. In [11], a large scale performance evaluation for image reorientation problem using dif-ferent features and color spaces have been proposed to identify most useful ones. SVM have been trained for different subsets of the features and their performance comparisons were presented. In [12], pre-classification into known categories have been presented before orientation detection. The four categories considered were close-ups and wide views of natural and artificial (man-made) things, giving a total of 4 categories. How-ever, the categorization is not enough contextually and more specific categorization should be considered for the consumer applications.
3. The Proposed DCM Framework
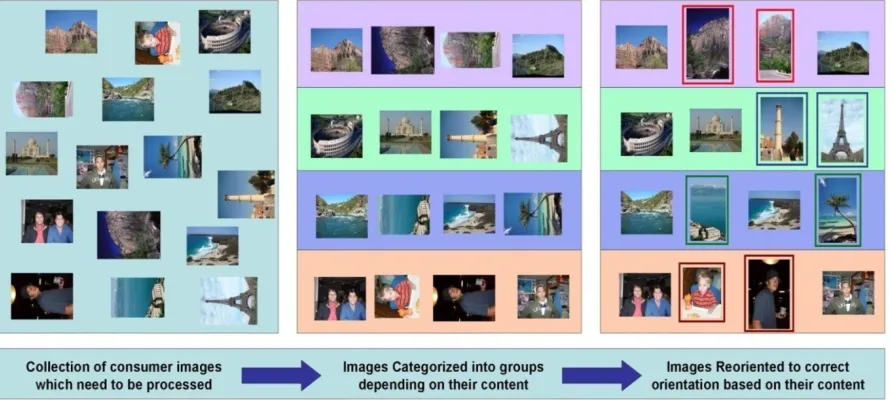
The proposed DCM framework is first categorization and then category specific orientation detection as articulated in Figure 1 with some example images. In the following
sections we describe the features and machine learning approaches used for the stated problem.
3.1. Image Categorization
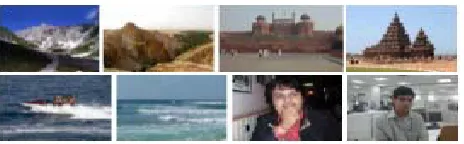
[image:2.595.78.524.491.691.2]We categorize images into four classes namely Moun- tains, Monuments/Building/Architecture, Waterbodies, and Portraits. Figure 2 shows examples of the images
Figure 2. Example images from the four categories.
from the database. Portraits images are those images where human faces are prominent.
3.1.1. Low Level Color Correlogram Features
We solve the categorization problem with color correlo-gram features and SVM. For any pixel, the color corre-logram gives the probability of a pixel at a distance k
away to be of certain color. To be precise, pick any pixel
p1 of color Ci in the image I, at distance k away from p1 pick another pixel p2, the probability that p2 is of certain color Cj can be defined by color correlogram feature.
Color correlogram features are defined as [13]
1 2 1 2
i j i j
k
C ,C Pr p p k , p I , pC IC
(1)
We use the dynamic programming algorithm given in [13] to compute the color correlogram feature for the given image.
First we compute the following two quantities:
I 0c
c ,h
x ,y k x i, y | i k
I 0c
c ,v
x ,y k x, y j | j k
(2)
Here are the counts of the number of pixels of a given color within a given distance from a fixed pixel in the positive horizontal and vertical directions. Then ig-noring boundaries, the un-normalized correlogram is computed as
1
1
Γ 2 2
2 2 2 2
j ,h j ,h
i j Ci
j ,v j ,v
c c
k
c ,c x ,y I x k ,y k x k ,y k
c c
x k ,y k x k ,y k
I k k
k k
(3)
Then finally the correlogram is computed as
c
Γ
8
i j i j
i
k ,c k
c ,c
c
I I
h I k
(4) The choice of color correlogram as a feature was mo-tivated by two factors: (a) the input images may be ro-tated by multiples of 90 degrees and color correlogram is rotation invariant; and (b) images are expected to be col-or images and colcol-or distribution (global and spatially relative) is definitely a good discriminator for the differ-ent classes. While a histogram feature also captures color information from an image, it loses all the spatial infor-mation. Color correlogram feature captures the spatial
(relative) correlation of colors while enabling efficient computation. It has been proposed and used for image indexing and retrieval [13]. We show that the feature along with a suitable classifier can be used for image categorization giving good results.
3.1.2. Color Codebook Formation
The color correlogram features are of dimension d × d × c were d is the distance parameter and c is the number of
colors in the image. To obtain a decent length of feature vector with good compromise between vector length and discrimination power, the color space has to be quantized and the image has to be downscaled in the color space. To quantize the color space, the simplest method is stan-dard downscaling using uniform bin quantization. How-ever, uniform bin quantization assumes a uniform distri-bution of colors in the database images. Since the images are not random but constrained to be consumer images, the distribution of the colors in the images is expected to be a complex multimodal distribution instead of a simple uniform distribution. To capture the modes of the distri-bution we opted to sample pixels from the database im-ages and then to form the codebook for quantization. We use the pixel samples and perform K-means clustering to
find the representative codebook vectors. These vectors are then used for downscaling the images by assigning each image pixel to the nearest codebook vector based on the Euclidean distance.
3.1.3. Support Vector Machines (SVM)
Once the images are represented with color correlogram vectors, we use support vector machines (SVM) [14] for categorization of the vectors into 4 classes. SVM are statistical classifiers which, given training instance-label
pairs
n
1 1
i i i i
x , y ,x R , y , , solve the following
optimization problem,
1
1 2
l T
i ,b ,
i
min C
Subject to
T
1 0i i i , i ,
y x b (5)
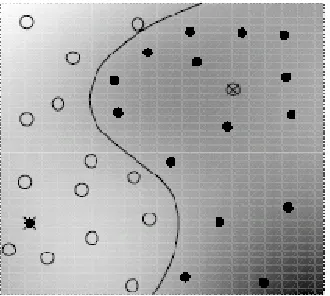
SVM finds a separating hyper plane, in the φ(.) space which is induced high dimensional space, having the maximum margin [15] and has got proven generalization capability. Figure 3 is the toy classification problem and
separating hyper plane in 2D space. Samples on the mar-gin are called support vectors.
We train one-vs-all SVM classifier on the training data.
We have used the kernel SVM with radial basis function as a kernel. RBF kernels are described as
2
0
T
i j i i i j
K x , x x x exp x x , . (6)
Figure 3. Example problem solved with linear SVM.
point:
2
1 m
i i
i
f x
exp xx b (7)Using the RBF kernel each data point is mapped as ar-ticulated in the Figure 4 below:
Example classification boundary generated by the RBF kernel classifier is shown in Figure 5 below.
The cost parameter C and the kernel parameter
[image:4.595.79.269.430.510.2]were optimized using cross validation. We have used libSVM [15] for the target implementation.
Figure 4. Mapping data points using the RBF kernel func-tion.
Figure 5. Example classification boundary generated by RBF kernel SVM.
3.1.4. Image Categorization Algorithm
Given a new image the categorization system works as follows. First, the image is rescaled to a smaller size so that the computation time can be saved. We have per-formed various experimentations by downscaling images to 640*480 and 320*240 resolution.
However, with 320*240 downscaling we have found that there is only marginal drop in the classification ac-curacy and that can be covered by tuning the SVM train-ing parameters. While there is almost four times drop in the computation time and complexity of the feature ex-traction algorithm. Considering these computations, we have downscaled every image to 320*240 resolution during training and testing time. Then the image is also downscaled in color dimension to lower number of col-ors using the codebook of colcol-ors formed by K-means
clustering of database pixel samples explained above in II.A.2. Once the image is downscaled to smaller number of colors, an indexed image is formed containing the pixel-to-codebook color index information. The color correlogram is then computed on this indexed image. The color correlogram is rotation invariant, i.e., it is the same
for any of the four orientation of the image on which it is being calculated. The correlogram is then used as input to the SVM model trained offline using the training da-taset. The SVM returns the label of the category to which the image belongs. The category corresponding to the label is then given as the output of the system. Algo-rithm 1 below gives the steps of the computation.
3.2. Image Orientation Detection
Once the images are categorized into four categories, we proceed to detect the correct orientation based on their content analysis. As our target is embedded and fast run time algorithm is required, we again work with simple low level color and edge features. For the classification task, we have identified the simple classifier combination with Adaboost algorithm.
3.2.1. Feature Extraction
The orientation detection algorithm used is based on the scalable boosting [10]. To suit the implementation over embedded devices and to meet the challenge of time and accuracies, we have optimized the scalable boosting ap-proach. The vanilla version of scalable boosting uses the following feature extraction scheme.
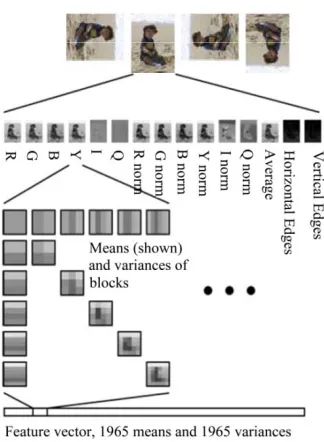
From the original image, 15 simple transformed single channel images are computed as shown in Figure 6:
1-3: R,G,B, channels
4-6: Y,I,Q (transformation of R,G,B image) chan-nels
[image:4.595.91.256.548.696.2]Figure 6. Features calculated for scalable boosting algo-rithm.
10-12: Normalized versions of Y,I,Q channels (li-nearly scaled to span 0-255)
13: Intensity (simple average of R,G,B)
14-15: Horizontal and Vertical edge images, respec-tively, computed from intensity (i.e., gray level) images
For each of these transformed images, the mean and variance of the entire image have been computed. Addi-tionally, mean and variance of square sub-regions of the image have also been computed. The sub regions cover
1 1 1 1
to
2 2 6 6
of the image which gives total of 1
+ 4 + 9 + 16 + 25 + 36 = 91 squares. Also the mean and
variance of vertical and horizontal slices of the image that cover 1/2 to 1/6 of the image have been computed. There are total 2 + 3 + 4 + 5 + 6 = 20 horizontal and 20 vertical slices. Thus there are total of 1965 features
15 91 20 20
for mean and 1965 features for
va-riance gives total features 3930.
However, calculating 3930 dimensional feature vector over 15 channels is computationally heavy for the em-bedded devices. We have optimized at this stage by first computing integral image over each channel [16]. An integral image is calculated by summed area table algo-rithm which quickly and efficiently generates the sum of values in a rectangular subset of a grid. The integral im-age at location x,y contains the sum of the pixels above
and to the left of x,y with x,y inclusive (Figure 7), i.e.,
' '
' ' x x ,y y InI x, y I x , y
(8)where InI x, y
is the integral image and I x', y'
isthe original image.
Using the following pair of recurrences:
1 1
s x, y s x, y I x, y InI x, y InI x , y s x, y
(9)
where s x, y
is the cumulative row sum, s x,
1
0and InI , y
1
0, an integral image can becom-puted. The integral image can be computed in one pass over the original image. From the database images (al-most 7000 in number and scaled down to 640*480 for orientation detection) during training time with scalable boosting the feature extraction time was 36 hours. Using the integral image, this time has been reduced to 3 hours; 12 times reduction compared to the vanilla scalable boosting algorithm.
Another scope for optimization was found in moment (mean and variance) calculation when the images are rotated. Even though the image is rotated still the value of the block remains the same. Hence a mapping was done for a block at location (x,y) to its corresponding
[image:5.595.91.253.308.529.2]position in the rotated image. This saved in recalculation of block mean and variance value of the rotated integral
Figure 7. The value of the integral image at point (x, y).
Algorithm 1: Rotation invariant categorization of input consumer images.
Input: Image with unknown orientation, color codebook built offline, SVM models trained offline
Output: The category of the image, e.g., Moun-tains, Monuments/Building/Architecture, Water bodies, or Portraits, based on the content
1) Downscale the input image in color dimension with re-spect to the codebook learnt offline. This will give an indexed image IIND, whose each pixel will contain the index of the corresponding codebook vector.
2) Form the correlogram using the indexed image. We have used a codebook of size 12 and we have set the distance pa-rameter d = 4 in our model. This gives us a vector of size 12 × 12 × 4 = 576 dimensions.
3) Use the SVM model to obtain the label of the category to which the vector belongs to. Output the category corres-ponding to the label returned by the SVM.
image. This has further helped to reduce the feature ex-traction time during training and testing.
3.2.2. Scalable Boosting Classifier
Scalable boosting makes use of simple weak classifiers strategically combined with Adaboost algorithm to craft the final strong classifier. It uses the output of a simple binary comparison between two of the features described in the previous sub section as the weak classifier. Two simple Boolean operators (and their inverses) are used:
1) featurei > featurej
2) Difference of features within 25% of featurei:
0 25
i j
i feature feature
. feature
Vanilla scalable boosting use the difference of features within 5% as well, however, we have found that by per-forming various optimizations, difference of features within 25% difference features are sufficient to achieve the target accuracies with reduction in the time complex-ity. Thus compared to vanilla scalable boosting which has 46334700 (almost 46 Million, 3930 3930 3 ) fea-tures, our implementation has 30889800 (more than 30 Million, 3930 3930 2 ) features. Still this is extremely large number of weak classifiers to consider.
The main steps of the Adaboost algorithm are shown in
Figure 8 [17]. At every iteration, Adaboost selects the
best weak classifier for the weighted errors of the pre-vious step. The weight changes in Step 4 are such that the weak classifier picked in Step 3 would have an error of 0.5 on the newly weighted samples, so it will not be picked again at the next iteration. Once all the weak classifiers are selected, they are combined to form a strong classifier by a weighted sum, where the weights are related to the re-weighting factors that were applied in Step 4.
Computing the accuracies of all the weak classifiers at each iteration is time-consuming, though it affects only the training time and not the runtime, computing all the features will be very prohibitive. To reduce the training time, we have randomly selected which weak classifiers will be evaluated at each iteration, and select the new classifier from only those that were evaluated.
At each iteration, the set of classifiers to be evaluated is randomly chosen again. Because of practical resource considerations during training, we have limited the num-ber of weak classifiers examined in each iteration. We have experimented with 10000 to 50000 features at each iterations with the step size of 5000. This has varied training time for each AdaBoost classifier to approx-imately 1-3 days. In the final system, to meet the time- accuracy trade-off, we have adopted to use the strong classifiers generated by 30000 classifiers evaluation at each iteration of AdaBoost. Along with this setting of scalable boosting classifier, we have taken optimization steps described in the sub section III.B.1 above.
3.2.3. Image Orientation Detection Algorithm
We have optimized the scalable boosting algorithm as described in the above sections and weights for the com-bination of weak classifiers are learnt offline. Thus we have the weak classifiers and their weights learnt from offline training of the model. With a new image coming in, we use the features extracted to compute the response of the weak classifiers and combine the weighted res-ponses to form the final response. This response is ob-tained for all 4 rotations of the image. The rotation with the maximum response is taken to be the correct rotation of the image and is given as the output to the user.
Algorithm 2 enumerates the steps for orientation
de-tection using Scalable Boosting.
4. Computational Experiments
The proposed system has been tested on a database of over 7000 consumer images collected from the internet and personal image collections by an independent testing team. For the purpose of calculating the error rates and system testing we have divided database into ten disjoint sets with uniform distribution of classes and then per-formed tenfold cross validation. In the tenfold cross va-lidation, each set is once used for the testing and training has to be performed by the remaining nine sets. This gives opportunity to each set for appearing in the training set for nine times and in testing set for once. We have chosen tenfold cross validation as it is most widely used and reported in the various statistical analyses of models [18]. The reported accuracies are average over tenfold runs.
All the 7000 images are ground truth edited, i.e.,
cate-gorized in the appropriate categories by an independent testing team. For the orientation detection experiments, we have rotated each of the images into four orientations, thus our orientation detection database is of the size of almost 28000 images.
For all the experiments we have used Intel Pentium IV with 3.2 GHz processor and 1 GB of RAM. We have used C++ programming architecture over Ubuntu re-lease 8.10, Linux kernel 2.6.27-7 with GNOME 2.24.1. All the algorithms have been finally ported on the target system with Fedora Linux and the CPU of 1 GHz Intel with 256 MB of RAM.
4.1. Categorization Results
As described in Algorithm 1 and Section 3.1, for the ca-tegorization experiments we have color correlogram fea-tures with SVM classifier. We have trained SVM (one-
vs-all framework) with normalized color correlogram features extracted from images in the training dataset randomly rotated to any of the four directions {0o, 90o, 180o, 270o}. The correlogram was normalized such that sum of the features were 100. The parameters of the SVM were optimized by cross validation during training. Parameter optimization of SVM has taken around 24 hours and then with the optimized parameters SVM training took around 2 hours. The dataset used for the cross validation to optimize the SVM parameters is the training set only; no testing sets were used for the para-meter optimization. To claim that the proposed image categorization algorithm is independent of the orientation, we present the testing results with all four orientations,
i.e., after training we have rotated testing images to all
the four orientations and checked the performance. Table I below gives the confusion matrices for the categoriza-tion task with all four orientacategoriza-tions. In Table 1 predicted
classes are arranged in a row.
The overall performance of the method is 92.80% for the images rotated by 0o, 92.40% for the images rotated by 90o, 93.24% for the images rotated by 180o, and 92.71% for the images rotated by 270o. Computational experiments show that the difference in accuracies with all the four orientations is less than 1%. The overall per-formance of the proposed categorization system irrespec-tive of the orientation of images is 92.78%.
The performance of Water bodies class is distributed over those images where water bodies have been found with mountains and monuments photographs. For exam-ple, see Figure 9 where both the images have ground
truth Water bodies, however, they can be equally ac-cepted as Mountains or Monuments/Building/Architecture. This improves our contextual categorization, i.e.,
catego-rization by human perception.
The proposed categorization system module has taken almost 210 mSec for categorizing one image to its re-spective class. This includes image downscaling, code-book formation, color correlogram feature extraction, and final categorization by SVM.
4.2. Orientation Detection Results
As described in Section 3.2, we have adopted our pro-posed scalable boosting algorithm for orientation detec-tion in each class. Parameters for the scalable boosting have been trained offline and ported to the system for the system testing. The parameters obtained from the scala-ble boosting are features to be used and their weights. Only features learned during the training phase have been extracted during runtime to obtain the best timing performance.
For the orientation detection experiments we have ro-tated all the images to four orientations giving total of
Algorithm 2: Orientation detection of images based on content using the proposed optimized Scalable Boosting.
Input: Input image with unknown orientation, weak classifiers learnt offline using op-timized scalable boosting
Output: The correct orientation of the image based on the content
1) Obtain the following images: R,G,B, R normalized, G nor-malized, B nornor-malized, Y,I,Q, Y nornor-malized, I nornor-malized, Q normalized, Horizontal edge image and Vertical edge image
(using the Sobel operator).
2) Extract moments (mean and variance) on blocks and strips of image regions from these 15 images and use them as the features. Figure 4 illustrates the feature extraction process.
3) Compute the response as the weighted combination of res-ponses of the weak classifiers.
Table 1. Confusion matrices for the categorization.
Rotated by 0o Mountains Monuments Water Bodies Portraits
Mountains 93.648649 4.234234 1.936937 0.180180 Monuments 0.275482 99.559229 0.055096 0.110193
Water Bodies 4.714202 8.839128 85.9128 0.471420
Portraits 0.151515 7.575758 0.151515 92.121212 Rotated by 90o
Mountains 90.045045 3.918919 5.765766 0.270270 Monuments 0.991736 98.181818 0.771350 0.055096
Water Bodies 7.012375 5.067767 87.684148 0.235710
Portraits 0.303030 5.984848 0 93.712121
Rotated by 180o
Mountains 94.774775 3.693694 1.486486 0.045045
Monuments 0.385675 99.559229 0.055096 0
Water Bodies 5.715969 7.778433 85.798468 0.707130
Portraits 0.227273 6.742424 0.151515 92.878788 Rotated by 270o
Mountains 94.909910 3.063063 1.936937 0.090090 Monuments 1.432507 98.016529 0.220386 0.330579
Water Bodies 11.019446 4.773129 83.794932 0.412493
Portraits 0.454545 5.151515 0.227273 94.166667
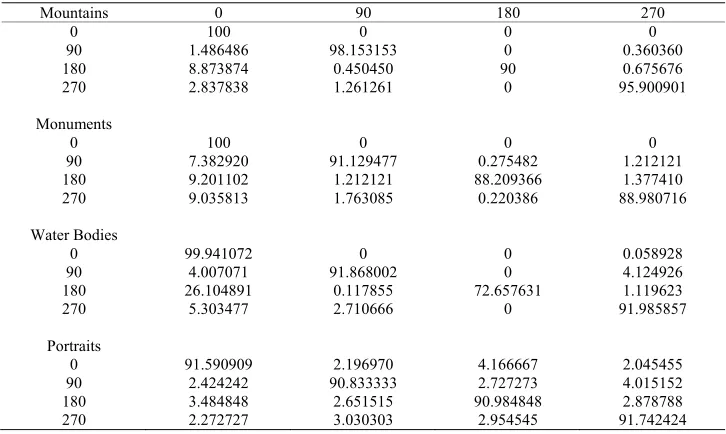
(a) (b)
Figure 9. Ambiguous images; (a) an image which can be accepted as either Water Bodies or Mountains and (b) an image which can be accepted as either Monument/Building/Architecture or Water Bodies.
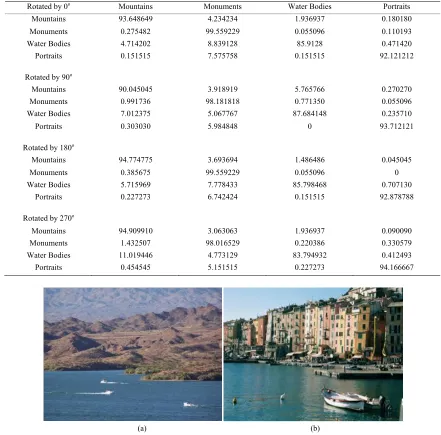
40000 images (nearly 10000 images for each class). We have adopted ten fold cross validation here as well and results reported are average of all the runs. This is re-peated ten times and the results are averaged. The overall performance of the proposed method for orientation de-tection is 96.01% for Mountain class, 92.07% for the Mounments/Building/Architecture class, 89.10% for Wa-terbodies class, and 91.28% for Portrait class. Table 2
below gives the confusion matrices for the orientation detection task with all four orientations. Here predicted classes are arranged in a row.
The proposed orientation detection system module has
taken almost 63 mSec for categorizing one image to its respective class. This includes orientation of image to four directions and obtaining scalable boosting estima-tion of their orientaestima-tion.
4.3. Coupled System (Categorization and Orientation)
[image:8.595.75.518.105.537.2]Table 2. Confusion matrices for the orientation detection.
Mountains 0 90 180 270
0 100 0 0 0
90 1.486486 98.153153 0 0.360360
180 8.873874 0.450450 90 0.675676
270 2.837838 1.261261 0 95.900901
Monuments
0 100 0 0 0
90 7.382920 91.129477 0.275482 1.212121
180 9.201102 1.212121 88.209366 1.377410
270 9.035813 1.763085 0.220386 88.980716
Water Bodies
0 99.941072 0 0 0.058928
90 4.007071 91.868002 0 4.124926
180 26.104891 0.117855 72.657631 1.119623
270 5.303477 2.710666 0 91.985857
Portraits
0 91.590909 2.196970 4.166667 2.045455
90 2.424242 90.833333 2.727273 4.015152
180 3.484848 2.651515 90.984848 2.878788
270 2.272727 3.030303 2.954545 91.742424
cific scalable boosting to detect and correct their orienta-tions. The system accuracy has been found to be 85.46% with average time taken for categorization and orienta-tion detecorienta-tion of single image was almost 300 mSec. This time includes the correction of orientation of image if it is found to be other than 0o.
We have adopted to tag these images by their respec-tive category by adding the metadata information in the EXIF (Exchangeable Image File) format of JPEG images. Images with incorrect orientations have been redirected to the 0o. From the second page onwards, start from the top of the page in a single column format. The JILSA header and authors’ information from page one are not displayed. Do not insert include any header, footer or page number. JILSA editors will include the page num-ber, authors’ initials and the article number.
5. Conclusions and Further Research
In this paper, we have proposed the digital content man-agement solution which is computationally less complex to result high time performance over embedded system and having better accuracy for categorization and orien-tation detection for general consumer images. The present system achieves 93.24% for rotation invariant categori-zation for 4 classes. When compared to scene categoriza-tion method of [19], we achieve a performance of 93.24% on 4 categories, while they achieve 89% on 4 categories (forest, mountains, country, and coast). In addition to the higher accuracy, the categories chosen by us are more general from consumer perspective and we make use of simple low level features for reducing time complexity. For example, Country category considered by [19] is of no
use in consumer scenarios and they have not considered the Portrait class which is the most common class of consumer images.
Compared to the best performance of image orienta-tion detecorienta-tion 79.1% reported in [14], we achieve 96.01% for orientation detection for Mountain class, 92.07% for Monuments class, 89.10% for Water bodies, and 91.28% for the portrait class. Further, database used in [11] was simple and taken from Corel collection containing scenic shots, tourist, and people shots. We are able to achieve best accuracies than [14] by first categorizing the images into more homogeneous categories and then training the algorithm independently on each category. The overall accuracy of the proposed system is 85.46%, which is higher than the one reported in [11].
The proposed system has been developed to run on embedded platform with limited computing resources. This restriction did not allow us to compute higher com-plexity SIFT features [1], and we have investigated some low level features combined with strong optimized ma-chine learning algorithms to achieve the presented accu-racies and timing performance.
The DCM (Digital Content Management) applications developed in addition to the proposed core algorithms for categorization and orientation detection form an impor-tant part of the product.
cluster-ing, similar scene detection, blur detection, and mapping image colors with music mood selection for album play along with the proposed categorization and orientation detection solutions bring pattern recognition-based con-sumer electronic products to the end users. To the best of our knowledge accuracies reported by us are best known in the literature and the proposed is the first of its kind product presenting a comprehensive DCM solution to the consumer electronics.
REFERENCES
[1] D. G. Lowe, “Distinctive Image Features from Scale-Invariant Keypoints,” International Journal on Computer Vision, Vol. 60, No. 2, 2004, pp. 91-110. doi:10.1023/B:VISI. 0000029664.99615.94
[2] J. Willamowski, D. Arregui, G. Csurka, C. R. Dance and L. Fan, “Categorizing Nine Visual Classes Using Local Ap-pearance Descriptors,” International Conference on Pat-tern Recognition, Cambridge, 2004.
[3] L. Fei-Fei and P. Perona, “A Bayesian Hierarchical Model for Learning Natural Scene Categories,” IEEE Computer Society Conference on Computer Vision and Pattern Rec-ognition, San Diego, 20-25 June 2005, pp. 524-531. [4] S. Lazebnik, C. Schmid and J. Ponce, “Beyond Bags of
Features: Spatial Pyramid Matching for Recognizing Nat-ural Scene Categories,” Proceedings of Computer Vision
and Pattern Recognition, IEEE, New York, 2006, pp.
2169-2178.
[5] A. Vailaya, H.-J. Zhang, C. Yang, F.-I. Liu and A. K. Jain, “Automatic Image Orientation Detection,” IEEE Transac-tions on Image Processing, Vol. 11, No. 7, 2002, pp. 746-755. doi:10.1109/TIP.2002.801590
[6] Y. Wang and H. Zhang, “Content-Based Image Orienta-tion DetecOrienta-tion with Support Vector Machines,” Proceed-ings of IEEE Workshop on Content-Based Access of Image and Video Libraries, IEEE, New York, 2001, pp. 17-23. doi:10.1109/IVL.2001.990851
[7] Y. M. Wang and H.-J. Zhang, “Detecting Image Orienta-tion Based on Low-Level Visual Content,” Computer Vi-sion and Image Understanding, Vol. 93, No. 3, 2004, pp.
328-346.doi:10.1016/j.cviu.2003.10.006
[8] E. Tolstaya, “Content-Based Image Orientation Recogni-tion,” GraphiCon, Moscow, 2007.
[9] S. Lyu, “Automatic Image Orientation Detection with Natural Image Statistics,” Proceedings of 13th
Internation-al Multimedia Conference, Singapore, 6-11 November
2005, pp. 491-494.doi:10.1145/1101149.1101259 [10]S. Baluja, “Automated Image-Orientation Detection: A
Scalable Boosting Approach,” Pattern Analysis and Ap-plications, Vol. 10, No. 3, 2007, pp. 247-263. doi:10.
1007/s10044-006-0059-1
[11]S. Baluja and H. A. Rowley, “Large Scale Performance Measurement of Content-Based Automated Image- Orientation Detection,” Proceedings of International
Conference on Image Processing, Vol. 2, 2005, pp.
514-517.
[12]H. L. Borgne and N. E. Oconnor, “Pre-Classification for Automatic Image Orientation,” Proceedings of IEEE In-ternational Conference on Acoustics, Speech, and Signal Processing, Tou Louse, 14-19 May 2006, pp. 125-128.
doi:10.1109/ICASSP.2006. 1660295
[13]J. Huang, S. R. Kumar, M. Mitra, W.-J. Zhu and R. Zabih, “Image Indexing Using Color Correlograms,” IEEE Computer Vision and Pattern Recognition, San Juan, 1997,
pp. 762-768.
[14]B. Scholkopf and A. J. Smola, “Learning with Kernels: Support Vector Machines, Regularization, Optimization, and Beyond,” The MIT Press, Cambridge, 2001.
[15]C.-C. Chang and C.-J. Lin, “LIBSVM: A Library for Support Vector Machines,” 2001. http://www.csie,ntu.edu. tw/~cjlin/libsvm
[16]F. Crow, “Summed Area Tables for Texture Mapping,”
Proceedings of Special Interest Group in Graphics, ACM,
Minneapolis, 1984, pp. 207-212.
[17]Y. Freund and R. E. Schapire, “A Short Introduction to Boosting,” Journal of Japanese Society of Artificial Intel-ligence, Vol. 14, No. 5, 1999, pp. 771-780.
[18]R. Kohavi, “A Study of Cross-Validation and Bootstrap for Accuracy Estimation and Model Selection,” Proceed-ings of 15th International Joint Conference on Artificial Intelligence, Nagoya, 23-29 August 1997, pp. 1137-1143.
[19]A. Oliva and A. Toralba, “Modeling the Shape of the Scene : A Holistic Representation of the Spatial Envelope,”
International Journal on Computer Vision, Vol. 42, No. 3,