Abstract—The paper gives the results of the project that is oriented on the usage of knowledge discoveries from production systems. Knowledge discoveries were used in the management of these systems. The simulation models of manufacturing systems were developed to obtain the necessary data about production. Data mining model was created by using of the specific methods and selected techniques for defined problems of the production system management. The new knowledge was applied to the production management system. Gained knowledge was tested on simulation models of the production system. The important benefit of the project was the proposal of the new procedure. This procedure generalizes the designed stages by using of the gained knowledge from production data.
Index Terms—data mining, flexible manufacturing systems, management of production system, simulation model
I. INTRODUCTION
HE process of knowledge discovery in databases, often also called data mining, is the first important step in the knowledge management technology. End users of these tools and systems are on all levels of management operative workers and managers. And these are their demands on the processing and analysis of data and information that affect the development of these tools. The most important feature from all of the advantages of these instruments is multidimensionality, possibility to monitor and analyze problems from several points of view simultaneously, based on the needs of management tasks [1].
Manuscript received June 22, 2012; revised July 24, 2012.
This work was written with a financial support VEGA agency in the frame of the project 1/0214/11 „The data mining usage in manufacturing systems control“.
Pavol Tanuska is with the Slovak University of Technology in Bratislava, Faculty of Materials Science and Technology in Trnava, Institute of Applied Informatics, Automation and Mathematics, Hajdoczyho 1, Trnava 917 24, Slovakia (corresponding author, phone: +421–918–646–061; e-mail: [email protected]).
Pavel Vazan is with the Slovak University of Technology in Bratislava, Faculty of Materials Science and Technology in Trnava, Institute of Applied Informatics, Automation and Mathematics, Hajdoczyho 1, Trnava 917 24, Slovakia (e-mail: [email protected]).
Michal Kebisek is with the Slovak University of Technology in Bratislava, Faculty of Materials Science and Technology in Trnava, Institute of Applied Informatics, Automation and Mathematics, Hajdoczyho 1, Trnava 917 24, Slovakia (e-mail: [email protected]).
Milan Strbo is with the Slovak University of Technology in Bratislava, Faculty of Materials Science and Technology in Trnava, Institute of Applied Informatics, Automation and Mathematics, Hajdoczyho 1, Trnava 917 24, Slovakia (e-mail: [email protected]).
The production process control is an activity which needs a perfect knowledge of environment and all activities related with the production process. It is called the controlling of knowledge or knowledge control system. The production management has to ensure the achievement of different production goals in a given time frame. These objectives are often conflicting and their achievement depends on many factors. Many dependencies are so far very little explored, for example relationship of the capacity utilization and value of lead time depending on the size of the production batch. The problem of minimizing variable costs depends on the necessary operating supplies possession, alternatively with the possibility of increasing the value added percentage parameter (metric according to Lean Production). There are also few problems that are very little investigated like the impact of priority rules for allocating the operations on the production goals. These problems and dependencies would be possible to solve by using data mining methods [2].
II. SIMULATION MODEL OF FLEXIBLE MANUFACTURING
SYSTEM
The authors designed several simulation models of typical flexible manufacturing systems (FMS) in the frame of the researched project. The designed simulation models are used as the generators of important data about the run of the production process and the reached production objectives in the first stage of the project. Our solution will be demonstrated on the selected FMS in this paper.
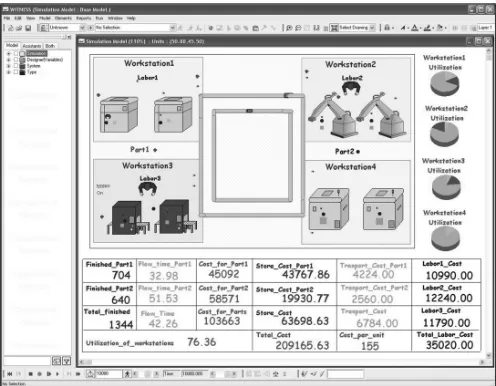
The FMS consists of four relatively independent workstations (Fig. 1). These workstations were partly interchangeable with one another. Given manufacturing system has been designed to produce three kinds of parts at the same time. It means that the lot sizes of parts were the input variables of the simulation model. The parts were produced in batches. The dynamic schedule of operations was generated for each produced type of the part according to the immediate state of the FMS. The designed simulation models of the production system generate all important data during the simulation run about the production process. These data need to be collected appropriately and stored for further analyses. The relational database, as a particular step, was designed to data storage from the production process. It is possible to use a data warehouse as an alternative storage. This stored data can be used as an input data source for the further analyses in data mining tools [3].
The Procedure Proposal of Manufacturing
Systems Management by Using of Gained
Knowledge from Production Data
Pavol Tanuska
Member IAENG
, Pavel Vazan, Michal Kebisek, Milan Strbo
III. THE DEFINITION OF DATA MINING GOALS
The process application of knowledge discovery in databases was oriented to the following goals:
1) The analysis of manufacturing process parameters influence on the capacity utilization,
2) The analysis of manufacturing process parameters influence on the flow times of production batches, 3) The analysis of manufacturing process parameters
influence on the number of finished parts.
IV. USED DATA MINING METHODS AND TECHNIQUES
We decided to use the following data mining methods and techniques based on the previous defined data mining goals: 1) Automated Neural Network Regression,
2) Automated Neural Network Classification, 3) Generalized K-Means Cluster Analysis,
4) Generalized EM (Expectation Maximization) Cluster Analysis,
5) Generalized Additive Models,
6) Standard Classification and Regression Trees,
7) Standard Regression CHAID (Chi-square Automatic Interaction Detection),
8) MARSplines (Multivariate Adaptive Regression Splines),
9) SVM (Support Vector Machines).
A. Neural Networks
Neural networks are data models which simulate the human brain structure. They consist of a number of elementary processing units, called neurons. A neuron receives a number of inputs. Each input line has the connection strength, known as weight. The connection strength of a line can be excitatory (positive weight) or inhibitory (negative weight). In addition, a neural is given a constant bias input of unity trough the bias weight. Two operations are performed by the neuron – the summation and output computation.
Neural networks learn themselves from the set of input data. Then they tune up the parameters of their neurons (like human brain). Modern prediction techniques allow to create the models with excellent variability and they easy modify
their projections.
Neural networks are useful for variable problems forecasting when the data are considerably non-linear [4].
Neural networks have better results towards standard technologies regarding the noise disability data.
B. Cluster Analysis
This method is based on the principle that the data are divided into a finite number of clusters (groups). The values of elements that belong to one cluster are very similar. On the other hand the elements values of different clusters are relatively divers. It is possible that the clusters are overlapping. We do not known how many groups will arise and which attributes will segment data. It means that the analyst has to define the significance to each cluster [2].
Clustering is usually the first step in the data mining process. It identifies the groups of related records which are used to discover other dependences. The records typically have a large number of attributes and are divided into relatively small number of groups. An example of the clustering usage can be a subgroup analysis of the production system parameters set.
C. Classification and Regression Trees
Classification and regression trees are the symbolic technique using a simple form. The created model, based on this technique, is easy and understandable for the user. The objective of modeling is the tree creating structure, in this case. The root and internal nodes of the tree represent a test of some predictive attribute, edges represent the output of the tests (possible attribute values) and the leaves represent the classes. The resulting knowledge is represented by the paths from the root of the decision tree to its leaves.
Regression trees allow estimating the value of a numeric attributes. The leaves nodes of regression trees have a specific value (constant) instead of the class name. This value corresponds to the average value of the target attribute for the given node. The algorithm for the regression tree proposal is similar to the algorithm TDIDT (Top Down Induction of Decision Tress) that is usually used for a classification tree.
The aim is to predict values of a categorically dependent variable (class, group membership, etc.) from one or more continuous and/or categorical predictor variables by using classification-type problems [5].
D. MARSplines (Multivariate Adaptive Regression
Splines)
Multivariate Adaptive Regression Splines (MARSplines) is an implementation of techniques for solving regression type problems with the main purpose to predict the values of a continuous dependent or outcome variable from a set of dependent or independent variables. There is a large number of methods available for fitting models to continuous variables such as a linear regression, nonlinear regression, regression trees, CHAID, neural networks, etc. [6].
E. SVM (Support Vector Machines)
[image:2.595.49.297.50.243.2]SVM is a classification method that precisely formalizes what neural networks solve implicitly. The appropriate transformation convert method is used in the creation of
class classification tasks. The classes that are not linearly separable are transformed into the linearly separable classification classes. There are created the transformed attributes instead of the original attributes. Data transformation presents increasing of the dimension, but we are solving an easier task. In a new space, we are looking for a dividing hyperplane that has the maximal margin from the transformed examples of the training set. The selected elements of the training set that are the nearest to the required border between classes are crucial for finding of the dividing hyperplane [2].
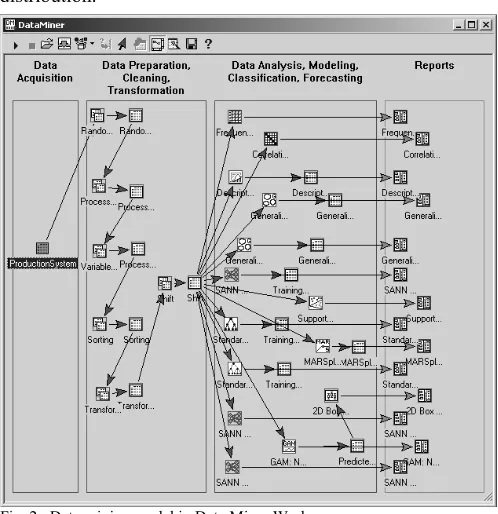
V. PROPOSED MODEL IN DATA MINER TOOL
We applied the selected data mining methods and techniques in the data mining tool STATISTICA Data Miner. The proposal of data mining model (Fig. 2) was realized in the following three steps:
1) The selection of data set that will serve as an input set into a data mining process,
2) The modification and transformation of selected data set,
3) The selection, definition and modification of required parameters of particular data mining techniques. The data set was already selected from the modified and transformed set. It was realized in the preliminary phase. In the proposed model, we used the possibilities of our model and we tested data on missing values and on the value distribution.
We performed the next identification of data extreme values, modified and organized data and at the end we performed the final transformation.
The adjusted and transformed data set was used as the input set into the data mining process.
Having finished the creation of data mining model we initiated the lone data mining process. The output reports for each used data mining methods and techniques were created step by step during this process. These obtained output
reports were stored into the application workbook for next more detailed analyses.
[image:3.595.307.555.78.260.2]The partial output reports were composed from the text or numerical outputs in the form of summary information about process in a particular method, graphical output in the form of graphs – for example histograms (Fig. 3), mean plot (Fig. 4), SixGraph X-bar and R Chart (Fig 5), box and whisker graph, etc. The format and type of relevant output reports depended on the specific data mining method and technique.
Fig. 2. Data mining model in Data Miner Workspace.
Fig. 3. Data retrieved histogram of capacity utilization in relation of lot size.
[image:3.595.47.296.408.665.2]Fig. 4. Data retrieved mean plot of capacity utilization in relation of lot size.
[image:3.595.304.552.577.752.2]VI. THE EVALUATION OF THE GAINED KNOWLEDGE
The defined goals were evaluated individually according to the gained results that we obtained by using data mining methods and techniques. The gained knowledge is following:
A. The analysis of manufacturing process parameters
influence on the capacity utilization
The results analysis of the created data mining model gave very detail knowledge. We can formulate general knowledge that greater lot sizes lead to higher capacity utilization. Of course, the lot sizes of batches require very accurate setting for the individual production system. The lot sizes of batches for presented FMS are:
1) The lot size for the first product is 6 pieces, 2) The lot size for the second product is 4 pieces, 3) The lot size for the third product is 5 pieces.
B. The analysis of manufacturing process parameters
influence on the flow times of production batches
There was prepared the special data mining model for the analysis of individual flow times of observed products. We can formulate the following knowledge for the control strategy that is oriented towards the minimization of flow time on the base of the obtained results. Smaller lot sizes of batches lead to shorter flow times. The following lot sizes are needed to set up the presented FMS to minimize flow time:
1) The lot size for the first product is 1 piece, 2) The lot size for the second product is 2 pieces, 3) The lot size for the third product is 2 pieces.
C. The analysis of manufacturing process parameters
influence on the number of finished parts
We can define the following knowledge according to the results of the third data mining model that was oriented towards the increasing of the finished parts number. If the control strategy is oriented towards the increasing number of finished parts, it will have to set up the lot sizes of batches to greater values. The following lot sizes are needed to set up the presented FMS to maximize the number of finished parts:
1) The lot size for the first product is 4 pieces, 2) The lot size for the second product is 5 pieces, 3) The lot size for the third product is 3 pieces.
The validation of gained knowledge was realized on the simulation model of the FMS. We used the simulation optimization for this validation process. We can confirm that the gained knowledge from data mining process for the particular FMS is very accurate.
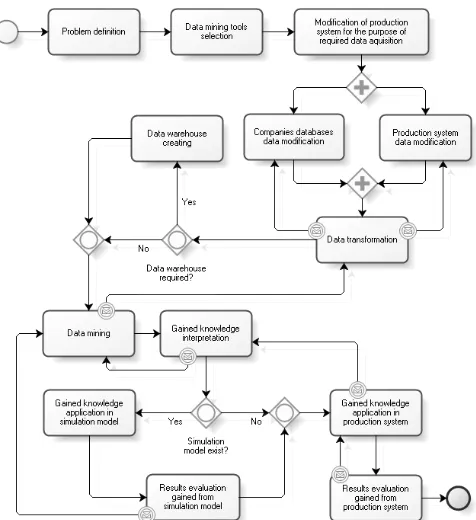
The obtained results from data mining process and their successful validation contribute to the proposal of general procedure. We proposed the procedure for the realization of data mining process to improve the control strategies for FMS (Fig. 6). The proposal defines processes and determines rules, conditions and factors for the decision making process. The procedure was modeled in BPMN (Business Process Modeling Notation).
VII. CONCLUSION
The defined goals were evaluated individually according to the gained results. The discovered knowledge has the influence on the analyzed parameters of the production process, e.g. the flow time, number of finished parts and capacity utilization. The new and more suitable values of lot size were gained by analyzing of reached results. The lot size value is very important input parameter for management strategies of the production system.
The new discovered knowledge was applied to the designed simulation model. The knowledge discovery process from the production system could be validated by this way. We compared the results of production system according to the original management strategy with the results of production system that were gained according to the modified management strategy.
The last stage of our paper was to propose the procedure application process of knowledge discovery in databases in the production systems. The proposed procedure is a generalization of the knowledge discovery process from large amount of data (valuable but usually not used very often) that are available in the given production system. The procedure can also help to identify different requirements and potential problems in a stepwise process which may arise in the production system. The gained knowledge allows to improve or optimize the process control and management on all levels.
REFERENCES
[1] D. Taniar, Data Mining and Knowledge Discovery Technologies. IGI
Publishing, 2008
[2] P. Berka, Knowledge discovering from databases. Academia, 2003
[3] P. Važan, P. Tanuška and M. Kebísek, “The data mining usage in production system management.” In: World Academy of Science,
[image:4.595.309.547.51.311.2]Engineering and Technology. Year 7, Issue 77, 2011, pp. 1304-1308
[4] I. Halenar and M. Elias, “Using Neural Networks to Securing Communications Management Systems.” In: International Workshop “Innovation Information Technologies: Theory and Practice”.
Dresden, Germany, 2010. pp. 36-40
[5] A. Trnka, “Classification and Regression Trees as a Part of Data Mining in Six Sigma Methodology.” In: World Congress on
Engineering and Computer Science. Vol. 1 and 2, 2010, pp. 449-453
[6] T. Hill and P. Lewicki, STATISTICS: Methods and Applications.