Learning Stock Market Sentiment Lexicon and Sentiment-Oriented
Word Vector from StockTwits
Quanzhi Li, Sameena Shah
Research and Development
Thomson Reuters
3 Times Square, New York, NY 10036
{quanzhi.li, sameena.shah@thomsonreuters.com}
Abstract
Previous studies have shown that investor sentiment indicators can predict stock market change. A domain-specific senti-ment lexicon and sentisenti-ment-oriented word embedding model would help the senti-ment analysis in financial domain and stock market. In this paper, we present a new approach to learning stock market lexicon from StockTwits, a popular finan-cial sofinan-cial network for investors to share ideas. It learns word polarity by predicting message sentiment, using a neural net-work. The sentiment-oriented word embeddings are learned from tens of mil-lions of StockTwits posts, and this is the first study presenting sentiment-oriented word embeddings for stock market. The experiments of predicting investor senti-ment show that our lexicon outperformed other lexicons built by the state-of-the-art methods, and the sentiment-oriented word vector was much better than the general word embeddings.
1
Introduction
Social media has provided a rich opinion content that is valuable for diverse decision-making pro-cesses (Montoyo et al., 2012; Oliveira 2016), and sentiment analysis is being increasingly used to predict stock market variables (Antweiler and Frank 2014; Yu eta l., 2013; Schumaker et al., 2012). In particular, social media messages are a useful source for supporting stock market deci-sions (Bollen et al., 2011; Oliveira et al., 2013). Users of social media, such as StockTwits and Twitter, post very frequently, and this makes the real-time assessment possible, which can be exploited during the trading day. The two im-portant sentiment data that can help sentiment
analysis greatly are sentiment lexicons and word embeddings learned from large amount of data. Word embedding (word vector) has been used in many NLP tasks and noticeably improved their performance (Socher et al., 2013; Tang et al., 2014b; Vo and Zhang, 2015; Li et al., 2017). However, there has been little effort in construct-ing sentiment lexicon for financial domain and stock market, and in using social media as the data source. Many terms in financial market have different meanings, especially sentiment polarity, from that in other domains or sources, such as the general news articles and Twitter. For exam-ple, terms long, short, put and call have special meanings in stock market. Another example is the term underestimate, which is a negative term in general, but it can suggest an opportunity to buy equities when is used in stock market mes-sages. Domain independent lexicons or general word embedding model may not perform well in financial domain. Therefore, it is necessary and important to built sentiment lexicons and word embeddings specifically for stock market.
The main contributions of this study are: first, we proposed a new approach based on neural network for constructing a large scale sentiment lexicon for stock market. Second, we built a sen-timent-oriented word embedding (SOWE) model specifically for stock market. To our knowledge, this is the first word embedding model for stock market. The experiment shows that it outper-forms the general embedding models. The lexi-cons and embeddings are available at https://github.com/quanzhili/stocklexicon.
2
Related Studies
There are three approaches to generating a sen-timent lexicon (Liu, 2012; Al-Twairesh et al., 2016): the manual approach, dictionary-based approach, and corpus-based approach. The man-ual approach is usman-ually used in conjunction with automated approaches to check the correction of the resulting lexicons.
The dictionary based method exploits the synonyms and antonyms of a word in dictionary. It usually starts with a small set of seed senti-ment words, and they are looked up in the dic-tionary for their synonyms and antonyms, which are then added to the seed set and a new iteration process starts. Most studies adapting this ap-proach use WordNet with different ways expand-ing the seed list, such as graph-based methods (Rao and Ravichandran, 2009) and distance-based measures (Kamps, 2004; Williams and Anand, 2009). The SentiWordNet lexicon creat-ed by (Esuli and Sebastiani, 2005) is the first im-portant work based on WordNet. SentiWordNet was further expanded by (Esuli and Sebastiani, 2006; Baccianella et al., 2010) later. Bing Liu’s lexicon (Hu and Liu, 2004) is also built using a dictionary based method, in which WordNet is used.
In the corpus-based approaches, the lexicon words are extracted from the corpus. Usually they also start with a set of seed sentiment words, and then expand it by discovering words with opposite or similar sentiment. For example, Turney and Littman (2002) used search engines to find a word’s sentiment. They first compute the association strength between the word and a set of positive words, and then the association strength between the word and a set of negative ones. The strength with positive words minus the strength with negative ones is this word’s sentiment score, which is negative if the result is negative and positive if the result is positive.
Point-wise Mutual Information (PMI) is used to measure the association strength, and it is also used as one baseline method in our study. More details on PMI will be given later. Another ex-ample is the MPQA subjectivity lexicon (Wilson et al., 2005), which was built manually by anno-tating the subjective expressions in the MPQA corpus. As social media became popular, several studies have focused on developing sentiment lexicons from social media data, especially Twit-ter (Tang et al., 2014; Kiritchenko et al., 2014, Vo and Zhang, 2016; Al-Twairesh et al., 2016).
There are very few lexicons built for stock market or financial domain. A financial lexicon was manually built by (Loughran and McDonald, 2011), using documents extracted from the U.S. Securities and Exchange Commission portal from 1994 to 2008. Mao et al. (2014) proposed a procedure to automatically create a financial lex-icon in Chinese, by exploiting a large news cor-pus, whose documents are classified as positive or negative according to the contemporaneous stock returns. Oliveira et al. (2014; 2016) used statistic measures, such as Information Gain (IG), TF.IDF and PMI, to build sentiment lexi-cons from StockTwits messages for stock mar-ket. The TF.IDF and PMI methods are used as two baseline methods in our study. Tang et al. (2014a) use a neural network to learn word embeddings from tweets, and then expand a set of seed sentiment words by measuring the word vector distance between seed words and other words. Vo and Zhang’s approach (2016) is based on a simple neural network, to learn polarity val-ues of a term by optimizing the prediction accu-racy of message sentiment using lexicons. Our proposed approach is compared to this method. Both (Tang et al., 2014a) and (Vo and Zhang, 2016) worked on Twitter data, not stock market data.
Year
Number of StockTwits Messages
Number of Mes-sages with
Sen-timent Label (Bullish or
Bear-ish)
% of Messages with Sentiment
Label
Number of Bullish
Mes-sages
Number of Bearish Messages
Ratio of Bull-ish / BearBull-ish
2010 517,435 20,307 3.92% 17,310 2,997 5.78
2011 1,182,172 62,186 5.26% 46,823 15,363 3.05
2012 2,823,990 128,832 4.56% 95,610 33,222 2.88
2013 6,039,500 784,067 12.98% 609,709 174,358 3.50
2014 10,833,688 2,168,000 20.01% 1,774,647 393,353 4.51
2015 15,390,934 3,253,027 21.14% 2,596,182 656,845 3.95
[image:3.595.71.525.72.246.2]Total 36,787,719 6,416,419 17.44% 5,140,281 1,276,138 4.03
Table 1: Statistics of StockTwits data set. Sentiment labels (bullish or bearish) are provided by mes-sage authors.
3
Learning Sentiment Lexicon and
Sen-timent Oriented Word Embeddings
(SOWE)
In this section, we first describe how we collect-ed the data set from StockTwits and the neces-sary preprocessing steps. The data set was used for both the sentiment lexicon construction and the SOWE model creation. Section 3.2 presents the proposed approach for constructing the lexi-con, and Section 3.3 explains the algorithm used for building the SOWE model.
3.1
Data Collection and Preprocessing
Steps
In this subsection, we describe the StockTwits data set, the basic data preprocessing steps, and how we identify phrases from StockTwits mes-sages.
StockTwits Data Set: StockTwits is a finan-cial sofinan-cial network for sharing ideas among trad-ers. Anyone on StockTwits can contribute con-tent – short messages limited to 140 characters that cover ideas on specific investments. Most messages have a cashtag, which is a stock sym-bol, such as $aapl, to specify the entity (stock) this message is about. We received the permis-sion from StockTwits to access their historical message archive from year 2010 to 2015. We used this data set to build sentiment lexicons and SOWE for stock market and general financial applications.
Similar to Twitter’s tweet, each StockTwits message includes a userId, number of followers,
About 17.44% of the StockTwits messages are labeled as “bullish” or “bearish” by their authors, to show their sentiment toward the mentioned stocks. The rest of them do not have this bull-ish/bearish metadata. Table 1 presents the basic statistics of this data set. This table shows that the total number of messages increased greatly year by year. And we also see that the number of messages labeled as Bullish is much higher than that labeled as Bearish, with an overall ratio of 4.03. In this study, we extracted 6.4 million messages with the Bullish or Bearish sentiment label, and used them as the training data for our lexicon construction and SOWE model creation. Overall, we have about 5.1 million Bullish mes-sages and 1.3 million Bearish messages. Below are some examples of StockTwits messages:
- Love this company long time. $PYPL
- Most bullish stocks during this dip, $GOLD
- Another Sell Rating, Sell Rating for $AXP
- My favorite stock pick #in2010: $GMCR.
- Supermarket Stocks Rally as Tesco Plans to Axe Non-core UK Assets. $MRW
- Long $AMZN Oct $240 Calls
- for the 2009, $AXP was the
$DJIA's best-performing compo-nent, having garnered a 118% gain:
- $f ford has not seen $10 since 9/05, but it’s still a bull, be careful.
Preprocessing Steps: Some preprocessing steps are performed to clean the messages:
- Messages that contain only cashtags, URLs, or mentions are discarded, since they do not have meaningful terms.
- All URLs are removed. Most URLs are short URLs and located at the end of a mes-sage.
- All mentions are converted to a special symbol, for privacy reason. This includes the mentions appearing in a regular message and the user handles at the beginning of a retweet, e.g. ``RT: @bullguy’’.
- All cashtags are replaced by a special sym-bol, to avoid cashtags to gain a polarity val-ue related to a particular time period. - Numbers following +, – or white space, but
not followed by % (e.g. +23.3, +33, -5.52), are converted to a set of special symbols. These symbols reflect the value range of these numbers, and the range of the number determines which symbol it will be convert-ed to. For example, +12.45 => #increase1, +20.22=> #increase2, -21.45=> #decrease2. These numbers are usually about stock price change, and so they bear sentiment infor-mation of the message. Different symbols reflect different degrees of price change. - Similar to the above step, numbers
follow-ing +, – or white space, and also followed by % (e.g. +23.34%, -5.8%), are also con-verted to a set of special symbols. These numbers are usually about price or volume changes. But they are based on percentage, which is different from the numbers dis-cussed in previous step. They also convey important sentiment information.
After passing through the above prepro-cessing steps, the tweets are used to learn the sentiment lexicon and word embedding model.
Phrase Identification: Phrases usually con-vey more specific meaning than single-term words, and many phrases have a meaning that is not a simple composition of the meanings of its individual words. To identify phrases, we use the approach described in (Mikolov et al. 2013). We first find words that appear frequently together, and infrequently in other contexts. For example, “short sell” is identified as a phrase; while a bi-gram “they have” is not. By using this approach, we can form many reasonable phrases without greatly increasing the vocabulary size. To identi-fy phrases, a simple data-driven approach is used, where phrases are formed based on the unigram and bigram counts, using this scoring function:
) ( * ) (
) , ( ) , (
j i
j i j
i
w C w C
w w C w w
Score
(1)Where C (wi, wj) is the frequency of word wi and wj appearing together.
is a discounting [image:4.595.310.524.257.443.2]coeffi-cient to prevent too many phrases consisting of infrequent words to be generated. The bigrams with score above the chosen threshold are then used as phrases. Then the process is repeated a few passes over the training data with decreasing threshold value, so we can identify longer phrases having several words. For the StockTwits data set, we empirically set the max-imum length of a phrase to 4 words in this study. Other parameters are set as the default values used in (Mikolov et al. 2013).
Figure 1: The neural network model for building sentiment lexicon for stock market.
3.2
Sentiment Lexicon Construction
The Proposed Approach: Most corpus-based lexicon construction approaches mainly utilize statistical measures, such as TF-IDF, GI and PMI methods. Our approach is based on a neural net-work model, inspired by the general netnet-work structure for processing NLP tasks (Collobert at al., 2011). Figure 1 shows the neural network we employed for learning the polarity values of a term, by predicting the sentiment value of a StockTwits message. Following (Esuli and Sebastiani, 2006; Vo and Zhang, 2016), we also use two attributes to define the sentiment of a term (word or phrase): positivity and negativity. This means each term has the form of t = (p, n),
where p is the positivity value and n is the nega-tivity value. The value range is from 0 to 1 for both p and n. If the value of p is greater than n,
other, we can say that the term is neutral, bearing little sentiment information.
There are five layers in Figure 1, and from top to bottom, they are: lookup, convolutional, line-ar, HardTanh and linear. Using the message in this figure as an example, the words of this post are the input of this feed-forward neural network. In this example message, we assume there is no phrase identified, so there are four input terms. If there is a phrase, let’s say all-time high is detect-ed as a phrase, then these two words will be treated as one input term. The top layer is the lookup table for term polarity values. Because the training input is message, which varies in length, we use a convolutional layer to extract features that can be fed to standard affine layers. There are different ways to generate the repre-sentation of text segments with different lengths. In this study, we use the concatenation convolu-tional layer, which concatenates the layers of max, min and average of the two polarity values of all terms in the input message. This layer gives the best performance, based on our pilot experiments. The concatenation layer is ex-pressed as follow:
Z(m) = [Zp(m), Zn(m)] (2)
Zp(m) = [Zp,max(m), Zp,min(m), Zp,ave(m)] (3)
Zn(m) = [Zn,max(m), Zn,min(m), Zn,ave(m)] (4)
Where Z(m) is the representation of message m,
Zp(m) is for the positivity values of all the terms
in this message, and Zn(m) is for negativity
val-ues of the terms. Given the convolutional layer, we can get the output of the first linear layer:
(5)
The HardTanh layer:
(6)
And the second linear layer, whose output, , is the sentiment score for input message m:
(7)
Where w1, w2, b1, b2 are the parameters of the
linear layers. The non-linear HardTanh layer is to extract highly non-linear features. Without the HardTanh layer, the network would be a simple linear model. Because the hard version of the hyperbolic tangent is slightly cheaper to compute
and still keep the generalization performance un-changed, it is chosen as the non-linear layer.
The HardTanh(x) function is defined as:
-1, if x <= -1
HardTanh(x) = x, if -1 <= x <= 1 (8) 1, if x > 1
Since we have just two labels for the output, negative and positive, the dimension of the se-cond linear layer is 2. If the polarity of a StockTwits message is positive, the predicted positive score is expected to be larger than the predicted negative score, and vise versa.
The hinge loss of this model is defined as:
loss(m) = max(0, 1- g(m) fp(m) + g(m) fn(m)) (9)
Where g(m) is the gold value of message m (pos-itive or negative), fp(m) is the predicted positive
score, and fn(m) is the predicted negative score. Model Training: The data set used for train-ing this model is already described in previous section. To train this model, we take the deriva-tive of the loss by back-propagation with respect to the whole set of parameters, and use AdaGrad to update the parameters (Collobert et al., 2011; Duchi et al., 2011). Each term is first initialized by randomly choosing a negative and positive value less than 0.2. The same neural network and parameters setting are used to learn the sentiment polarity for both words and phrases. A validation data set was used to tune the model hyper-parameters.
Baseline Methods for Performance Com-parison: We compare our method to three other methods: TF.IDF, PMI and Vo & Zhang from (Vo and Zhang, 2016), which is based on a sim-ple neural network. PMI and TF.IDF are the two most successful approaches building lexicons based on statistic measures. The Vo & Zhang method is the state-of-the-art approach utilizing machine learning technology. We described them briefly below.
the sentiment score for term t, using the two TF.IDF values:
(10)
The final sentiment class depends on the value of . It is bullish if the value is positive and bearish if it is negative.
PMI is a popular statistic measure used in many previous studies to develop lexicons (Mo-hammad et al., 2013; Oliveira et al., 2014; Oliveira et al., 2016; Al-Twairesh et al., 2016; Vo and Zhang, 2016). It is defined as:
(11)
Where x and y are two objects, p(x) and p(y) are the probabilities of occurring x and y in the cor-pus, respectively, p(x, y) is the probability that they co-occur together. If x and y are strongly as-sociated, PMI will be largely positive. It is highly negative if they are complementary. And if there is no significant relationship between them, it is near zero. To compute a term’s sentiment score, we use both positive and negative PMI values of a term. The score for term t is defined as follow:
(12)
Where bullish and bearish refer to the sentiment label provided by the message author.
Vo & Zhang approach is a machine learning method that also optimizes the prediction accura-cy of message sentiment using lexicons (Vo and Zhang, 2016). To leverage large amount of data, they use a simple neural network to train the lex-icon. In this method, each term also has two po-larity values: positive and negative. It uses one layer to compute the predicted sentiment proba-bility, by adding the positive and negative values of all the terms in the input message together. Then a softmax function is used to get the pre-dicted sentiment label for the input message. The cross-entropy error is employed as the loss function. Vo and Zhang tested their method on Twitter, using the emotions in a tweet as the in-dication of its polarity type. They didn’t use it in the stock market domain.
3.3
Sentiment-Oriented Word EmbeddingWord embedding is a dense, low-dimensional and real-valued vector for a word. The
embeddings of a word capture both the syntactic structure and semantics of the word. Traditional bag-of-words and bag-of-n-grams hardly capture the semantics of words (Collobert et al., 2011; Mikolov et al. 2013).
The C&W (Collobert et al., 2011) model is a popular word embedding model. It learns word embeddings based on the syntactic contexts of words. It replaces the center word with a random word and derives a corrupted n-gram. The train-ing objective is that the original n-gram is ex-pected to obtain a higher language model score than the corrupted n-gram. The original and cor-rupted n-grams are treated as inputs of a feed-forward neural network, respectively. SOWE ex-tends the C&W model by incorporating the sen-timent information into the neural network to learn the embeddings (Collobert et al., 2011; Tang et al., 2014b); it captures the sentiment in-formation of messages as well as the syntactic contexts of words. Given an original (or corrupt-ed) n-gram and the polarity of a message as in-put, it predicts a two-dimensional vector (f0, f1), for each input n-gram, where (f0, f1) are the lan-guage model score and sentiment score of the in-put n-gram, respectively. There two training ob-jectives: the original n-gram should get a higher language model score than the corrupted n-gram, and the polarity score of the original n-gram should be more aligned to the polarity label of the message than the corrupted one. The loss function is the linear combination of two losses:
loss0 (t, t’) - the syntactic loss and loss1 (t, t’) -
the sentiment loss:
loss (t, t’) = α * loss0 (t, t’) + (1-α) * loss1 (t, t’) (13)
The SOWE model used in this study was trained from the same 6.4 million StockTwits messages used for building sentiment lexicons; this includes 5.1 million bullish and 1.3 million bearish messages. The metadata of the SOWE model will be presented in the Experiments sec-tion
4
Experiments and Results
4.1
Evaluation of Sentiment Lexicons
very small, then this term has a neutral senti-ment. If we use 0.10 as the threshold to differen-tiate neutral terms from positive and negative terms (i.e. terms with |positive-negative| < 0.10 are neutral), our approach generated 42K senti-ment words and phrases. The other three meth-ods have slightly lower amount of sentiment terms.
Sentiment Classification: The lexicons built from these methods can be used in both unsuper-vised and superunsuper-vised sentiment classifiers. The former is implemented by summing the senti-ment scores of all tokens contained in a given message (Taboada et al., 2011; Kiritchenko et al., 2014; Vo and Zhang, 2016). If the total senti-ment score is larger than 0, then the message is classified as positive. Here only one positivity at-tribute is required to represent a lexicon, so for lexicons with both positive and negative values for a term, the value of (positive − negative) is used as the score.
In this experiment, we used a supervised method for performance evaluation. There are different ways to generate features for a message using a lexicon. In this study, we follow the method used in previous studies (Zhu et al., 2014; Vo and Zhang 2016). If a lexicon has both posi-tive and negaposi-tive values for a term, then a unified score is first computed (i.e. positive – negative), and it is used to generate features described be-low. Given a message m, the features are:
- The number of sentiment tokens in m, where sentiment tokens are words or phrases whose sentiment scores are not ze-ro in a lexicon.
- The total scores of negative and positive terms.
- The maximal score of all the terms in this message.
- The total sentiment score of the message. - The sentiment score of the last term in m.
Data Set: we selected 30K messages that were already labeled as bullish or bearish from StockTwits’s 2016 data set. They were not in-cluded in the data set used for constructing the lexicons. The amounts of bullish and bearish messages in the data set are roughly about 70% vs. 30%. We split this data set into three parts: 70% as training data, 10% as validation data and 20% for testing.
Classifier and Performance Metrics: we tried several classifiers, such as LibLiner, logistic regression and SMO. SMO gave the best results for most cases, and so we used it to compare the four lexicons. SMO is a sequential minimal op-timization algorithm for training a support vector
[image:7.595.310.522.128.284.2]classifier. The F1 measure and accuracy are used as the performance metrics, which have been used by many previous studies.
Figure 2: Sentiment classification result, based on lexicons generated by different approaches.
Result: Figure 2 presents the results. It shows that the two methods based on neural network performed better than the two statistic measures. PMI outperformed TF.IDF, which is also demon-strated by other studies (Oliveira et al. 2016). For the two models using neural networks, our pro-posed model outperformed the Vo & Zhang model, and the result was statistically significant at p=0.01 using t-test. This result also shows that learning lexicon by predicting the accuracy of message is better than the approaches using statistic measures.
Metadata
Model
SOWE StockTwitsWE TwitterWE
Number of messages
6.4
million 37 million 200 million
Number of words in training data
87
million 505 million 2.9 billion
Number of unique words in the em-bedding model
165K 616K 3.5 million
Vector
di-mension size 300 300 300
Term fre-quency threshold
5 5 5
Learning context win-dows size
8 8 8
Table 2: Metadata of word embedding models 70
72 74 76 78 80 82 84 86
PMI TF.IDF Vo&Zhang Our Model
P
e
rfo
rm
ance
(0
to
100)
Method
F1 measure
[image:7.595.303.529.487.743.2]4.2
Evaluation of the SOWE Model
In this experiment, we evaluated the SOWE embeddings, which encode both the syntactic and sentiment information and are generated specifically for stock market. We also use senti-ment classification task to do the evaluation. We compare SOWE to only embedding models, not lexicons. The reason is that they are the same type of data, and so we can use the same feature setting for them, and the experiment setting would not affect the performance comparison re-sult. We didn’t compare the SOWE to the lexi-cons, because they are different types of data and we need to use different approaches to generate features for them, and this will inevitably affect their performance, and make an unfair compari-son. We leave this type of comparison for future research.
Word Embedding Models for Comparison:
The SOWE model is compared to two types of embeddings:
StockTwitsWE: this is a general word embed-ding model built from StockTwits data set. This model does not have sentiment information en-coded. But because the general embeddings cap-ture both the syntactic struccap-ture and semantics of the word, it may know that the term long and buy
have similar meaning in the stock market.
TwitterWE: this is a general word embedding model built from Twitter data set. This model is purely based on Twitter tweets. Although there are some tweets talking about stocks, most of the tweets are about other topics, such as sports and celebrities. We wanted to see how SOWE per-forms, compared to the embedding model learned from messages of a different social me-dia platform.
These two models are built using word2vec (Mikolov et al., 2013). For StockTwitsWE, we collected 37 million StockTwits messages, which include both the labeled (bullish or bearish) and unlabeled messages. They are preprocessed using the same steps as the data set for creating senti-ment lexicon. About 200 million tweets were collected from Twitter for building the TwitterWE model. The tweets date from October 2014 to October 2016. They were acquired through Twitter’s public streaming API and the Decahose data (10% of Twitter’s streaming da-ta). The basic information of the three models is presented in Table 2. The embedding dimension size, word frequency threshold and window size are set based on our pilot experiments.
Experiment Settings: In this experiment, we used the same data set used in last evaluation, which consists of 30K messages. The perfor-mance metrics used are also F1 measure and ac-curacy. The classifier used is still SMO, which gave the best performance among several classi-fiers we tried.
Message Representation from Term Embeddings: In this experiment, to derive the message representation from embeddings of its terms, we use the concatenation convolutional layer, which concatenates the layers of max, min and average of message terms. This layer gave the best performance based on our pilot experi-ments. . The concatenation layer is expressed as follow:
Z(t) = [Zmax(t), Zmin(t), Zave(t)] (14)
[image:8.595.309.530.345.490.2]where Z(t) is the representation of tweet t.
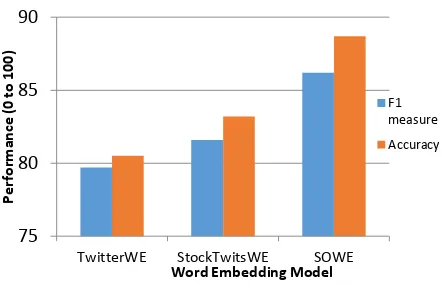
Figure 3: Comparison of the three word embed-ding models
Result: Figure 3 shows the comparison result of the three models. As we expected, the SOWE models performed the best, and the difference was statistically significant at p =0.01 using t-test. This proves that by integrating the sentiment information into word embeddings, we can great-ly improve the sentiment classification perfor-mance, although its training data set is much smaller compared to the other two models. The result also shows that the general embedding model trained on StockTwits messages per-formed better than the model trained on Twitter data set. One reason is that some terms in StockTwits have different sentiment meanings from the same terms in Twitter, such as put and
call.
75 80 85 90
TwitterWE StockTwitsWE SOWE
P
e
rfo
rm
ance
(0
to
100)
Word Embedding Model
F1 measure
5
Conclusion
In this paper, we described a new approach based on neural network for building a large scale sen-timent lexicon for stock market. We also pre-sented a sentiment-oriented word embedding model, learned from millions of labeled messag-es on stock market. The experiment of measur-ing investor sentiment shows that our lexicon construction approach outperformed the state-of-the-art methods, and the sentiment-oriented word embedding model performed well on predicting a message’s bullish/bearish polarity. The lexicons and word embedding presented in this study are available to researchers and others interested in sentiment analysis and stock market move pre-diction. One of our future studies is to apply our lexicon and SOWE on predicting stock market.
References
Alfred. V. Aho and Jeffrey D. Ullman. 1972. The The-ory of Parsing, Translation and Compiling, volume 1. Prentice-Hall, Englewood Cliffs, NJ.
Nora Twairesh, Hend Khalifa, AbdulMalik Al-Salman, AraSenTi: Large-Scale Twitter-Specific Arabic Sentiment Lexicons, ACL 2016
W. Antweiler, M. Z. Frank, Is all that talk just noise? the information content of internet stock message boards, The Journal of Finance 59 (3) (2004) Stefano Baccianella, Andrea Esuli, and Fabrizio
Sebastiani. 2010. SentiWordNet 3.0: An Enhanced Lexical Resource for Sentiment Analysis and Opinion Mining. In LREC, volume 10
J. Bollen, H. Mao, X. Zeng, Twitter mood predicts the stock market, Journal of Computational Science 2 (1), 2011
Collobert, Ronan, Jason Weston, Leon Bottou, Mi-chael Karlen, Koray Kavukcuoglu, and Pavel Kuksa. Natural language processing (almost) from scratch. The Journal of Machine Learning Re-search, 2011
John Duchi, Elad Hazan, and Yoram Singer. 2011. Adaptive subgradient methods for online learning and stochastic optimization. The Journal of Ma-chine Learning Research
Andrea Esuli and Fabrizio Sebastiani. 2005. Deter-mining the semantic orientation of terms through gloss classification. CIKM 2005.
Andrea Esuli and Fabrizio Sebastiani. 2006. Sentiwordnet: A publicly available lexical re-source for opinion mining. LREC’06, volume 6 Minqing Hu and Bing Liu. 2004. Mining and
summa-rizing customer reviews. KDD 2004
Jaap Kamps. 2004. Using Wordnet to measure seman-tic orientations of adjectives. LREC 2004
Svetlana Kiritchenko, Xiaodan Zhu, and Saif M. Mo-hammad. 2014. Sentiment analysis of short infor-mal texts. Journal. of Artificial Intelligence. Re-search, 50:723–762.
Quanzhi Li, Sameena Shah, Xiaomo Liu, Armineh Nourbakhsh, Word Embeddings Learned from Tweets and General Data, The 11th International AAAI Conference on Web and Social Media (ICWSM-17). May, 2017.
Quanzhi Li, S. Shah, X. Liu, A. Nourbakhsh & R. Fang, TweetSift: Tweet Topic Classification Based on Entity Knowledge Base and Topic En-hanced Word Embedding, CIKM 2016
Bing Liu. 2012. Sentiment analysis and opinion min-ing. Synthesis Lectures on Human Language Technologies, 5(1)
T. Loughran, B. McDonald, When is a liability not a liability? Textual analysis, dictionaries, and 10-Ks., Journal of Finance, 66 (1) (2011)
Maas, A.; Daly, R.; Pham, P.; Huang, D.; Ng, A. and Potts, C., Learning word vectors for sentiment analysis, ACL 2012
H. Mao, P. Gao, Y. Wang, J. Bollen, Automatic con-struction of financial semantic orientation lexicon from large-scale Chinese news corpus, Financial Risks International Forum, 2014.
Matt, T., Document Classification by Inversion of Distributed Language Representations, 2015. ACL 2015
Tomas Mikolov, Ilya Sutskever, Kai Chen, Greg Corrado, and Jeffrey Dean. Distributed Represen-tations of Words and Phrases and their Composi-tionality. NIPS, 2013.
Saif M. Mohammad, Svetlana Kiritchenko, and Xiaodan Zhu. 2013. Nrc-canada: Building the state-of-the-art in sentiment analysis of tweets.
SemEval-2013
Montoyo, P. Martnez-Barco, A. Balahur, Subjectivity and sentiment analysis: An overview of the current state of the area and envisaged developments, De-cision Support Systems 53 (4) (2012)
N. Oliveira, P. Cortez, N. Areal, On the predictability of stock market behavior using StockTwits senti-ment and posting volume, Progress in Artificial Intelligence, 2013
N. Oliveira, P. Cortez, N. Areal, Automatic Creation of Stock Market Lexicons for Sentiment Analysis Using StockTwits Data, IDES 2014.
N. Oliveira, P. Cortez, N. Areal, stock market senti-ment lexicon acquisition using microblogging data and statistical measures, Decision Support Sys-tems, 2012.
R. P. Schumaker, Y. Zhang, C.-N. Huang, H. Chen, Evaluating sentiment in financial news articles, Decision Support Systems 53 (3) (2012)
Socher, R.; Perelygin, A.; Wu, J.; Chuang, J.; Man-ning, C.; Ng, A. and Potts, C., Recursive Deep Models for Semantic Compositionality Over a Sentiment Treebank, EMNLP 2014.
Maite Taboada, Julian Brooke, Milan Tofiloski, Kim-berly Voll, and Manfred Stede. 2011. Lexicon-based methods for sentiment analysis. Computa-tional linguistics, 2011
Duyu Tang, Furu Wei, Bing Qin, Ming Zhou, and Ting Liu. 2014a. Building large-scale twitter-specific sentiment lexicon: A representation learn-ing approach. COLING 2014
Duyu Tang, Furu Wei, Nan Yang, Ming Zhou, Ting Liu, and Bing Qin. 2014b. Learning sentiment specific word embedding for Twitter sentiment classification. ACL 2014
Peter Turney and Michael L Littman. 2002. Unsuper-vised learning of semantic orientation from a hun-dred-billion-word corpus. Technical report, NRC Institute for Information Technology; National Research Council Canada.
D. Vo and Y. Zhang, Target-dependant twitter senti-ment classification with rich automatic features, IJCAI 2015.
D. Vo and Y. Zhang, Don’t Count, Predict! An Au-tomatic Approach to Learning Sentiment, ACL2016.
Gbolahan K Williams and Sarabjot Singh Anand. 2009. Predicting the Polarity Strength of Adjec-tives Using WordNet. ICWSM 2009
Theresa Wilson, Janyce Wiebe, and Paul Hoffmann. 2005. Recognizing contextual polarity in phrase-level sentiment analysis. EMNLP 2005