An Interactive DEA Based Management
System for Hospitals
Abstract—there are several reasons to collect historical data from businesses. They can be used for quality assessment and evaluation. They can be also used for forecasting, planning, estimation and decision making. Data Envelopment Analysis (DEA) can be used to evaluate and compare different Decision Making Units (DMUs) based on input and output attributes. In this paper, public hospitals in Jordan are evaluated based on different algorithms and methods related to DEA. Results showed that it is very important initially to define correctly the input and output attributes to the model as such decision will impact the overall results. It is also important to enumerate all possible inputs and outputs that may contribute to such efficiency. A decision support tool is developed to help decision makers change input and output variables on the fly and evaluate their impact on the efficiency. Users can use the concepts of “goal seek” and “what if” analysis based on the collected input and out data for each hospital and based on the hospital attributes relative to other hospitals that are compared with.
Index Terms—Data Envelopment Analysis (DEA), relative performance, Health Information Systems (HIS), and data mining.
I. INTRODUCTION
HE
usage of data mining in the different science fields is common in order to extract useful information and hidden pattern. Decision makers are interested to know what they can do in order to improve the overall productivity and quality of their business. Despite the fact that the health system is not a purely cost oriented system and its goals are not focused on making revenue, however, cost related models such as DEA are used to evaluate the productivity in terms of the quality of service for such system. This is why the majority of the output attributes that are used as indicators in the DEA models are related to patients and treatment.Manuscript received Dec. 29th, 2010; revised Jan. 16th, 2011. Hassan Najadat is an assistant professor in Computer Information Systems Department at Jordan University of Science and Technology, Irbid, 22110, Jordan, [email protected].
(Corresponding author) Izzat Alsmadi is an assistant professor in Computer Information Systems Department at Yarmouk University, Irbid, Jordan, tel. 962-27211111-2499, 962776904711.
The first model of DEA was introduced Charnes, Cooper and Rhodes in 1978 which was actually an enhancement of
Farell “border production function” methodology to measure technical efficiency in 1957. Later it, Banker (who introduced the CCR model) and Kemerer use this approach in order to prove the existence of both rising and falling returns to scale [1][2] [14].
The BCC model is introduced in 1984 and named after the three researchers (Banker, Charnes and Cooper). DEA is an optimization method of linear programming that uses a non parametric approach for evaluating relative efficiency and productivity for multiple inputs and multiple outputs of firms or case studies.
A key aspect of DEA is that it is used to compare efficiency of Decision Making Units (DMUs) for different domains such as bank branches, universities, sales outlets and health care departments from different aspects that does not require the assignment of predetermined weights to the input and output factors (weight can be given to the different inputs and outputs to indicate the importance of those parameters on the final results or decision). DEA employs flexible, nonparametric methods to construct the best-practice and so allows the data to identify themselves in contrast to some other parametric methods such as SFA (Stochastic Frontier Analysis) [3].
There are numerous DEA models introduced to assess the efficiency of firms. In general, these models differ in their goal orientation (e.g. input-orientation vs. output-orientation), disposability (e.g. strong vs. week), diversification and returns to scale (e.g. CRS vs. VRS). The most well-known models are the BCC developed by Banker, Charnes and Cooper, and CCR developed by Charnes, Cooper and Rhodes.
The utilization of DEA in health care is widely spread; Banker et al. used DEA to identify the nature of returns to scale to a given patient mix and hospital capacity [15]. They did not determine the returns to scale of individual hospitals; return to scale has important applications in health care organizations, which seeks to attain a specified level of efficiency improvements that determine the effectiveness of resource utilization, such as giving an indicator for adding hospital capacity to improve efficiency in the provided services.
A DMU is considered as 100% efficient relative to other DMUs if the performance of other DMUs doesn’t show that
Hassan Najadat, and Izzat Alsmadi
some of its inputs or outputs can be improved without worsening some of its other inputs or outputs.
There are several software applications that can be used for DEA. In this approach, DEA software applications will be used to evaluate hospitals productivity in terms of evaluating each individual hospital as a DMU. There are attributes or characteristics that are gathered for each hospital such as: the number of bids, doctors, nurses, inpatients, outpatients, expenses, revenue, etc. Those characteristics will be divided into two main categories: input and output. The DEA software uses optimization algorithms to find the best DMU in terms of productivity or performance based on the information given and the user selections. The rest of the paper is organized as the following: In the next section related papers to using DEA in hospitals evaluation will be introduced. The next section will present the work done in evaluating Jordanian public hospitals using the DEA concepts. Paper will be concluded by conclusion and possible future extensions.
II. RELATED WORK
Barros et al analyzed the efficiency and productivity growth for a sample number of Portuguese hospitals by observing technological and efficiency changes [1]. The research used DEA and Malm-quist productivity index. A directional distance function is introduced to measure the smallest changes of inputs and outputs in a given direction by defining a reference or goal point to be achieved after performing the frontier approach.
The dataset used is collected from Portuguese ministry of health and from the financial accounts of 51 Portuguese hospitals. It takes into account the number of case flows (i.e. the number of patients that leave the hospital), length of stay, consultation and emergency cases as outputs. On the other hand it used three parameters as inputs; number of beds, personnel and total cost. The results showed that there is a positive technological change for only 8 of the 51 hospitals analyzed.
The goal of Chen et all paper was to evaluate and choose new methods to be used in Taiwan hospitals for two goals: First, to evaluate and choose new medical technologies, and second to improve efficiency, and the monitoring of existing methods [2]. The adopted model is input oriented CCR model integrated with MCDA (Multi-Criteria Decision Analysis) model. The latter is used in order to determine decision making performance indicators. CCR model is used to evaluate the efficiency of existing and new technologies. In the decision making field, seven broad criteria was proposed to be used as alternative strategies when risks are found. Those are: efficiency, effectiveness, safety, revenue, social responsibility, institutional strategy, feasibility and risks. The research preferred to use the DEA approach because it covers multiple inputs-outputs unlike regression or ration analysis which gives a direction of how the efficiency of DMUs could be improved for monitoring and controlling purposes, and computes the relative efficiency for DMUs with no need for defining weights for each DMU in advance. The result showed that MCDA
integrated with CCR outperforms other methods in terms of tangible and intangible resources.
Osei et al tried to measure the technical and scale efficiency for 34 hospitals and health centers in Ghana and gives directions that help decision-makers for an effective management in the health sector [3]. The study divided inputs into broad categories and further each one of them is divided into sub-category as the following: personnel, materials, and capital. The output is divided into maternal and child health care visits, deliveries and inpatient discharges. The study used CRS (i.e. Constant Return to Scale) and VRS (i.e. Variable Return to Scale) models to assess the efficiency of the selected hospitals. Measuring efficiency of the DMUs is calculated in three steps; first, the efficiency was estimated through CRS and second, through VRS. Third, scale efficiency was obtained by dividing each hospital's CRS efficiency score by its VRS efficiency score.
Linna et al compared cost efficiency between several Finnish and Norwegian hospitals in order to help decision makers to decide the most suitable payment strategy for health care [4]. They cluster hospitals into several clusters according to some criteria such as size, administrative levels, type of services, etc. They used CRS and VRS for measuring cost efficiency. The result showed a considerable difference between the Finnish and Norwegian hospitals in term of cost efficiency, input price and length of stay.
Butler et al tried to work on studying the impact of variables’ changes on inefficient DMUs in Michigan hospitals [5]. The variables used in the study include: Number of beds, total services, and number of technical employees are as inputs, and total number of inpatients, number of surgeries, and number of handled operations in the emergency room as outputs.
Fare et al published an earlier paper evaluating productivity change in Swedish hospitals during the period from 1970 to 1985[6]. They employed Malmquist output-based productivity index. However, several to several other papers, cost consideration was questionable as hospitals (specially the public ones) are not originally intended to maximize revenue. As cost factors were not considered thoroughly in the research, results showed that productivity is decreasing. Such illumination of the cost-expensive-revenue factors may make the results biased. Similar to cost, the consideration of quality factors which are usually ignored is another reason that may indicate that such results can be biased.
inefficient. Results showed that the size of the hospital is an important factor in assessing its productivity. However, in many papers, hospitals are clusters into different clusters and productivity is measured for each hospital based on its neighbors (i.e. those that join the hospital the same cluster). Size is one of the attributes that hospitals can be clustered according to.
III. GOALS AND APPROACHES
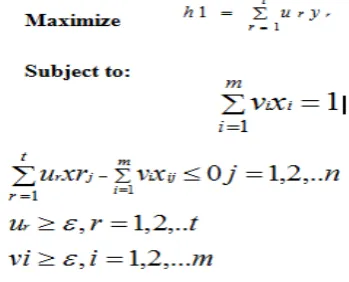
[image:3.595.60.235.292.433.2]Figure 1 shows the general linearized formula used in DEA analysis tools to calculate efficiency, where n represents the DMUs, t represents all output attributes, and m represents all the input attributes. The goal is to maximize the efficiency h, u is the weight of the output r, vi is the weight of the input i, yrj is the amount of output r of DMUj (j=1, …n ), Xij is the amount of input i of DMUj (j=1, … n).
Fig. 1. DEA linear formula
In DEA, methods can be oriented to input or to output. An input-orientation method concerns with decreasing the input data proportionally to have more efficient DMUs. An output-orientation method focuses on increasing the productivity or the quality of services provided without affecting trying to affect the quality of the inputs used. Within DEA, three algorithms can be used: First, Constant Return to Scale (CRS), which doesn't have to improve inputs or outputs, second, increasing return to scale (RS) that needs to leverage the quality of provided services. Third, decreasing RS which will eventually increases the input volume.
Another method which is also used in this study is multistage DEA. This method is used to identify the efficient DMUs which have mixes of input-output parameters which are invariants and similar as much as possible to those of the inefficient DMUs.
a. The case study
This research focuses on evaluating hospitals performance in providing health services. The researchers collected the data from public resources of the ministry of health (www.moh.gov.jo), world health organization website (www.who.int). Data is also collected directly from hospitals and experts in the domain. The hospitals cover the public hospitals in Jordan of total of 28 hospitals. Those 28
hospitals cover all Jordan provinces. Table 1 shows a summary of those hospitals
TABLEI: JORDAN PUBLIC HOSPITALS
Number of :
No Beds Physicia
n
s
In
pa
ti
en
t
P
a
tients
Treated Total Revenue
1 921 557 73467 72213 3142232489
2 379 240 21155 20504 1331716879
3 131 105 11085 10909 532382350
4 98 57 10180 10146 276037200
5 38 28 3202 3190 44667660
6 300 219 28607 28110 1111293800
7 129 66 15281 14986 764285060
8 250 24 1456 1515 44184050
9 152 170 15705 15443 549902850
10 48 32 4141 4101 99204250 11 45 32 3994 3930 106296550
12 202 245 18028 17774 749245450
13 109 49 9693 9531 88961400 14 95 45 12088 12088 253325100 15 87 37 5482 5439 91058000 16 104 45 6926 6823 173977530 17 60 46 4656 4561 111953150 18 46 34 4263 4243 92316850 19 82 34 2350 2322 61261300 20 135 46 11957 11757 226693450 21 105 42 10625 10504 119756350
22 125 101 11156 11028 197557670
23 82 43 6175 6142 78189335 24 108 25 9415 9292 105987140 25 75 37 5001 4833 157458993
26 17 22 474 474 22864910
27 131 35 6675 6649 97455700 28 72 36 4240 4160 66117850
There are several attributes collected from those hospitals. Those attributes can be classified into different classifications. The first and general one that is used in DEA internal algorithms is to divide attributes into: inputs and outputs.
2. Outputs. Those include the attributes that are quality and productivity oriented. Those can be divided into: personnel, assets, or resources and services. The personnel can be divided into: number of inpatients and number of patients treated or outpatients. The services are also divided into outpatients’ visits, number of surgical operations, emergency room visits and length of stay for inpatients. In addition, many related papers can list some other attributes such as the monetary attributes as output indicators.
The attributes can be also divided into attributes that are updated frequently or on a daily basis and other attributes that static or updated less frequently.
It should be mentioned that not all research papers agree on the exact selection of what should be input and what should be output attributes. This is indicated in the related work. Results indicated that some attributes such as cost or monetary attributes can affect the whole results whether they are selected or excluded and whether they are input or output.
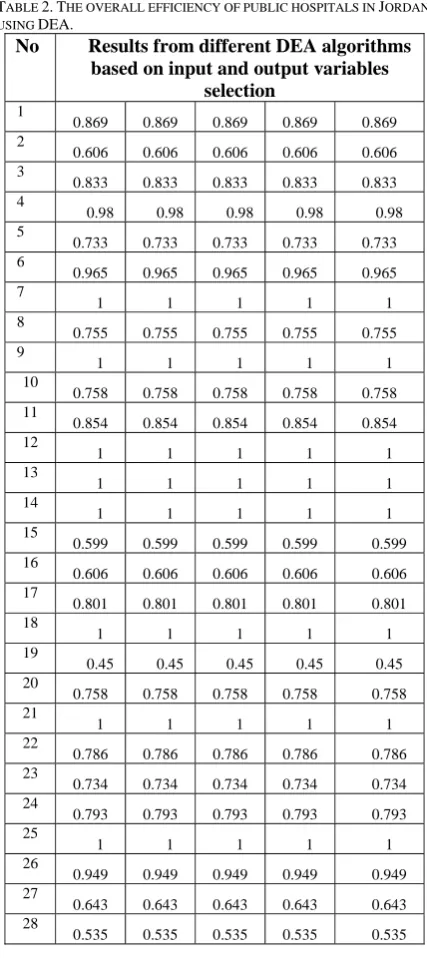
Table 2 shows the overall DEA results from all algorithms while excluding the revenue attribute. The 5 algorithms used are from those available in DEA tool that were described earlier. This include: DEA (single stage, 2 stages, multi stage calculations, return to scale: constant and variable, and Malmquist). Some of those excluded as they show identical results to one that is already displayed. Other algorithms are used and not displayed as they show similar results.
Results showed that there are some hospitals that showed fixed 100 % efficiency relative to all used algorithms. On the other hand, some other hospitals also showed fixed inefficiency using all different methods or algorithms. Results also showed that there is no direct relation or dependency between the size or the location of the hospital with its efficiency. Efficient hospitals are of the small and large cities and the same thing applies for the inefficient hospitals.
b. Goal seek approach to improve efficiency
In order to produce an effective tool for decision makers, we developed the tool to allow users to change values of inputs or outputs and see their impact on the efficiency. For example, the Figure 1 below shows the least efficient DMUs (26, 8 and 19) with their original values in the first part of the paragraph with efficiencies of (0.506, 0.724, 0.753 respectively). For a trial purpose, we changed one attribute in each DMU to see its impact on the efficiency.
In DMU 26, we changed the number of beds (which is an input variable) from 17 to 50 (while fixing all other input and output variables). This further lowers the efficiency from 0.506 to 0.423. In DMU 8, we changed another input variable (Number of pharmacist) from 1 to 10. This also lowers the efficiency from 0.724 to 0.502. Notice that increasing an input variable while not improving any output variable is an indicator of worsening the efficiency. In the third DMU; 19, we changed an output variable: Number of surgical operation from 435 to 700 which improves the efficiency from 0.751 to .791.
TABLE 2.THE OVERALL EFFICIENCY OF PUBLIC HOSPITALS IN JORDAN
USING DEA.
No Results from different DEA algorithms based on input and output variables
selection 1
0.869 0.869 0.869 0.869 0.869 2
0.606 0.606 0.606 0.606 0.606 3
0.833 0.833 0.833 0.833 0.833 4
0.98 0.98 0.98 0.98 0.98 5
0.733 0.733 0.733 0.733 0.733 6
0.965 0.965 0.965 0.965 0.965 7
1 1 1 1 1 8
0.755 0.755 0.755 0.755 0.755 9
1 1 1 1 1 10
0.758 0.758 0.758 0.758 0.758 11
0.854 0.854 0.854 0.854 0.854 12
1 1 1 1 1 13
1 1 1 1 1 14
1 1 1 1 1 15
0.599 0.599 0.599 0.599 0.599
16
0.606 0.606 0.606 0.606 0.606
17
0.801 0.801 0.801 0.801 0.801
18
1 1 1 1 1 19
0.45 0.45 0.45 0.45 0.45 20
0.758 0.758 0.758 0.758 0.758
21
1 1 1 1 1 22
0.786 0.786 0.786 0.786 0.786
23
0.734 0.734 0.734 0.734 0.734
24
0.793 0.793 0.793 0.793 0.793
25
1 1 1 1 1 26
0.949 0.949 0.949 0.949 0.949
27
0.643 0.643 0.643 0.643 0.643
28
0.535 0.535 0.535 0.535 0.535
[image:4.595.317.531.86.566.2]efficiency reaches above 1 relative to the frontier DMU which is 2.19.
Fig1. Examples of changing attributes and impact on efficiency.
IV. CONCLUSION AND FUTURE WORK
DEA is used to evaluate the efficiency of public hospitals in Jordan and build a decision support system that can help hospitals’ decision makers in finding ways to improve their hospitals efficiency. We tried to study the impact of using or excluding the revenue as an output or parameter. Results showed that revenue and expenses are important factors to consider when evaluating efficiency. However, in service oriented businesses such as that of the hospitals, considering cost and revenue may skew the overall results. There are some important attributes that we were not able to collect or measure due to accessibility or due to the fact that such attributes are difficult to quantize. Examples of some of those attributes are: quality of service, overall user or patient satisfaction, etc.
We developed a DEA decision support system that allow hospital decision makers see their hospital efficiency relative to other hospitals and allow them to change any input or attribute in the fly and see its impact on the overall hospital efficiency. Using such tool shows the value of using DEA for evaluating productivity as it produces a method for those decision makers to understand what efficiency means and what can they do to improve it.
ACKNOWLEDGEMENT
This project is funded by Jordanian Scientific Research Support Fund ( SRF).
REFERENCES
[1] Barros CP, Gomes de Menzes A, Peypoch N, Solonandrasana
B, Vieira JC. “An Analysis of Hospital Efficiency and Productivity Growth using the Luenberger Productivity Indicator”. Health Care Management Science journal. Pages: 373-381. 2008.
[2] Yi-Shan Chen, Wei-Hua Andrew Wang, Tam Chan, Ya-Ting
Liang, Developing a quantitave model to evaluate and compare
the performance of hospital medical technologies in Taiwan, Journal of the Chinese Institute of Industrial Engineers, Vol. 22, No. 5, pp. 430-441 (2005).
[3] Daniel Osei, Selassi d'Almeida, Melvill O George, Joses M
Kirigia, Ayayi Omar Mensah and Lenity H Kainyu, Technical efficiency of public district hospitals and health centers in Ghana: a pilot study, BioMed Central, 2005.
[4] Miika Linna, Unto H¨akkinen, Jon Magnussen, Comparing
hospital cost efficiency between Norway and Finland, Health Policy, 2006.
[5] Timothy W. Butler, Ling LiThe, utility of returns to scale in
DEA programming: An analysis of Michigan rural hospitals, European Journal of Operational Research, 2003.
[6] Färe R, Grosskopf S, Lindgren B, Roos. Productivity
development in Swedish Hospitals: a Malmquist output index approach, in data envelopment analysis: theory and methodology. Kluwer Academic Publisher, Dordrecht. 1989.
[7] Andrew Worthington. An empirical survey of frontier
efficiency measurement techniques in healthcare services, < http://www.bus.qut.edu.au/faculty/schools/economics/documen ts/discussionPapers/1999/Worthington_67.pdf>. 1999.
[8] Kirigia, Joses Muthuri; Mensah, Omer A.; Mwikisa, Chris;