1
Mitigating unwanted amorphisation: A screening method
for the selection of suitable excipients.
Youness Amharar,* Vincent Curtin, Kieran H. Gallagher, Eoin O’Siochru, Peter O’Connell, Anne-Marie Healy
School of Pharmacy and Pharmaceutical Sciences, Trinity College Dublin, Dublin 2, Ireland.
Author Information * Trinity College, School of Pharmacy and Pharmaceutical Sciences, Panoz Institute, Dublin 2, Ireland.
E-mail: [email protected]. Tel: +353 (0) 1 896 1444.
Abstract
Co-processing an active pharmaceutical ingredient (API) with a low Tg excipient has been
previously reported to be an effective strategy for preventing drug amorphisation on milling.
This technique relies on the ability of the excipient to form a molecular dispersion with the
amorphous API during the milling process. The presence of the excipient within the amorphous
phase induces a reduction of the Tg. Hence, the molecular dispersion becomes less stable than
the amorphous API alone and recrystallises upon milling. The objective of this study was to
develop a screening method for the selection of suitable excipients to prevent amorphisation,
based on two criteria: the Tg of the excipient and the solubility of the excipient in the amorphous
API. The ability of the excipients to induce Tg reduction was first assessed by measuring the Tg
of the amorphous composite by thermal analysis and comparing it with that of the pure API
(griseofulvin). A predicted ability for mitigation of amorphisation upon milling was then
deduced from these observations for each excipient and assessed against experimental results.
The same excipients were then studied with regard to their expected solubility in another
2
evaluate their capacity to form an amorphous composite with the drug. The predicted effects of
the excipients on comilling were compared with the amorphous content of the processed API.
The screening method as applied to both APIs showed good agreement with the experimental
results and were shown to be efficient for the selection of the most appropriate excipient. This
approach revealed that the two key parameters involved are the Tg of the excipient and the
ability of the API to form an amorphous molecular dispersion with the excipients. This work
confirms and completes our previously published results on the mitigation of the amorphisation
by comilling with low Tg excipients and constitutes the first report of the use of a polymeric
additive for this purpose.
Keywords: Mitigation of amorphisation, Amorphous, glass transition temperature, solubility,
3
1. Introduction
Milling is a unit process commonly used in the pharmaceutical industry for particle size
reduction (Yu, 2001). This technique imparts a lot of energy into a pharmaceutical system and
can lead to the generation of amorphous content (Gusseme et al., 2008; Willart and Descamps,
2008). Various studies have been carried out to promote the production and retention of this
amorphous character, due to its enhanced solubility and bioavailabilty compared to the
crystalline form (Pokharkar et al., 2006; Shah et al., 2006). However, due to the inherent
physical instability and chemical reactivity associated with this amorphous state, there is,
conversely, also a keen interest in avoiding this, often unintentionally generated, high energy
state and retaining the crystallinity of active pharmaceutical ingredients (APIs) upon milling (Yu,
2001; Hancock and Zografi, 1997).
Co-processing with crystalline excipients of low glass transition temperatures (Tg) has
previously been shown to reduce the amorphisation of salbutamol sulphate and sulfadimidine
(Balani et al., 2010; Curtin et al., 2013a, 2013b). Curtin et al have hypothesised that the
amorphous API produced during the process (milling or dry blending) dissolves the crystalline
low Tg excipient thus generating an amorphous composite with a lower glass transition
temperature compared to the drug alone (Curtin et al., 2013a, 2013b). This Tg reduction induces
a decrease of the stability of the two-component amorphous phase and can trigger the
recrystallisation of the composite during the process, resulting in the production of a physical
mixture of crystalline API and crystalline excipient. The Tg of the excipient therefore appears to
be the key parameter which determines its ability to reduce or prevent amorphisation. The
4
latter has to be at least partially soluble in the amorphous API in order to exert its Tg lowering
effect, as shown by Curtin et al. (Curtin et al., 2013b)
To further investigate this topic, a series of crystalline excipients were tested for their ability to
mitigate the amorphisation of two model APIs on processing: griseofulvin and budesonide.
These two APIs were chosen because of their high glass transition temperature (ca. 90°C) and
their known propensity to amorphise when milled (Willart et al., 2012; Dudognon et al., 2006).
The ability of the excipients to induce a reduction in Tg were first assessed by thermal analysis
on griseofulvin and compared with their efficiency for preventing the amorphisation of the API
by comilling. A screening method was deduced from these observations and then assessed on
systems formed by the same excipients and another API, budesonide. The purpose of this study
was to design a predictive model for screening crystalline excipients that can selectively reduce
or prevent unwanted amorphisation upon co-processing.
2. Materials and Methods
2.1. Materials.
Griseofulvin (GF) (Mw = 352.77 g.mol-1), budesonide (BD) (Mw = 430.53 g.mol-1),
glutaric acid (GA) (Mw = 132.11 g.mol-1), adipic acid (AA) (146.14 g.mol-1) mannitol (MN)
(Mw = 182.20 g.mol-1), poly(ethylene glycol) (PEG) (Mw = 4000 g.mol-1), methanol (Mw =
32.04 g.mol-1) and chloroform (Mw = 119.38 g.mol-1) were purchased from Sigma-Aldrich,
Ireland. Xylitol (XY) (Mw = 152.15 g.mol-1) was obtained from Lancaster Synthesis, England.
The thin layer chromatography (TLC) plate was purchased from Riedel de Haen, Germany.
5
2.2.1. Milling.
Ball milling was performed using 2.5 g of material in a PM 100 high energy planetary
mill (Retsch, Germany) at room temperature, as previously described by Curtin et al. (2013a).
Griseofulvin and budesonide were milled for 17 and 18 hours for systems respectively.
2.2.2. Thermal analysis.
Differential scanning calorimetry (DSC) experiments were conducted using a DSC Q200 (TA
Instruments, United Kingdom) as previously described (Curtin et al., 2013a). Unless otherwise
noted, the reported Tg is the midpoint temperature of the glass transition (n=2).
2.2.3. Powder X-ray diffraction.
Powder X-ray diffraction (pXRD) measurements were performed on samples placed on a low
background silicon sample holder using a Rigaku Miniflex II desktop X-ray diffractometer
(Rigaku, Tokyo, Japan) as previously described (Curtin et al, 2013a).
2.2.4. Preparation of API/excipient amorphous composites.
API/excipient mixtures (50/50 w/w) were milled as described in the previous section and
subsequently melted on a heating plate under a nitrogen atmosphere. The resulting materials
were then quenched to 25 °C. pXRD was used to verify the absence of crystalline API. The Tg
of the resulting amorphous phase was then determined by DSC as described above (n=2).
2.2.5. Hildebrand solubility parameter.
The Hildebrand solubility (δ) parameters were determined utilising the Fedors’ group
6
δ=(ΔEv/Vm)1/2 (1)
where ΔEv is the energy of vaporisation and Vm is the molar volume.
2.2.6. Dynamic vapour sorption (DVS).
Sorption isotherms and kinetic profiles of the milled solids were obtained using DVS
(Advantage, Surface Measurement Systems, Alperton, UK) as previously described (Curtin et
al., 2013a and 2013b). The temperature was 25.0 ± 0.1 °C and water and ethanol were used as
the probe vapours for GF and BD systems respectively. The samples were dried at 0 %P/P0 and
then subjected to step changes of %P/P0 up to 90 % and 80 % for GF and BD respectively, and
the reverse for desorption. Amorphous content was determined using Eq. 2:
% amorphous content = 100 x (2)
Where Δm is the difference in the mass uptake (%) of the API between the first and second
sorption cycles at a system specific %P/P0, ms is the sample mass in the DVS, md is the mass of the API in the overall sample mass, and Δm100 is the difference in mass uptake (%) between the
first and second sorption cycles of the fully amorphous standard (GF sample milled at 4°C). The
amorphous content was defined as the mass percentage of amorphous API.
All DVS experiments were performed at least in duplicate.
7
The chemical integrity of melt-quenched samples was determined using a Shimadzu HPLC Class
VP series with a LC-10AT VP Pump, SIL-10AD VP autosampler and SCL-10VP system
controller for GF, GA, AA and MN and a Waters HPLC equipped with a Waters 1525 binary
HPLC pump and a Waters 717 Plus autosampler for XY. The mobile phases were vacuum
filtered through a 0.45 μL membrane filter (Pall Supor-450) and consisted of methanol/purified
water 70/30 (v/v) for GF (Trotta et al., 2003), water (purified) for MN and XY (British
pharmacopoeia, 2007 and 2013) and a phosphoric acid solution (pH=2.1) for GA and AA
(Amharar et al., 2014). Separation was performed on TSK-Gel 6000PWXL (30cm length,
7.8mm diameter, pore size 13 μm) and TSK-Gel 3300PWXL (30cm length, 7.8mm diameter,
pore size 6 μm) columns with elution carried out isocratically at temperatures of 50°C and 40°C
for MN and XY respectively (British Pharmacopoeia, 2007 and 2013). For GA and AA a
LiChrosorb RP-10 column (250 mm length, internal diameter 4 mm, and particle size 10 μm)
was used at room temperature with isocratic elution. Separation was performed on a Luna C18
(250mm length, diameter 4.6mm, particle size 5 µm) for GF with elution carried out isocratically
and at room temperature (Trotta et al., 2003). UV detection was used at a wavelength of 245 nm
for GF and at 210 nm for GA and AA using a SPD-12A VP UV-Vis detector. A flow rate of 1
ml/min was used for GA and AA and 0.8 ml/min for GF. A Waters 410 Differential
Refractometer held at a temperature of 50 °C with a flow rate of 0.5 ml/min was used for the
detection of MN. The detection of XY was performed on a Waters 2414 Differential
Refractometer held at 40°C with a flow rate of 1 ml/min.
Class-VP 6.10 software was used for peak evaluation.
8
Thin layer chromatography was used to assess the thermal stability of PEG (Padfield, 1990).
Analyses were carried out on TLC aluminum plates (20 × 20 cm, 0.2 mm layer thickness)
precoated with silica gel (254 nm). The sample volumes for all experiments were 5 µl. The
mobile system used was methanol:H2O:Chloroform (70:24:6, v/v/v). The TLC plate was
developed until a 12 cm migration distance of the solvent from the start line was achieved.
Iodine vapour was used for spot detection. The development distance of the samples were
compared with that of raw PEG and the expected degradation products (lower molecular weight
analogues).
2.2.9. Nomenclature.
The system formed by a mixture of the API A and the excipient B is denoted AB. If this mixture
contains X % w/w of B, the resulting solid is denoted ABX. For example GFGA50 stands for a
mixture of 50% of GF and 50% w/w of GA. It is acknowledged that the term ‘solubility’ cannot
be used on amorphous systems below Tg because these systems are not thermodynamically
defined at these temperature (Amharar et al., 2014). However, it will be used instead of ‘apparent
solubility’ for clarity.
3. Results and Discussion
3.1. Thermal screening on Griseofulvin based systems.
The ability of the excipients to reduce the Tg was first evaluated for GF. The
2-component systems were melt-quenched and subsequently analysed by DSC. When two
9
chemical affinity and their ability to be amorphised. If both A and B are fully amorphisable but
not miscible, a biphasic amorphous mixture is obtained (amorphous A + amorphous B) and
characterised by the presence of two distinct Tgs belonging to the two pure compounds on the
thermogram. On the other hand, the occurrence of a single Tg intermediate to that of the two
compounds is an indicator of a fully mixed, single phase system (amorphous AB). However if A
is not fully amorphisable by the melt-quench method, it will recrystallise upon cooling. In the
case of insolubility of A in amorphous B, the amount of crystalline A before and after the
process should remain the same and the thermogram will exhibit the glass transition of pure
amorphous B and the melting peak of A. Conversely if A is soluble in amorphous B, only a
fraction of A should remain crystalline post-process, the other part being molecularly dispersed
within amorphous B. Moreover, if the Tg of pure A is lower than that of pure B, the resulting
amorphous composite AB is expected to exhibit a reduced Tg relative to pure B. The
thermogram of such a system will display a Tg (the reduced glass transition of AB) followed by
the melting of the remaining crystalline A. This method therefore enables the determination of
the ability of a given excipient to reduce the Tg of an API through a single DSC scan.
The five low Tg excipients that were tested for Tg reduction are glutaric acid (GA), adipic acid
(AA), mannitol (MA), xylitol (XY) and polyethylene glycol (PEG). Their respective pXRD
patterns are displayed in Figure 1. The first two excipients that were tested are two dicarboxylic
acids that were previously shown to mitigate the amorphisation of salbutamol sulphate and
sulfadimidine (Curtin et al., 2013a and 2013b). The first step of this study consists in
determining the Tg of the pure materials (API and excipient). Pure amorphous GF was produced
by melt-quenching and its Tg was determined by DSC. The corresponding thermogram is
10
As previously reported, amorphous GA and AA could not be produced, but given their inability
to be amorphised and their low melting temperature these excipients were expected to exhibit a
low glass transition temperature (Curtin et al., 2013a and 2013b). The melt-quenched mixture
GFGA50, prepared as described above, was analysed by DSC. The thermogram shows a Tg with
a midpoint of 19.2 °C but no melting peak. The presence of a single glass transition and the
absence of any melting phenomenon indicate that GA and GF form a single amorphous phase i.e.
a molecular dispersion. This composite presents a glass transition which is far lower than that of
GF alone (93 °C). HPLC analyses verified an absence of chemical degradation upon heating.
The DSC scan of GFAA50 displayed in Figure 2 reveals a single Tg at 46.9 °C followed by a
melting endotherm at ca. 145 °C. These two thermal events demonstrate the presence of a
biphasic system made of an amorphous phase exhibiting a glass transition at 46.9°C and a
crystalline phase. The melting peak, corresponding to the melting of AA, proves the presence of
crystalline excipient post-quench as confirmed by pXRD (data not shown). The absence of a
melting peak at 220 °C (melt of GF) shows that GF has been totally amorphised. It can therefore
be deduced that the amorphous phase is a composite GFAA in which the amount of excipient is
lower than 50% (w/w). HPLC analyses showed that, as for GFGA, no chemical transformation
occurred during the process. According to these experimental data, the solubility of crystalline
AA in amorphous GF is significantly lower than that of GA. Moreover the Tg reduction
observed in the GFAA system is also less pronounced than in the GFGA composite (46.9°C vs.
19.2°C). This difference in Tg reduction could either be due to the Tg of the excipient itself or to
11
In line with the aforementioned hypothesis that the Tg lowering principle can be exploited to
promote crystallisation of a drug that becomes amorphous on milling, it can be concluded that
the dicarboxylic acids GA and AA are promising excipients in this regard, and would be
expected to have a major effect on reducing the amorphous character of GF following comilling.
Using the same protocol, two other low molecular weight excipients were tested: mannitol (MN)
and xylitol (XY). These two sugars have been reported to have a sub-ambient glass transition
temperature (Kim et al., 1997; Descamps et al., 2007). The DSC scan of melt-quenched XY is
presented in Figure 3 and reveals a glass transition at -15.8°C.
The thermogram of the mixture GFXY50 shows two distinct Tgs followed by a recrystallization
peak and a melting endotherm. pXRD confirmed that the system was X-ray-amorphous prior to
thermal analysis (data not shown). Moreover HPLC analysis revealed that the chemical integrity
of the sample was not affected by the heating process. The first glass transition occurs at -18.1
°C, which is close to that of pure XY, and the second occurs at 87 °C, which is similar to that of
pure GF. This feature is typical of a biphasic amorphous phase-separated system. Based on the
two glass transitions observed, the system GFXY is composed of a drug-rich and an
excipient-rich amorphous phase. It can therefore be concluded that the affinity between GF and XY in the
amorphous state is extremely low. As a result, XY is not able to exert any significant Tg
reduction on GF despite its own subzero glass transition temperature.
Amorphous MN could not be produced by any melt-quench process. However its Tg has been
reported to be subambient (13°C) (Kim et al., 1997). The mixture GFMN50 was prepared as
described above and analysed by DSC (Figure 3). HPLC was used to ensure that no degradation
12
peak at 166°C. The comparison between this Tg and that of pure GF suggests that this
amorphous composite is mainly composed of GF and contains only a limited amount of MN.
This assumption is strengthened by the presence of the subsequent significant endothermic peak
corresponding to the melting of the crystalline fraction of MN remaining post-process (MN raw
material melts at 166.8°C). This single DSC scan shows that crystalline MN exhibits a limited
solubility in amorphous GF and has therefore no effect on its Tg.
According to these thermal analyses these two sugars exhibit a poor chemical affinity with GF in
the amorphous state. Following our hypothesis, this observation leads us to expect that these
excipients will have a limited effect onreducing the amorphisation of GF upon comilling.
So far, only low molecular weight excipients have been reported to influence the crystallinity of
a given drug upon co-processing (Balani et al., 2010; Curtin et al., 2013a and 2013b). This is
mainly due to the fact that the number of polymeric low Tg excipients is rather limited.
Polyethylene (PEG) glycol is one such excipient. PEG exhibits a glass transition around -22°C
and a low melting point (58°C) (Perkin Elmer DMA 8000 Application literature, 2011). This
polymer has also been tested for Tg reduction, using the same protocol as described above. The
thermogram of GFPEG50 is presented in Figure 4.
As for GFMN50 and GFAA50, GFPEG50 exhibits a Tg followed by a melting endotherm (at
-1.3°C and 36°C respectively). It can therefore be concluded that this system is also a biphasic
system made of an amorphous phase and a fraction of remaining crystalline excipient. The glass
13
melting at 220°C) it can be surmised that the Tg occurring at -1.3°C is that of an amorphous
composite of GFPEG. Moreover, TLC analyses revealed no chemical degradation of PEG to
lower molecular weight analogues.
According to the significant Tg shift and based on our methodology, PEG should therefore have
a major impact on the amorphous content of GF upon comilling.
3.2. Comilling.
GF was not fully pXRD amorphous post milling (Figure 5). In order to quantify the
amorphous content of a given system by DVS analysis, a fully amorphous sample is needed to be
used as a standard. Hence, the experimental conditions under which GF could be fully
amorphised had to be determined. It has been reported in the literature that decreasing the milling
temperature favours amorphisation (Descamps et a., 2007). We therefore chose to mill GF at a
lower temperature: 4°C. The pXRD pattern of GF milled for 17 hours at 4°C is shown in Figure
5 and displays a diffuse halo which is typical of an amorphous material. It can be seen that the
residual peaks present on the pXRD pattern of GF milled at room temperature have disappeared
in that processed at 4°C. At this low temperature, GF is pXRD amorphous and was therefore
used as the fully amorphous standard for DVS analyses.
The amorphous content of the GF sample milled at room temperature was determined by DVS
through a method similar to that developed by Macklin et al. where the difference in mass uptake
between the first and second sorption cycles correlates with amorphous content (Macklin et al.,
2002). As shown in Figure 6, the reference material (GF milled at 4°C) reached a maximum
mass uptake of 1.296% at 60% P/P0 followed by a sharp mass loss at 70% P/P0 indicating that
14
due to the crystalline state’s lower ability to absorb moisture. No mass loss was observed during
this cycle indicating that the recrystallisation that occurred during the previous first sorption was
complete. Thus the difference in mass uptake at 60 % P/P0 was used in the quantification
calculations.
Figure 7 displays the sorption cycles of GF milled at room temperature. Since the %P/P0 steps at
which the maximum mass uptake and the crystallisation occur (60% and 70% respectively) were
already determined, the %P/P0 was directly increased to these values.
This method determined an amorphous content of 72 % for the sample milled at room
temperature, in accordance with pXRD analysis. The same process (milling for 17 hours at room
temperature) was performed on the different API/excipient mixtures: GFGA50, GFAA50,
GFMN50, GFXY and GFPEG50. The resulting materials were subsequently analysed by pXRD
and their amorphous content was quantified by DVS analysis as described above. The results are
displayed in Figure 8.
These patterns can be divided into two groups: GFGA50, GFAA50 and GFPEG50 present sharp
diffraction peaks belonging to griseofulvin and GFMA50 and GFXY50 have low intensity Bragg
peaks. These observations are confirmed by DVS analyses, which indicated a very low
amorphous content for the samples comilled with GA, AA and PEG, whereas for the two sugars,
MA and XY, the amorphous content is significantly higher and similar to that observed for GF
milled alone. It should be noted that since MA and XY are known to be amorphisable, a fraction
of excipient could be amorphised during the comilling process. If so, it would give rise to an
overestimation of the amorphous content when measured by DVS (Curtin et al., 2013a). This
15
However the comparison of the pXRD patterns clearly shows that MA and XY have almost no
effect on the amorphisation of GF. On the other hand since GFPEG50 shows no amorphous
content and, given the fact that GA and AA have been reported to remain fully crystalline upon
milling, the results obtained by the DVS method on these 3 systems are therefore reliable. Based
on these results it can be concluded that GA, AA and PEG are the most effective excipients at
mitigating the amorphisation of GF, especially GA and PEG for which the materials were almost
fully crystalline post milling, while MA and XY exert only a minor effect on the amorphisation
of the API.
In order to compare the results observed on processed materials with the predictions stemming
from the DSC screening, the data have been summarised in Table 1. Each excipient has been
rated based on its effect on glass transition: “++” if the Tg is decreased down to room
temperature (25°C) or below, “+” if the Tg is reduced but remains above room temperature and
“–” if no significant Tg reduction is observed. The table very clearly shows that the data obtained
for the comilled composites are largely in line with those predicted by the DSC screening
process. According to the Tg reductions observed by DSC, it was predicted that GA and PEG
would have the most pronounced effect on the amorphisation of GF (2% and 0% of amorphous
content respectively), that AA would mitigate the amorphisation but that its effect would be less
marked than PEG and GA (11%). The fact that neither MA nor XY would have any positive
effect on GF upon milling, despite their own low Tg, was also anticipated and could even be
explained by a lack of chemical affinity between the excipients and the API. This agreement
between the DSC screening and the results directly observed on comilled samples demonstrates
16
has the best potential for the mitigation of amorphisation upon milling by a single DSC
[image:16.612.109.503.173.341.2]experiment.
Table 1. Summary of the effectiveness of each excipient and the viability of the screening process for GF based systems
Compound GF GA AA PEG MA XY
Tg (°C) 93.1 19.2 49.2 -1.3 89.9 90.2
Ability to reduce Tg NA ++ + ++ - -
Amorphous content
after milling 72±2% 2±2% 11±3% 0% 65±1% 80±2%
Agreement with
Screening process N/a Yes Yes Yes Yes Yes
In order to validate and extend this new screening approach, this method has been applied to
another API - budesonide. The aim was to determine if it is possible to predict the ability of a
given excipient to reduce the amorphisation of an API from theoretical data without running any
experiment. Indeed, as shown above the only two parameters that have to be taken into account
are the Tg of the excipient and its ability to form a solid solution with the API. Since the Tg of
the excipient is usually known, one only has to determine the affinity between the molecules.
The latter can be estimated through the calculation of the Hildebrand solubility parameter. This
parameter is based on regular solution theory and is calculated by using the Fedors’ group
contribution method (Fedors, 1974). The Hildebrand solubility parameter provides a numerical
estimate of the degree of interaction between materials, and can be a good indication of
solubility. Materials with similar solubility parameters will be able to interact with each other,
17
the excipient the higher the affinity between the two molecules. Although quantitative
information, such as the value of solubility, cannot be derived from this parameter, a trend can be
deduced. It usually accepted that if |Δδ| between two compounds A and B is higher than 10
MPa1/2 immiscibility is expected (Greenhalgh, 1999).
BD has a solubility parameter of 27.2 MPa1/2 which is similar to that of GF (24.6 MPa1/2).
Similar behaviour should therefore be expected between these two APIs and the series of
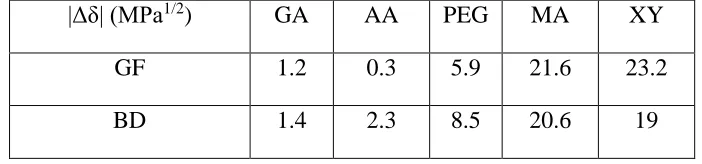
[image:17.612.130.481.323.405.2]excipients. Table 2 presents the |Δδ| values between the APIs, GF and BD, and the excipients.
Table 2. Summary of the differences between Hildebrand solubility parameters |Δδ| of GF and BD based systems.
|Δδ| (MPa1/2) GA AA PEG MA XY
GF 1.2 0.3 5.9 21.6 23.2
BD 1.4 2.3 8.5 20.6 19
As expected the trend of the |Δδ| values of the excipients and both APIs is similar. GA, AA and
PEG present a low |Δδ| relative to BD and GF (lower than 10 MPa1/2) whereas MA and XY both
have significantly higher |Δδ| values relative to both APIs (higher than 10 MPa1/2). These results
show that BD, as well as GF, exhibits good miscibility with the dicarboxylic acids and PEG and
poor molecular compatibility with both sugars. These excipients can therefore be divided into
two groups: GA, AA and PEG, rated “+” for their good solubility in BD, and MA and XY rated
“-“ for their poor solubility in BD, based on Hildebrand solubility parameters.
As for GF, these data have been assessed in relation to experimental results of pXRD and DVS
analysis of BD comilled with the different excipients. BD was determined to be pXRD
18
therefore processed under the same conditions. Results of pXRD and DVS analysis of
co-milled samples are displayed in Figure 9.
The pXRD patterns of BDGA50, BDAA50 and BDPEG50 show sharp diffraction peaks
belonging to BD. This shows that the crystallinity of the API in these samples is relatively high
and is confirmed by the amorphous content measured by DVS: 2%, 0% and 29% for BDGA50,
BDPEG50 and BDAA50 respectively. However, as in the case of GF, MA and XY appear to be
ineffective in retaining the crystallinity of BD, as shown by the diffractogram of BDMA50 and
BDXY50 and their respective amorphous content (94% and 74%) determined by DVS
measurements.
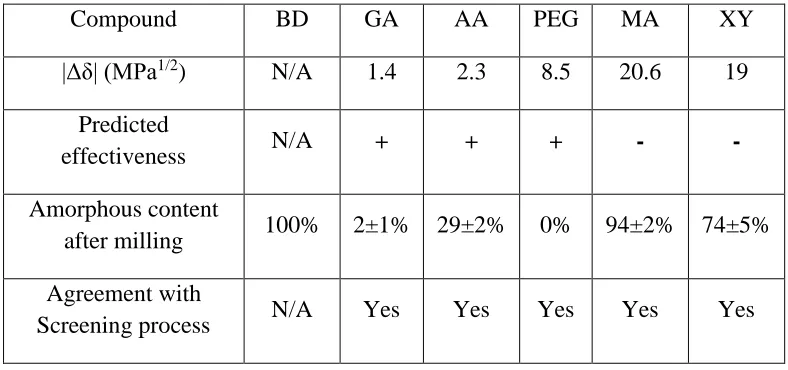
The expected effectiveness determined by theoretical calculations through the Hildebrand
solubility parameters as well as the experimental results obtained on the comilled samples have
[image:18.612.109.503.469.654.2]been compared and summarised in the Table 3 in order to estimate the usefulness of this method.
Table 3: Summary of the effectiveness of each excipient and the viability of the screening process for BD based systems
Compound BD GA AA PEG MA XY
|Δδ| (MPa1/2) N/A 1.4 2.3 8.5 20.6 19
Predicted
effectiveness N/A + + + - -
Amorphous content
after milling 100% 2±1% 29±2% 0% 94±2% 74±5%
Agreement with
19
This table shows a good agreement between the theoretical predictions and the experimental
observations. The calculation of the Hildebrand solubility parameter appears to be successful in
determining the compatible excipients for a given API. However it should be noted that even if
an excipient is not soluble in an amorphous API it can still form a metastable ‘temporary’
molecular alloy/solid isolution. Indeed, as a solution can be supersatured, an amorphous phase
can also exhibit a solute concentration higher than its solubility, as shown by Mahieu et al.
(Mahieu et al., 2013).
One has therefore to take the coupled Tg/solubility into account in order to predict efficiently the
behaviour of the API/excipient composite upon milling. The decision tree displayed in Figure 10
summarises the general methodology developed in this study.
4. Conclusions
This study set out to produce a screening process that would allow for the ability of an excipient
to reduce the amorphisation of an API by comilling to be predicted in advance of the milling
process. Our predictive model was successful in screening crystalline excipients to mitigate
amorphisation in APIs on comilling. We have shown that a compound with both a low Tg and
high solubility in the API should significantly reduce the Tg of the melt-quenched composite and
will therefore be a promising candidate for retaining the crystallinity of an API by comilling. The
rationalisation of these phenomena allowed the determination of suitable excipients for
mitigating amorphisation through either a limited number of experiments (melt quench and
20
not only enabled the design of a rational screening method but also confirmed and reinforced the
mechanisms previously hypothesised by Curtin et al. Indeed their hypothesis had only been
verified on two sulfonamide derivatives so far (sulfadimidine and salbutamol sulphate). The
present work showed that this approach can be extended to other APIs such as griseofulvin and
budesonide. Moreover this study constitutes the first report of the mitigation of amorphisation of
an API by comilling with a polymeric excipient (PEG). These results show that this method can
be applied to a variety of couple ‘API/excipient’ as soon as the two requirements of low Tg of
the excipient and good solubility of the excipient in amorphous API are met.
Acknowledgement: This work was supported by Science Foundation Ireland (Grant No.
07/SRC/B1158, 12/RC/2275 and 12/IP/1408).
References
Amharar, Y.; Curtin, V.; Gallagher, K. H.; Healy, A. M. Solubility of crystalline organic compounds in high and low molecular weight amorphous matrices above and below the glass transition by zero enthalpy extrapolation. Int. J. Pharm. 2014, 472, 241−247.
Balani, P. N.; Ng, W. K.; Tan, R. B. H.; Chan, S. Y. Influence of excipients in comilling on mitigating milling-induced amorphisation or structural disorder of crystalline pharmaceutical actives. J. Pharm. Sci. 2010, 99 (5), 2462−2474.
21
Curtin, V.; Amharar, Y.; Gallagher, K. H.; Corcoran, S.; Tajber, L.; Corrigan, O. I.; Healy, A. M. Reducing mechanical activation-induced amorphisation of salbutamol sulphate by co-processing with selected carboxylic acids. Int. J. Pharm. 2013, 456(2), 508−516.
Descamps, M.; Willart, J. F.; Dudognon, E.; Caron, V. Transformation of pharmaceutical compounds upon milling and co-milling: The role of Tg. J. Pharm. Sci. 2007, 96 (5), 1398-1407.
Dudognon, E.; Willart, J-F.; Caron, V.; Capet, V.; Larsson, T.; Descamps, M. Formation of budesonide/α-lactose glass solution by ball-milling. Solid State Commun. 2006, 138, 68-71.
Fedors, R.F. A method for estimating both the solubility parameters and molar volumes of liquids. Poly. Eng. Sci. 1974, 14, 147-154.
Greenhalgh, D. J.; Williams, A. C.; Timmins, P.; York, P. Solubility parameters as predictors of miscibility in solid dispersions. J. Pharm. Sci. 1999, 88 (11), 1182−1190
Gusseme, A. D.; Neves, C.; Willart, J. F.; Rameau, A.; Descamps, M. Ordering and disordering of molecular solids upon mechanical milling: the case of fanaserine. J. Pharm. Sci. 2008, 97 (11), 5000-5012.
Hancock, B. C.; Zografi, G. Characteristics and significance of the amorphous state in pharmaceutical systems. J. Pharm. Sci. 1997, 86 (1), 1-12.
Kim, A.L.; Akers, M. J.; Nail, D. L. The physical state of Mannitol after freeze drying: effects of mannitol concentration, freezing rate, and a non-crystallizing co-solute. J. Pharm. Sci. 1997, 87(8), 931-5
Macklin, L.; Zanon, R.; Park, J. M.; Foster, K.; Opalenik, H.; Demonte, M. Quantification of low levels (< 10 %) of amorphous content in micronized active batches using dynamic vapour sorption and isothermal microcalorimetry. Int, J. Pharm. 2002, 231 (2), 227-236.
Mahieu, A.; Willart, J-F.; Dudognon, E.; Danède, F.; Descamps, M. A New Protocol To Determine the Solubility of Drugs into Polymer Matrixes. Mol. Pharmaceutics 2013, 10, 560−566.
Mannitol BP 2013. British Pharmacopoeia, 2013. Volume I & II (Monographs: Medicinal and Pharmaceutical Substances, The Stationery Office, London, England).
Padfield, T.; Winsløw, J.; Pedersen, W.B.; Glastrup, J. Decomposition of polyethylene glycool (PEG) on heating ICOM Conference, 1990, 243–245.
22
Pokharkar, V. B.; Mandpe, L. P.; Padamwar, M. N.; Ambike, A. A.; Mahadik, K. R; Paradkar, A. Development, characterization and stabilization of amorphous form of a low Tg drug Powder Technol. 2006, 167 ( 1) 20– 25.
Shah, B.; Kakumanu, V. K.; Bansai, A. K. Analytical techniques for quantification of
amorphous/crystalline phases in pharmaceutical solids. J. Pharm. Sci. 2006, 95(80), 1641-1665.
Sorbitol Monograph. British Pharmacopoeia, 2007.
Trotta, M.; Gallarate, M.; Garotti, M. E.; Morel, S. Preparation of griseofulvin nanoparticles from water-dilutable microemulsions. Int. J. Pharm. 2003, 254(2), 235-242.
Willart, J. F.; Carpentier, L.; Danède, F.; Descamps, M. Solid-state vitrification of crystalline griseofulvin by mechanical milling. J. Pharm. Sci. 2012, 101, 1570–1577.
Willart, J.F.; Descamps, M. Solid state amorphisation of pharmaceuticals. Mol. Pharmaceutics
2008, 5 (6), 905-920.
Yu, L. Amorphous pharmaceutical solids: preparation, characterization and stabilization.
23
Figure captions
Figure 1: pXRD patterns of raw GA, AA, MA, XY and PEG.
Figure 2: DSC thermograms of melt-quenched GF, GFGA50 and GFAA50.
Figure 3: DSC thermograms of melt-quenched GF, XY, GFXY50 and GFMN50.
Figure 4: DSC thermograms of melt-quenched GF and GFPEG50
Figure 5: pXRD patterns of raw GF, GF milled at 25°C and GF milled at 4°C.
Figure 6: DVS sorption profile of GF milled for 17 hours at 4°C.
Figure 7: DVS sorption profile of GF milled for 17 hours at 25°C.
Figure 8: pXRD patterns of the GF based systems. Also shown is the percentage amorphous content as determined by DVS analysis.
Figure 9: pXRD patterns of the BD based systems. Also shown is the percentage amorphous content as determined by DVS analysis.