Original Article
CYP2C9 and VKORC1 genotype-guided individualized
warfarin therapy in Chinese patients with acute
pulmonary thromboembolism: a randomized
controlled clinical study
Heng Jin1, Feng Jiang2, Jun Wei1, Ying Yao1, Hengjie Yuan3, Muming Yu1, Anlong Qi1, Yanfen Chai1
Departments of 1Emergency Medicine, 2Ophthalmology, 3Pharmacy, Tianjin Medical University General Hospital, Tianjin 300052, P. R. China
Received October 25 2016; Accepted December 21, 2016; Epub March 15, 2017; Published March 30, 2017
Abstract: To investigate efficacy and safety of genotype-guided individualized anticoagulant therapy with warfarin for acute pulmonary thromboembolism (APTE) patients in Han Chinese. Patients enrolled were randomly divided into genotype-guided group and control group. The genotype of VKORC1 and CYP2C9 for all the patients was analyzed using PCR and biochip technology. The warfarin dosages in genotype-guided group on 1-3 days were determined by dosing algorithm on platform (http://www.warfarindosing.org), while the dosage in control group was 3 mg/24 h. From the 4th day, dosages were modulated according to international normalized ratio (INR) and clinical conditions. Therapy lasted for 12 weeks. Record INR values frequently. The average time to reach INR target range 2-3 (Tf) in genotype-guided group was significantly shorter compared with control group (P < 0.001). The average time to reach stable warfarin dosage (Ts) in genotype-guided group was significantly less than that of control group (P < 0.001). The percentage of patients reaching stable warfarin dose within 3 weeks (67.8%) was higher in genotyping-guided group than that in control group (P < 0.001). However, during weeks 4 to 12, it showed no significant difference except for week 5. Occurrence rate of INR > 4 and bleeding events showed no statistical difference. INR fluctuation (fINR) at initial therapy was more apparent in control group than that in genotype-guided group.CYP2C9 and VKORC1 genotype-guided method could be more efficient than normal dosing method. The data here supplied evidence for supporting the individual therapy of warfarin in clinic for Han Chinese.
Keywords: Genotype-guided, warfarin, CYP2C9, VKORC1, individualized anticoagulant therapy, pulmonary embo-lism
Introduction
Pulmonary embolism (PE), being subset of venous thromboembolism (VTE)-the third lead-ing cause of cardiovascular-associated death, is a common disease being high disability rate and mortality [1]. It is usually caused by block-age of pulmonary artery or its branches due to embolic obstruction related to exogenous or endogenous substances [2]. Overall, thrombo-lytic therapy and anticoagulation therapy are the two main methods for PE, in which antico-agulation therapy is the mainstream treatment [3]. Warfarin is an oral anticoagulant applied for preventing and treating for kinds of thrombo-embolic events in clinic. Due to its evident
prov-en efficacy, low cost, and abundant clinical experience, warfarin is the most common anti-coagulant agent and widely considered as the mainstay of anticoagulant therapy [4]. There are millions of patients over the world relying on warfarin therapy, and about 2 million people started on warfarin annually in the United States alone [5].
over-anticoagu-lant, all of which could be fatal, thus sometimes monitoring is necessary. Currently, the com-mon index to evaluate the efficacy of warfarin is international normalized ratio (INR). According to this biomarker for bleeding events [4], the warfarin dosage could be modulated in order to ensure the efficacy and safety.
Increasing studies have indicated that dose-response relationship of warfarin is highly vari-able, both interindividually and interethnically [6-8]. The polymorphisms of both metabolic enzyme CYP2C9 and target gene VKORC1 (Vitamin K epoxide reductase subunit 1) of war-farin in combination with ages and body-sur-face area have been reported to be able to explain about 50% of warfarin variability [9]. Up to 47% and 2-27% of the warfarin variation could be explained by VKORC1 and CYP2C9 genotype polymorphisms, respectively [4, 10]. CYP2C9*1 (wild type) is the best common type in all the populations, with a percentage of 80% in Caucasians, and 95% in Han population, while CYP2C9*2 changes evidently in ethnics, with 10-15% in Caucasians, and basicly 0% in Chinese [11]. It is also demonstrated that *2 and *3 type have a reduced catabolic ability of warfarin, and patients carrying such variants needs a comparatively decreased dosage for therapy and a comparative long period to reach a stable warfarin dosage [12]. When come to VKORC1-1639 G > A, the distribution tenden-cies of VKORC1-1639 alleys are opposite in Caucasians and Chinese: in Caucasians, GG genotype occupies about 36%, and AA geno-type about 15%, while separately 1% and 83% for GG and AA genotype in Chinese [11]. A
previ-ous meta analysis [13] showed that Caucasian patients carrying one A alley will decrease the warfarin dosage by 25%, and two A alleys by 50%, while in Asian patients, carrying one A alley will decrease it by 14% and two A alleys by 38% [13]. Other researches have demonstrat-ed that carrying A alley implies a higher bledemonstrat-ed- bleed-ing risk, with incidence rate 4.9% for AA geno-type, 2.3% for GA genogeno-type, and 0.47% for GG genotype [14]. What’s more, it should be noted that Chinese population is multi-national, and this situation will plus additional efficacy and safety variation in China.
Several warfarin dosing algorithms based on genotype and clinical characteristics have been applied to the individualized anticoagulant ther-apy [15-18]. It should be noticed that these studies confirmed superiority of genotype-guid-ed warfarin anticoagulant therapy in certain aspects, mostly based on mixed races popula-tion [19-21], while studies on Han Chinese pop-ulation are more less [22]. The difference of gene polymorphism between Chinese and white race is apparent, and fundamentally, the average warfarin maintenance dose for Chinese population is lower than that of western popula-tion [23]. In order to aid to apply warfarin thera-py and improve symptoms for patients in China, the efficacy and safety of individualized warfa-rin anticoagulant therapy through genotype-guided method in Han Chinese population calls for an urgent confirmation.
[image:2.612.92.524.83.271.2]Therefore, the comparison between genotype-guided warfarin therapy and normal warfarin therapy for patients with PE in Han Chinese Table 1. Exclusion criteria for this study
Exclusion criteria Age < 18 years
Used to accept warfarin therapy
Has any contraindications for anticoagulation With serious infection
Abnormal liver function with ransaminase 2 times greater than normal values Abnormal kidney function with serum creatinine > 120 mmol/L
Hyperthyroidism with TSH < 0.1 mIU/L Congestive heart-failure (CHF) exists Patients with cancer
Accept aspirin, amiodarone, or rifampicin et al treatments which could influence the pharmacokinetics or phar-macodynamics of warfarin
Poor adherence
5597 Int J Clin Exp Med 2017;10(3):5595-5602 population may not only provide a meaningful
way for PE therapy in Han Chinese, but also pro-vide the epro-vidence for the efficacy and safety of genotype-guided individualized warfarin thera-py in Chinese population.
Materials and methods
Patients
The patients with acute pulmonary-thrombo-embolism (APTE) that scheduled for anticoagu-lant therapy were recruited in this study. All the patients were hospitalized in the Emergency Medicine Department of Tianjin Medical Uni- versity during July 2014 to December 2015. The patients were diagnosed according to the Chinese expert consensus on the diagnosis and management of acute pulmonary embo-lism (Supplementary 1). The exclusion criterion was described in Table 1. Detailed demograph-ic information of investigated population was summarized in Table 2. The study was conduct-ed in accordance with Declaration of Helsin- kiand. All the procedures were approved by the Ethics Committee of hospital. Each subject pro-vided with written informed consent before participation.
Study design and methods
The study is a randomized, single-blinded con-trolled trial. The patients were randomly as-
signed to either the genotype-guided group or control group. The genotyping information and basal INR value for all the patients were deter-mined before the start of therapy.
Genotyping process was performed as follows: A venous blood sample was taken from every subject. Patients’ DNA was extracted by com-mercial blood DNA extraction kits (Bai’AOCO. Ltd., Shanghai, China) and then amplified th- rough PCR technology. The genotyping informa-tion was obtained from biochip (BE 2.0) through hybridization (by e-Hyb automated hybridiza-tion instrument, BR-526-24) of the amplified products with the commercial kits for CYP2C9 and VKORC1.
With the individual genotyping information, the warfarin dosages for the genotype-guided gr- oup patients on day 1-3 were calculated from the algorithm on website http://www.warfarin-dosing.org, supported by International Warfarin Pharmacogenetics Consortium (IWPC) and Gage [4]. While the initial loading dosage for the control group patients was set at 3 mg/24 h on the first 3 days, which is complying with the dosing regimen principle for Chinese popula-tion. After the first 3 days, the dosage for the two groups were all modulated according to personal INR values and the clinical require-ments. The baseline INR value for each subject should be determined on the first day.
All patients were followed up for 12 weeks, with INR measured on day 0 (one day before the trial started), day 1, 4, 6, 8, 15, 22, 28, 56, 70, and 84. If the clinical needs exist, some patients could have additional clinic visits and INR mea-surements. During this period, the outcome measures related to the efficacy and safety should be recorded.
Outcome measures
[image:3.612.92.525.84.153.2]Besides daily warfarin dosage for each subject, several outcome measures were used to record and evaluate the efficacy of warfarin. Firstly, Tf, Table 2. Demographic information for patients who completed the whole study
Number Gender Age Height Height Body surface area
Control 123 63/60 68 ± 12 165.8 ± 8.2 67.2 ± 10.9 1.09 ± 0.14
Genotype-guided group 115 57/58 69 ± 12 166.2 ± 8.5 67.1 ± 11.3 1.09 ± 0.14
test values x2=0.065 t=-0.229 t=-0.372 t=0.05 t=0.014
P 0.799 0.819 0.710 0.960 0.989
Table 3. Genotyping information for patients in genotype-guided group and control group
Genotype-guided
group (N=115) Control group (N=123) CYP2C9 (n/%)
*1*1 99/86.09% 104/84.55%
*1*3 16/13.91% 16/13.01%
*3*3 0/0% 3/2.44%
VKORC1 (n/%)
AA 93/80.87% 104/84.5%
GA 22/19.13% 19/15.45%
[image:3.612.92.287.199.329.2]means the time to reach the target INR range for the first time (2 ≤ 2mea3). Secondly, Ts, means the time to reach a stable warfarin dos-age (at which the measured INR values main-tained in the range of 2-3 for at least 3 times (≥ 7 days), continuously. Thirdly, the percentage of patients in the two groups who have reached maintenance warfarin dosage in each week from 3rd week to 12th week, separately. The
baseline INR values for the two groups were also determined. The secondary outcome mea-sure is the incidence of INR > 4 and adverse events (AE), such as gum bleeding, skin pete-chia and other bleeding events. Finally, we have also spared attention to the INF fluctuation (fINR) for the two groups at the initial therapy.
Statistical analysis
All analyses were carried out with the SPSS software (version 19.0). Apply the nonparamet-ric Kolmogorov-Smirnov test method to verify normal distribution. The data which followed the normal distribution was expressed as Mean ± SD. Two-sample-independent t test was used to compare between the two groups. A nominal two tailed P < 0.05 was considered as statisti-cally significant.
Results
Demographic information for patients
Overall, 264 patients were enrolled in this study and 238 patients completed the whole study. The demographic information of patients was
summarized in Table 2, and the parameters such as gender, age, height, weight, body sur-face area were compared between the two groups, however, there existed no statistical difference.
Genotyping information for patients
The genotype distribution of CYP2C9 and VKORCl was shown in Table 3. In the genotype-guided group, the majority of patients were indi-viduals with CYP2C9*1*1 genotype, account-ing for 86.09% (n=99), the minority patients were individuals with CYP2C9*l*3 genotype, accounting for 13.91% (n=16), and there was no CYP2C9*3*3 genotype in all the patients. VKORCl AA genotype was identified in 80.87% of the patients (n=93), VKORCl GA genotype was identified in 19.13% (n=22), and there was no VKORCl GG genotype in the whole patients. In addition, in the control group, the percentage of CYP2C9*1*1 was 84.55% (n=104), 13.01% for CYP2C9*l*3 (n=16), and 2.44% for CY- P2C9*3*3 patients (n=3), while the percent-age of VKORCl AA was 84.5% (n=104), 15.45% (n=19) for VKORCl GA, and there were no patients with VKORCl GG genotype in this group.
Outcome measures in the in genotype-guided group and control group
During the 12-week follow up period, Tf, Ts and the percentage of patients reaching the stable warfarin dosagein each week from the 3rd week
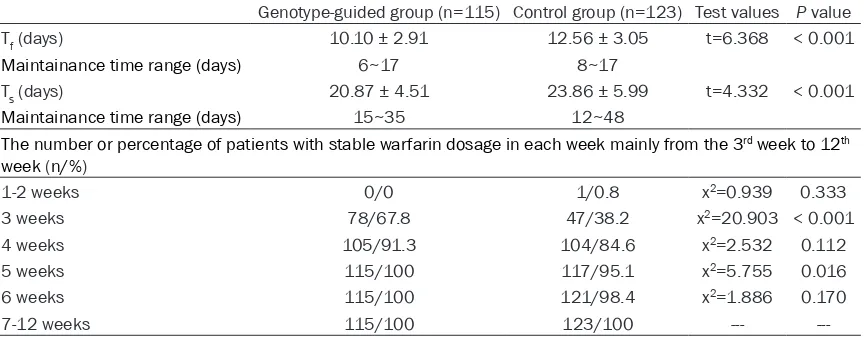
[image:4.612.92.524.86.255.2]to the 12th week were summarized in Table 4. Table 4. Outcome measures in genotype-guided group and control group
Genotype-guided group (n=115) Control group (n=123) Test values P value
Tf (days) 10.10 ± 2.91 12.56 ± 3.05 t=6.368 < 0.001
Maintainance time range (days) 6~17 8~17
Ts (days) 20.87 ± 4.51 23.86 ± 5.99 t=4.332 < 0.001
Maintainance time range (days) 15~35 12~48
The number or percentage of patients with stable warfarin dosage in each week mainly from the 3rd week to 12th
week (n/%)
1-2 weeks 0/0 1/0.8 x2=0.939 0.333
3 weeks 78/67.8 47/38.2 x2=20.903 < 0.001
4 weeks 105/91.3 104/84.6 x2=2.532 0.112
5 weeks 115/100 117/95.1 x2=5.755 0.016
6 weeks 115/100 121/98.4 x2=1.886 0.170
7-12 weeks 115/100 123/100 ---
---Note: Tf means the time to reach the target INR range (2 ≤ INR ≤ 3) for the first time; Ts means the time to reach stable warfa
5599 Int J Clin Exp Med 2017;10(3):5595-5602 The mean Tf of genotype-guided group was
10.10 ± 2.91 days, with during time being 6-17 days. Tf showed a significant difference in com-parison with control group (12.56 ± 3.05 days, 8-17 days, P < 0.001). The mean Ts for the patients in genotype-guided group was 20.87 ± 4.51 days, with during time being 15-35 days, which had a significant difference compared with control group (23.86 ± 5.99 days, 12-48 days, P < 0.001). The percentage of patients who reach the stable warfarin dosage for geno-typing-guided group in the 3rd week was 67.8%,
38.2% for control group. Thus, there existed significantly difference while it was compared (P < 0.001). What is more, the percentage was 100% in genotyping-guided group and 95.1% in control group in the 5fh week with P value of
0.016. Except for the 3rd and 5th week, there
was no significant difference in this percentage between the two groups from the 4th week to
12th week (P > 0.05).
Side effect and INR fluctuation
As described previously, the adverse events, especially bleeding events were carefully mo- nitored. The results indicated that the inci-dence of adverse events in the genotype-group (19.1%) was lower than that in control group (29.3%), with no significant difference (x2=
2.813, P=0.094) (Table 5).
The fluctuation in INR during the 12 weeks for the two groups was separately shown in Figure 1. The average baseline INR values for geno-type-guided group and control group were 1.0106 ± 0.05891 and 1.0024 ± 0.07518, respectively, which showed no significant differ-ence (t=-0.929, P=0.354). As shown in Figure 1, Tf and Ts of the genotype-guided group was shorter than that of the control group. The fluc-tuation difference of INR between the two groups was more apparent at the initial therapy stage than that at the later stage, which basi-cally no difference between the two groups. Discussion
There are several studies aimed to prove whether genotype-method has superiority over the normal method in warfarin study. Pirmoha- med et al has shown that patients had a reduced time to reach the target INR and the stable warfarin dosage in the United Kingdom and Sweden [9]. A study carried by Wang M also has demonstrated that patients with rheumatic heart disease in Han Chinese had a deceased time to maintain a stable dosage with geno-type-guided therapy after valve replacement [24]. In our study, Tf and Ts in the genotype-guid-ed group was shorter than that in the control group with significant difference (P < 0.0001). The results in Han Chinese with acute pulmo-nary-thromboembolism (APTE) were basically complied with previous data. In the 3rd week of
the follow-up period, the percentage of patients who reach the stable warfarin dosage in the 3rd
week was higher in the genotyping-guided group (67.8%) than that in control group (38.2%) with significant difference (P < 0.001). The results have confirmed the efficacy of geno-type-guided regimen by reducing Tf and Ts in Han Chinese patients with APTE.
[image:5.612.91.288.109.214.2]In clinical practice, it usually needs several weeks to reach the therapeutic INR, while it will be much longer for patients carrying variant Table 5. Incidence rate of adverse events in
genotype-guided group (n=115) and control group (n=123)
Genotype-guided
group (n/%) Control group (n/%) INR > 4 14 (12.2%) 18 (14.6%) Gum bleeding 2 (1.7%) 4 (3.3%) Skin petechia 3 (2.6%) 8 (6.5%) Blood in stool 0 (0%) 2 (1.6%)
Hematuria 3 (2.6%) 4 (3.3%)
Summary 22 (19.1%) 36 (29.3%)
[image:5.612.91.286.119.408.2]alleys like CYP2C9 *2 and *3 which could increase the risk of adverse events [12]. Variant alleles of VKORC1-1639 also lead to different incidence ratios of bleeding risk, 4.9% for AA genotype, 2.3% for AG genotype, 0.47% for GG genotype [14]. With reducing the time needed to achieve target INR and stable warfarin dos-age (Tf and Ts), the genotype-guided therapy could possibly reduce the ADR incidence at the same time, though we have not found a signifi-cant difference in adverse events between the two groups in our study.
The incidence of INR ≥ 4 is treated as a surro-gate biomarker for adverse events [4]. We learned a conclusion from the research con-ducted by Pirmohamed et. that the incidence rate of INR ≥ 4 in the genotype-guided warfarin therapy was comparatively lower than control group [9], in contrary, the results of another study carried by Anderson stated that the inci-dence rate for INR values out of the target range in genotype-guided group was not lower than that of control group [25]. It is interesting that when Anderson’s result was analyzed through genetic subtypes grouping, the inci-dence in the subgroup with variant alleys was lower than that of control group [25]. In our study, the incidence rates for INR > 4 in geno-type-guided group and control group were com-parable, and there was no significant difference in the incidence of the bleeding events between the two groups. This may attribute to the small number cases who carried the variant alleys. The analysis according to the genetic subtype grouping in our study could be implemented in the future.
We have also investigated the fluctuation of the average INR values (fINR) for the two groups dur-ing the whole period (Figure 1). It is noticeable that the difference of fINR between the two groups was evident at the initial stage but basi-cally maintained at the platform level in latter stage. At the initial stage, the fINR of the geno-type-guided group was smaller than that of the control group. This characteristic may attribute to the different treatments for patients: the genotype-guided group was treated by the gen-otype-guided method on the first 3 days, while the control group accepted the loading dosage of 3 mg/24 h. At the latter stage, the warfarin dosages for all the patients were modulated
according to their individual INR values and clinical experience, thus the fluctuations of the two groups are nearly the same. The compara-tively small fluctuation at the initial range in the genotype-guided group may imply a more evi-dent and steady efficacy, which at the same time possibly reduce the adverse event inci-dence [4].
During more than 60 years of applying warfarin in clinical practice, we have accumulated abun-dant clinical evidence on its efficacy, safety, and genomics, but it seems not enough on the genotye-guided therapy for patients, especially for Han Chinese. Several literatures stated that genotype testing should be completed before warfarin therapy, then the warfarin dosage could be set according to the genotype poly-morphism and other effecting factors [4], while some other literatures and clinical practice indi-cated that although commercial technology of gene testing was available, genotype testing was not recommended. Thus further research-es in more diseasresearch-es, more districts and more populations will help to accelerate the valida-tion process for genotype-guided therapy method.
Conclusions
Above all, we could conclude that the genotype-guided method had an active role in reducing the time to reach the target INR value and sta-ble warfarin dosage in individualized warfarin therapy for Han Chinese patients with acute pulmonary embolism. The genotype-guided method had a certain clinical values in guiding the anticoagulation therapy at the initial stage. Our study could be supplied as an evidence for supporting the genotype-guided therapy of war-farin being more efficient, and help to expand warfarin therapy in China. Because of the low patients’ number and no consideration on the effect of smoking and diet states, the value of our study was limited. A more detailed study which considering more effect factors such as age, weight, height, smoking state, comorbidity etc. should be conducted for further analysis.
Acknowledgements
5601 Int J Clin Exp Med 2017;10(3):5595-5602 Disclosure of conflict of interest
None.
Address correspondence to: Heng Jin, Department of Emergency Medicine, Tianjin Medical University General Hospital, Tianjin 300052, P. R. China. Tel: (+86) 18622173232; E-mail: jinheng2016@163. com
References
[1] Roberts KM, Knight TB, Padilla-Tolentino E, Murthy M and Peterson EJ. Length of stay com-parison between rivaroxaban and warfarin in the treatment of pulmonary embolism: results from a real-world observational cohort study. Thrombosis 2015; 2015: 414-523.
[2] Yue KT. Diagnosis efficiency for pulmonary embolism using magnetic resonance imaging method: a meta-analysis. Int J Clin Exp Med 2015; 8: 14416-14423.
[3] Blondon M, Bounameaux H and Righini M. Treatment strategies for acute pulmonary em-bolism. Expert Opin Pharmacother 2009; 10: 1159-1171.
[4] Shaw K, Amstutz U, Kim RB, Lesko LJ, Turgeon J, Michaud V, Hwang S, Ito S, Ross C, Carleton BC; CPNDS Clinical Recommendation Group. Clinical practice recommendations on genetic testing of CYP2C9 and VKORC1 variants in warfarin therapy. Ther Drug Monit 2015; 37: 428-436.
[5] McWilliam A, Lutter RW and Nardinelli C. Health care savings from personalizing medi-cine using genetic testing: the case of warfa-rin. Washington DC: AEI-Brookings Joint Center for Regulatory Studies; 2006.
[6] Loebstein R, Yonath H, Peleg D, Almog S, Ro-tenberg M, Lubetsky A, Roitelman J, Harats D, Halkin H and Ezra D. Interindividual variability in sensitivity to warfarin--Nature or nurture? Clin Pharmacol Ther 2001; 70: 159-164. [7] Takahashi H, Wilkinson GR, Caraco Y, Muszkat
M, Kim RB, Kashima T, Kimura S and Echizen H. Population differences in S-warfarin metab-olism between CYP2C9 genotype-matched caucasian and Japanese patients. Clin Phar-macol Ther 2003; 73: 253-263.
[8] Zhao F, Loke C, Rankin SC, Guo JY, Lee HS, Wu TS, Tan T, Liu TC, Lu WL, Lim YT, Zhang Q, Goh BC and Lee SC. Novel CYP2C9 genetic variants in Asian subjects and their influence on main-tenance warfarin dose. Clin Pharmacol Ther 2004; 76: 210-219.
[9] Pirmohamed M, Burnside G, Eriksson N, Jor-gensen AL, Toh CH, Nicholson T, Kesteven P, Christersson C, Wahlstrom B, Stafberg C,
Zhang JE, Leathart JB, Kohnke H, Maitland-van der Zee AH, Williamson PR, Daly AK, Avery P, Kamali F, Wadelius M; EU-PACT Group. A ran-domized trial of genotype-guided dosing of warfarin. N Engl J Med 2013; 369: 2294-2303.
[10] Wadelius M, Chen LY, Eriksson N, Bumpstead S, Ghori J, Wadelius C, Bentley D, McGinnis R and Deloukas P. Association of warfarin dose with genes involved in its action and metabo-lism. Hum Genet 2007; 121: 23-34.
[11] Lam MP and Cheung BM. The pharmacogenet-ics of the response to warfarin in Chinese. Br J Clin Pharmacol 2012; 73: 340-347.
[12] Higashi MK, Veenstra DL, Kondo LM, Witt-kowsky AK, Srinouanprachanh SL, Farin FM and Rettie AE. Association between CYP2C9 genetic variants and anticoagulation-related outcomes during warfarin therapy. JAMA 2002; 287: 1690-1698.
[13] Yang L, Ge W, Yu F and Zhu H. Impact of VKORC1 gene polymorphism on interindividual and interethnic warfarin dosage requirement--a systematic review and meta analysis. Thromb Res 2010; 125: e159-166.
[14] Lund K, Gaffney D, Spooner R, Etherington AM, Tansey P and Tait RC. Polymorphisms in VKORC1 have more impact than CYP2C9 poly-morphisms on early warfarin International Nor-malized Ratio control and bleeding rates. Br J Haematol 2012; 158: 256-261.
[15] Ekladious SM, Issac MS, El-Atty Sharaf SA and Abou-Youssef HS. Validation of a proposed warfarin dosing algorithm based on the genet-ic make-up of Egyptian patients. Mol Diagn Ther 2013; 17: 381-390.
[16] Gage BF, Eby C, Johnson JA, Deych E, Rieder MJ, Ridker PM, Milligan PE, Grice G, Lenzini P, Rettie AE, Aquilante CL, Grosso L, Marsh S, Langaee T, Farnett LE, Voora D, Veenstra DL, Glynn RJ, Barrett A and McLeod HL. Use of pharmacogenetic and clinical factors to pre-dict the therapeutic dose of warfarin. Clin Pharmacol Ther 2008; 84: 326-331.
[17] International Warfarin Pharmacogenetics C, Klein TE, Altman RB, Eriksson N, Gage BF, Kim-mel SE, Lee MT, Limdi NA, Page D, Roden DM, Wagner MJ, Caldwell MD and Johnson JA. Esti-mation of the warfarin dose with clinical and pharmacogenetic data. N Engl J Med 2009; 360: 753-764.
[19] Franchini M, Mengoli C, Cruciani M, Bonfanti C and Mannucci PM. Effects on bleeding compli-cations of pharmacogenetic testing for initial dosing of vitamin K antagonists: a systematic review and meta-analysis. J Thromb Haemost 2014; 12: 1480-1487.
[20] Tang Q, Zou H, Guo C and Liu Z. Outcomes of pharmacogenetics-guided dosing of warfarin: a systematic review and meta-analysis. Int J Cardiol 2014; 175: 587-591.
[21] Carlquist JF and Anderson JL. Using pharmaco-genetics in real time to guide warfarin initia-tion: a clinician update. Circulation 2011; 124: 2554-2559.
[22] Shin J and Cao D. Comparison of warfarin pharmacogenetic dosing algorithms in a ra-cially diverse large cohort. Pharmacogenomics 2011; 12: 125-134.
[23] Gan GG, Teh A, Goh KY, Chong HT and Pang KW. Racial background is a determinant factor in the maintenance dosage of warfarin. Int J Hematol 2003; 78: 84-86.
[24] Wang M, Lang X, Cui S, Fei K, Zou L, Cao J, Wang L, Zhang S, Wu X, Wang Y and Ji Q. Clini-cal application of pharmacogenetic-based warfarin-dosing algorithm in patients of Han nationality after rheumatic valve replacement: a randomized and controlled trial. Int J Med Sci 2012; 9: 472-479.