Journal ofthe Statistical and Social Inquiry Society of Ireland, Vol. XXIV, Part IV ,1981 /82, pp.217-244
THE NATURE AND CAUSES OF THE FARM INCOME PROBLEM
E. A. Attwood
(Read before the Society, 20 May 1982)
1. INTRODUCTION - THE INCOME SITUATION
In the current debate on national economic issues, the very grave situation that exists in the agricultural sector has tended to be regarded as of concern only to the farming community. While the impact of the current agricultural difficulties obviously impinges most directly on farmers, it, nevertheless, has most serious consequences for the growth of the economy as a whole, for the level of our balance of payments deficit and for the exchequer position.
The decline in agricultural output in recent years is one of the causes of the current low growth performance of the economy. The stagnation, and for some products the de-cline, in farm output has led to a fall in employment in the agricultural processing indus-tries and in indusindus-tries supplying farm inputs. It has also led to a stagnation in the level of farm exports which, in the face of rising imports, have contributed substantially to the balance of payments deficit in 1981. At the same time, there has been a considerable rise in the level of State expenditure in relation to agriculture. Even with this additional State expenditure, farmers' net incomes in recent years have fallen significantly below those in non-agricultural occupations.
Many farmers in Ireland are now experiencing very serious financial difficulties. These have arisen from the sharp decline in farm incomes since 1978, both in nominal and, even more so, in real terms. In nominal terms, incomes in agriculture from self-employment and other trading income have fallen from £835m in 1978 to £673m in 1980, with an improvement to £770m estimated for 1981 (see Table 1). In real terms (as measured by comparison with changes in the CPI)* this represents a fall of 34 per cent between 1978 and 1980, with no improvement in 1981. When allowance is made for the growth in in-terest payments, the fall in incomes is still greater - of the order of 50 per cent. Even with the decline in the agricultural labout force, this fall in real incomes per head must be regarded as of crisis proportions to the agricultural sector.
Dramatic income declines of this nature must inevitably generate a consideration of their causes and of what should be done to remedy the problem. It is now conventional wisdom to ascribe the cause of the decline in real farm incomes to inflation, i.e., to the increases in farm input prices and in the cost of living that has occurred since 1978 at a time when the changes in the level of prices for farm products have been very small. If the * situation over the past decade is analysed in detail, this is only a partial explanation.
Farm incomes are a consequence, not only of the relationships between the prices of farm products, farm inputs and consumer expenditures, but also of production efficiency, i.e., the volume of inputs and output. In addition, some income changes can be accounted for by changes in taxes and subsidies. Price and volumes are, of course, not entirely inde-pendent factors; the volume of inputs and output can be expected to respond to changes in their prices. Nevertheless, each of these - the price and volume of inputs and the price and volume of output - will be considered separately in this paper. The interaction *lt has become conventional in Ireland to deflate incomes by the Consumer Price Index, while the SOEC, Luxembourg, has consistently deflated by the GDP deflator (see Annex 1).
between them will then be considered subsequently.
While the maintenance of any given relationship between prices of farm inputs and output could, ceteris paribus, maintain farm incomes in nominal terms, the real value of these incomes depends upon movements in the CPI. For example, compared with the situation in 1975 (when the CSO began a new series of price indices of farm inputs and products), the CPI, by February 1982, had increased by 149.5 per cent, with prices of farm products increasing by 137.7 per cent, and prices of farm inputs increasing by 130.2 per cent. The drop in real farm incomes can, therefore, be explained in part by the effect of more rapid increases in the CPI than in the prices of farm outputs or inputs; there still remains, however, a substantial element of the problem not explained in this way.
These factors need to be considered over a number of years but this is, of course, dependent on the data that is available. It is proposed to focus on the period 1970-81, but with special emphasis on the more recent years, i.e., from the mid-seventies onwards. After the 50 per cent increase in real incomes between 1970 and 1973, the reversal, due to the cattle crisis, was even more serious than the income declines in 1979 or 1980. In terms of the farm income developments in the seventies, 1975 was a reasonable year. It was a year which saw a recovery from the short-lived decline of 1974, and preceded the rapid income growth which reached its peak in 1978. As this paper is concerned particu-larly with the last seven years or so, its primary purpose is to explain why the difference between price and income changes has occurred since then and to discuss the conse-quences of these changes.
2. TRENDS IN PRICES OF INPUTS AND OUTPUT
The changes in prices over the years from 1970 to 1981 are set out in Table 2. The index of input prices covers goods and services purchased by farmers for use in current consumption, e.g., seeds, feed, fertilisers, energy, veterinary services, etc. In the periods 1970-73, 1975-78 and again in 1981, the prices paid for farm products rose more rapidly than input prices; over the other years since 1970, prices for inputs went up somewhat faster than those for output. The most striking feature of the second half of the seventies is that, by 1981, the relationship between input and output prices is virtually the same as that in 1975, the difference in the two indices being just over 3 per cent by January 1982 with the prices paid to farmers having increased slightly more rapidly. In order words, for the period 1975 to 1981 taken as a whole, there has been virtually no cost/price squeeze in agriculture.
This period since 1975 splits into three distinct parts; 1975-78, 1979-1980, and 1981. In the first three years there was a sharp divergence in prices, with output prices increas-ing much more rapidly than input prices; by 1978 the increase in output prices was 74 per cent while the input price rise was much lower at 46.6 per cent. Since 1978 the re-verse has been largely true. In 1979 and 1980 output prices rose very little (they actually fell in 1979). Input prices, however, continued to rise relentlessly. It is for these years that the price squeeze on- farmers has been evident, with its consequential effects on incomes. For the most recent year, 1981, prices of output have risen much faster than those of inputs, i.e., 18.9 per cent as opposed to 14.8 per cent.
the very beneficial situation in the years from 1975 to 1978 will be readily repeated. The objective of bringing inflation down to European levels within the next two years is wide-ly acknowledged; as there is some reason to anticipate that farm price increases at EEC level may be set at around current EEC inflation rates, then agricultural growth and pros-perity will depend on the level of improvement in efficiency which is realised. This is the issue which is the focus of the latter part of this paper.
3. CHANGES IN THE VOLUME OF OUTPUT AND INPUTS
As price relativities of farm inputs and products today are the same as in the mid-seventies, why is there a farm income problem? Why are incomes in real terms more than 30 per cent below their 1975 level (and 40 per cent after allowance for estimated interest charges)? If price trends do not explain the cause of the decline in income, what then is the explanation? Is it to be found in the changes of volume of output and input? This section of the paper considers this question.
The trend in Gross Agricultural Output since 1970 has been one of increase, rising to a peak in 1978 but showing a small decline since then (see Table 3). For the 3 years 1978-80, inclusive, gross output has been around 10 per cent higher than the previous peak of 1975, but some fall occurred in 1981. In face of the financial problems of farmers over the past three years, their level of gross output has been remarkably steady.
Over the years since 1970, growth in the output of livestock and livestock products has been more rapid than in crops (although since 1973-75 crop output has increased more than livestock output). This growth in crop output is due almost entirely to the expansion in output of feeding barley, which increased by more than 100 per cent. The contribution of crops as a whole to total output is, however, relatively small so that changes in total farm output largely reflect trends in the output of livestock and livestock products.
The trend in livestock and crops can be seen from the changes in breeding herds of cattle, sheep and pigs and the acreage of the main crops (see Table 4). The total number of cows and the total cattle herd in 1981, while still substantially above the 1970 level, was 8 per cent below the 1974 peak, though the decline since 1974 has not been a uni-form one. In the case of sheep, while there has been a small increase shown in the 1981 Enumeration, the drop since 1973 has been over 18 per cent. Only pig numbers have regained their numbers of the early seventies, with the breeding herd now slightly above that in 1973. Within the livestock sector there has been a sharp difference between the increase in the output of livestock products (mainly milk) which was 29 per cent higher in 1981 than in 1975, and in livestock, which declined by 4 per cent over these years. Although weather obviously plays a part in determining both the level of output and the use of inputs, the deterioration in the weather over recent years, while of significance, does not seem to have been such as to explain the very substantial changes in the input-output ratio that have taken place in Irish agriculture. The trends in crop input-output, for example, would seem to indicate that the relatively slow growth in gross agricultural out-put in relation to the large increase in inout-puts is unlikely to have been due purely to weather factors. It is difficult to derive a satisfactory explanatory variable to measure the effects of weather and this is one of the issues on which further research work would be extremely useful. If there were good reasons to suggest that the weather was of itself the major factor in the changes in input-output relationships in recent years, then the current measures to stimulate agricultural growth would not appear to have been necessary; we could have waited for the weather conditions to revert to normal and, if this had been the major cause of the current problem of production efficiency, farm output would then
expand again while inputs would decline sharply. Clearly, such an approach is not a realis-tic solution to our current farm problems. There seems to be broad agreement that 'normal' weather would result in a considerable increase in farm output, perhaps of the order of 3 to 5 per cent for any given level of inputs or indeed for some decline in the use of inputs, but changes of this magnitude would not restore previous input-output levels nor resolve the income problem. ^
On the input side, the CSO volume index covers only the non-factor inputs (i.e., does not include labour, land or the longer-term capital items). The effect of changes in the volume of the factor inputs is considered later in this paper. The increase in inputs since the early seventies has been just over 50 per cent: growth in the first half of the decade was relatively slow but in the second half, it has been very rapid indeed (see Table 3). It is this very sharp increase in inputs, compared to the increase in output since the mid-seventies which is a major element of the current farm income problem. Compared with the mid-seventies, farmers are now using nearly 45 per cent more inputs to produce some 10 per cent more output. While the effects of diminishing returns would indicate an explanation as to why output could not reasonably be expected to rise in parallel with increased inputs, this does not give a satisfactory explanation of the trend in the input-output ratio in recent years, particularly when regard is taken of the vast potential for higher farm output which is widely recognised as a feature of Irish agriculture.
It would appear that this problem of the high use of inputs is now being recognised by the farmers themselves. A report in the Irish farming press on the Munster Farm Income Crisis Group^ contains proposals to reduce input levels over a very wide range; the Chair-man of this Group was quoted as saying that such an approach "was simply good business management practice" and "what it did mean was that the return on every input level of production was critically examined". This appears to indicate that a critical examination had not been made in the past but that a policy along these lines is urgently needed. It is clearly of the utmost importance that farmers ensure that their expenditure on inputs generate a worthwhile return. Such an approach would reverse the serious problems in production efficiency that have occurred since the mid-seventies. The data at aggregate level, however, conceals a very substantial variation in efficiency levels between farms. The achievements of the more efficient farmers are a testimony, both to the potential that is there and the ability of some of our farmers to realise that potential.
A recent edition of "Farm and Food Research" highlighted the very substantial in-comes which can be achieved on farms of 50-60 acres, in dairying, sheep, tillage, etc., given efficient management and high levels of production^ . The question as to why these levels of income or incomes approaching such levels are not far more common on Irish farms is of major importance and requires a far more complete answer than has been given so far.
4. CHANGES IN THE GROSS AGRICULTURAL PRODUCT
term, been an overall decline in the volume of agricultural product - a decline that has occurred in spite of the years of good prices and incomes as well as in the years of bad prices and declining incomes. This decline in the Gross Agricultural Product clearly shows that the problem we must resolve is not simply that the rate of increase in output has not kept pace with the rate of increase in inputs but that the difference in absolute terms between the volume of output and the volume of inputs needed to generate that output has diminished, i.e., that the extra inputs have been considerably greater in absolute terms than the extra output.
The contribution of agriculture to GNP in current terms was sustained over the good years by the price effect, so that the underlying deterioration had been masked. However, in years of poor prices, this medium or longer term decline has been evident and the over-all trend now stands out more clearly.
5. CHANGES IN THE VOLUME OF FACTOR INPUTS
The foregoing analysis has considered changes in the level of output and non-factor inputs. Could the serious picture that has emerged have been explained by the effects of the changes in the level of factor inputs, land capital and labour? In so far as land is con-cerned, the change in the area devoted to agriculture in Ireland has been small in relation to the total area involved. When account is taken of the amount of land improvement that has been undertaken during the past decade, the changes in the area of land in agri-cultural production are not of any real significance.
The changes on the investment side have been substantial. The amount of annual capital investment at current prices rose from £50m in 1970 to £342m in 1979, with some fall to £268m in 1980. Over the period 1970-80, the total amounted to £1750m, with depreciation accounting for just over £900m (see Table 6). At constant (1980) prices, this represents an increase in capital investment from £166m in 1970 to £268m in 1980, and a total of over £2,700m over these years, or £1300m after allowing for de-preciation. Using an average interest rate of, say, 10 per cent for the period as a whole, the total investment since 1975 would incur an annual interest charge of some £270m in 1981 (not allowing for investment in 1981 itself) and of £130m a year after allowing for depreciation.
Not all of this investment involved the farmer in outlay from his own resources. Part of the total was provided by Exchequer grants. There was also a very substantial increase in the level of borrowing from the lending institutions (see Table 7). Total loans outstan-ding from the main lenoutstan-ding institutions rose from £77m in 1970 to £214m in 1975 and to £1,059m in 1981. While this cannot be compared directly with the level of farm invest-ment over these years, it gives a clear indication that a considerable proportion of farm investment was undertaken with loan capital. The consequential problem of debt service has now become a major issue in farm development. ^
So far as the agricultural labour force is concerned, these years have seen a fall in the total numbers engaged in agriculture, from 262,000 in 1970 to 231,000 in 1975 and to 214,000 in 1980 (see Table 6)*. The average decline of 4,000 a year has itself been falling, in spite of the income problems in agriculture. The fall in the numbers working on farms is primarily of a longer term demographic character rather than immediately repon-sive to external push or pull factors.
In aggregate efficiency terms, the issue is whether the increase in capital investment has been fully worthwhile, given the changes in the ratio of output to non-factor inputs
*Due to a discontinuity in the Labour Force data in 1975, the data at the beginning and end of the decade are not strictly comparable.
and the fall in the labour force. As we have already seen, the ratio of output to non-factor inputs has itself declined over recent years, so that the level of capital investment has not been justified in terms of the replacement of non-factor inputs by capital. So far as the decline in the farm labour force is concerned, the fall of 48,000 since 1970 would, at current agricultural wage levels, result in a notional saving of around £124m at 1980 prices. Re-calculating the interest charges on the total investments since 1970 at 1980 prices gives a figure of £400m, or £190m after allowing for depreciation, even with an interest charge of only 15 per cent (and currently the average interest charge on farm borrowings would be higher). Thus, capital investment on the grounds of the financial savings on labour costs - both direct wage costs and implicit family wage costs - has not yielded a realistic return. Certainly, new investment in buildings, yards, machinery, etc., has eased the burden of farm work - but this investment has been at a high cost in terms of its effects on farm incomes. These improvements have, however, been beneficial to the farmer and his family and have eased the burden of drudgery on many family farms.
6. EFFECTS OF TECHNOLOGY
In order to get a full picture of the changes in the efficiency of production at farm level, it is necessary to take account, not only of the changes in factor and non-factor in-puts in relation to total output, but also the effects of long-term trends in the potential of Irish agriculture. This upward trend arises from the opportunities for improved resource combination due to structural changes, and the improved productivity of inputs arising from research and development work.
As has already been shown, total output changes over recent years have not been re-sponsive either to the increased levels of non-factor inputs or to the very much greater level of capital investment than the release of labour would have justified. At the same time, agricultural policy in Ireland has been based on the view that a substantial invest-ment by the State in research, education and advisory work is justified by the potential for improvement in efficiency in agriculture. This view has arisen mainly from the belief that efficiency in agricultural production in Ireland lags behind that in other Western countries and that there is a vast potential for improvement in the level of farm output per acre here which could be mobilised by additional advisory, research and educational work. The belief that this would lead to increased farm output and incomes and that it is, therefore, the key to the development of the agricultural sector in Ireland, has not been borne out by the experience of recent years.
It is not possible to determine in any absolute sense without substantial further analy-sis, the return which expenditure by the Exchequer in research, education and advisory work has generated. It is, of course, arguable that without it, the level of efficiency in Irish Agriculture would have been lower. However, we are currently spending on research, education and advisory work a sum equivalent to 5 per cent of the Gross Agricultural Product, and it is essential that we generate a worthwhile return on this investment in order to justify the considerable volume of Exchequer resources that are involved.
increase, and the gap which must be made up is not just the negative trend which has occurred, but this negative trend plus improvements in efficiency (i.e., output per unit of total inputs) which should have been realised from our very large expenditures on re-search, education and advisory work.
7. CHANGES IN EFFICIENCY IN THE DIFFERENT FARM ENTERPRISES
The changes in efficiency in the agricultural sector due to the rapid increase in inputs are not of a uniform nature but rather appear to be concentrated on particular inputs and particular products. So far as the inputs themselves are concerned, while the volume of all current inputs has increased since 1970 by 54 per cent, the increase of the farm materials' element (i.e., feed, fertilisers and seed) has been almost 58 per cent. Given that these farm materials account for some 65 per cent of total current inputs, it would appear that the increase in the volume of current inputs other than the farm material items has been of the order of 45 per cent. While this latter increase is still considerably larger than the increase in output, it is not, of itself, the major element in the total increase in the usage of inputs.
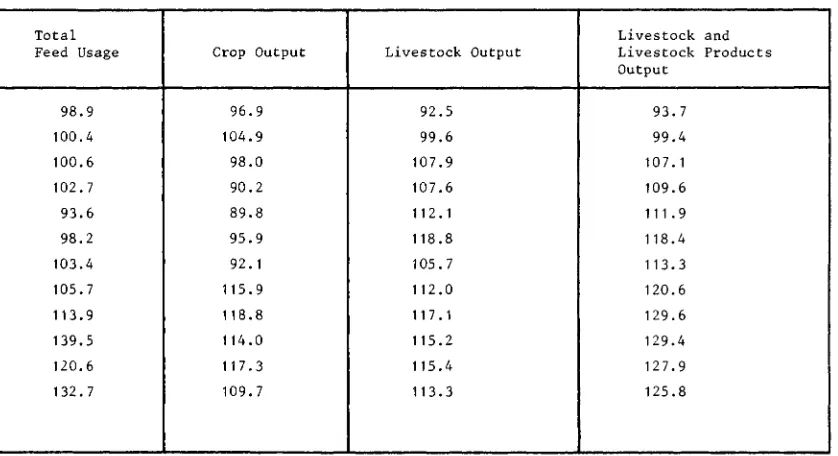
The important individual inputs which account for the major part of the problem are feedingstuffs and fertilisers. Fertilisers currently account for 21 per cent of total inputs, and feedingstuffs for about 41 per cent. The increase in fertiliser consumption since 1970 of almost 70 per cent has been very substantial indeed. Given that the increase in farm output has been limited, the claims that the level of fertiliser used per acre in Ireland is below the optimum level would seem to require further detailed consideration. The available evidence would suggest that even in the mid-seventies the level of fertiliser use on crops was close to the optimum and the generally accepted view has been that the major need was for additional fertiliser on grass. If most of the increased fertiliser usage (particularly since 1975) has, in fact, been on grassland, then the results in terms of extra livestock and livestock products has been disappointing (see Table 8(a)). The relationship is, however, further complicated by the problems of increased feed inputs, discussed below.
In the case of purchased feed, the average increase since 1970 of over one-third in the volume used varies widely as between the different livestock enterprises. Table 8(b) sets out a comparison of the increase in purchased feed used and the changes in output for the major enterprises. The most noticeable feature of this table is the extremely large increase in purchased feedingstuffs used for the production of cattle, milk and sheep, with little extra output. In the case of cattle and sheep, the 1981 output is virtually the same as the 1970-72 average, yet purchased feed has increased four-fold in the case of cattle and even more so in the case of sheep. In milk production, where purchased feed use has also gone up seven-fold, there has been an increase of around 46 per cent in output during the period 1971-81. Even allowing for the low level of feed usage in 1970-72, these ratios of extra feed to extra output are very serious. Farmers have substituted bought-in feed for home-produced feed on a substantial scale, to the detriment of the financial returns from their farm business. The reasons for this development are complex; weather factors have obviously been important but more analysis needs to be undertaken to assess the extent to which this factor has contributed to the changes that have taken place.
It is clear that a major problem in farm efficiency is that the increased level of grass-land output, in terms of livestock, has been small while feed use, and to a lesser degree fertiliser use, for grazing enterprises has increased sharply. Farmers have responded to the pressures to use extra feed and fertiliser inputs for grassland livestock enterprises but need to ensure that the level of output from these enterprises keeps pace with the higher level of inputs.
These sharp disimprovements in the feed/output ratios for the grassland livestock enterprises are in sharp contrast to the position in relation to the farmyard enterprise. The 20 per cent fall in purchased feed used for pig production since the early seventies has been achieved without any decline in the level of output. In the case of poultry, the situation is even more satisfactory - the increase of 24 per cent in output since 1970 being achieved with an increase of only 3.6 per cent in purchased feed use. While detailed figures on feedstuffs compounded by pig and poultry producers themselves are not avail-able, there is no evidence that developments of this nature are a major explanation of the improvements in the purchased feed/output ratio for these enterprises.
8. OTHER FACTORS IN THE DETERMINATION OF FARM INCOME
It has been shown that, while the decline in farm incomes over the past three years has been due primarily to the increase in input prices at a time when output prices have increased only very slightly, over the years since the mid-seventies prices of inputs and output have returned to their original relativities. The increase in the volume of inputs has, however, eroded the benefits to the farmer which the restoration of the price relativi-ties in 1981 should have brought.
Prices themselves are not, of course, outside the scope of policy. As already pointed out, the State provides support intended to improve agricultural output and incomes. Since 1973, these measures have flowed, not only from the State itself, but have been very greatly supplemented by the European Community (which, in this context, can be regarded as an extension of the State). The measures include not just those involving direct expenditures from the Community Budget but also those which provide benefits from other aspects of the Common Agricultural Policy, in particular the higher prices for farm products sold inside the Community due to the policy of Community preference. In addition, other factors also affect farm incomes - in particular the level of local taxes, subsidies not related to sales, etc.
So far as the level of State and EEC aid is concerned, the total has increased from less than £100m in 1970 to £211m by 1975 and to £623m in 1981 (see Table 9). For the past two years, the support provided by the State and the EEC has been equivalent to over 80 per cent of farm incomes. Of course, not all these support expenditures directly enter into farm product prices or subsidies. Part of these expenditures are contributions to farm investment, or to off-farm investments such as arterial drainage. They also include administrative costs as well as research, education and advisory expenditures. While these clearly do not directly provide part of the farmer's annual income, the basic justification of these expenditures is in their contribution to these incomes over the longer term. If the items represented by these expenditures do not contribute to improving farm incomes, then they should be discontinued.
9. CONCLUSION
The major conclusion of the above analysis is inescapable. The major problem of Irish Agriculture since the mid-seventies has been the decline in its competitiveness. Over the past three years, the cost/price squeeze has brought very serious consequences for agricul-tural incomes. The effects of this decline can be seen more graphically in the following illustration. Had the percentage increase in the volume of inputs since the mid-seventies generated a similar percentage increase in output, then farm incomes in 1981 would have been £1,330m, i.e., incomes would have been 70 per cent above the levels actually realised. While an assumption of a linear relationship between inputs and output takes no account of the effects of diminishing returns (or of any changes due to technical improve-ments arising from research, education, etc.), the size of the gap is such that it cannot be explained by any reasonable hypothesis about the rate of diminishing returns to addition-al factor use. Indeed, the pressure from many sources on farmers to increase their level of inputs, and the benefits that are portrayed, might suggest that the problem of sharply diminishing returns to additional inputs is still a long way distant. The argument about the large potential in Irish agriculture for expansion implies a relatively small diminishing returns effect at the present level of output. The benefits that such higher farm incomes would bring to the farming sector itself are obvious, but equally important are the bene-fits to the economy as a whole. The failure to realise these benebene-fits is of major signifance, given the present stace of the national economy.
While the fact of the decline in agricultural competitiveness can be readily deduced from the available statistical data, the causes of this change are far less evident. The strong emphasis on the need to use additional inputs has not been matched by anything like sufficient emphasis on the vital need to achieve output increases commensurate with these additional inputs. It would appear to have been accepted far too readily that using more fertilisers, feed, sprays, etc., will automatically generate consequential higher out-put; this clearly has not been the case. In a recent paper on "Cost trends in agriculture", based on the Farm Management Survey of An Foras Taluntais, Mr J. Heavey argued that much of the increase in farm expenditure was income-led rather than income-generating.^ The author's view, based on his observations of trends over the years, was that ua sizeable
proportion of expenditure, through lack of any adequate cost control measures on the majority of farms, followed quickly an increase in incomes", and that " i f this were the case, production efficiency was not getting the attention it deserved". This is not to say that the levels of management on the more efficiently run farms are inadequate, but points to the very large variations in the levels of efficiency that still exist - and indeed would seem to be widening.
This problem of production efficiency has been considerably accentuated by the fact that the increase in the volume of inputs used in farm production has grown in spite of the rapid rise in the prices of inputs and the substantial cost/price squeeze in 1979 and 1980. Given the economic circumstances of Irish agriculture during the past few years, it would have been reasonable to expect the opposite, i.e., that there could have been a considerable reduction in the use of inputs. The fact that the volume of inputs has, in fact, increased, is a measure of the underlying problem in Irish agriculture today. This reinforces the conclusion quoted above. Production efficiency has not, and is not, getting the attention that it so desperately needs.
There is, prima facie, a need for a reassessment of the underlying approach to the de-velopment of agriculture in Ireland. The use of more inputs should not be the centre of attention in policy at the individual farm level. Instead, it should be accepted that while some increase in inputs is unavoidable, they should be confined to the minimum extent necessary to generate worthwhile additional output. This quite evidently has not been the
case during recent years. The future viability of Irish agriculture depends on reversing the disturbing trends in competitiveness of recent years. This is a major task and one in which the traditional ways of generating agricultural development may have to be reconsidered. It is the primary purpose of this paper to stimulate a detailed consideration of a new approach to the development of our agricultural sector.
There are two thoughts which should be recorded to complete this paper. Firstly, while it has, of necessity, been concerned with the agricultural sector, an analysis of the other major sectors of the economy could well show an equally serious problem. There is, no doubt, plenty of scope in the public sector and in the private non-agricultural sector for improvements in efficiency. This does not take from the need for those of us con-cerned with agriculture to appraise the opportunities in farming, but at the same time we should not allow the criticism that the efficiency problem is primarily an issue for the agricultural sector.
Secondly, although detailed statistical evidence of changes in efficiency in EEC agri-culture for the period since 1968 shows an increase of around 1.5 per cent per annum, there is recent evidence in the EEC Commission study of "Differential Rates of Inflation and the CAP" of a decline in the most recent years (see Table 10)~\ The problem is, clearly, not just an Insh one but one which affects some other EEC countries. A search for a solution to our own problem could usefully be extended to those other EEC states which have been experiencing similar difficulties in recent years.
REFERENCES
7. IRISH FARMERS JOURNAL, 1981, Vol. 33, No. 39, p.3, October. 2. FARM AND FOOD RESEARCH, 1982. An ForasTaluntais, February.
3. C A H I L L , C , 1981. "Credit Problems in Irish Agriculture", unpublished M.Sc. thesis.
4. HEAVEY, J. H., 1981. "Analysis of Cost Trends in Agriculture". Dublin: An ForasTaluntais, Pro-ceedings of Conference on Incomes and Cost Trends in Irish and EC Agriculture.
Table 1: Family Farm Income 1970-'81 Year 1970 1971 1972 1973 1974 1975 1976 1977 1978 1979 1980 1981 Family* Farm Income (£m) 182.3 200.3 283.9 363.1 330.4 476.3 534.9 743.0 835.1 734.7 673.0 770.1 Percentage Change In Current Terms 1970 = 100
100.0 109.9 155.7 199.2 181.2 261.3 293.4 407.6 458.1 403.0 369.2 422.4 Consumer Price Index
1970 = 100 100.0 108.9 118.4 131.8 154.2 186.4 219.9 249.9 269.0 304.6 360.1 433.6 In Real Terms 1970 = 100
100.0 100.9 131.5 151.1 117.5 140.2 133.4 163.1 170.3 132.3 102.5 97.4 Family Farm Income per head (£) 810.2 914.6 1,320.5 1,729.0 1,603.9 2,346.3 2,701.5 3,810.2 4,326.9 3,887.3 3,598.9 4,162.7 Percentage Ln Current Terms 1970 =100 100.0 112.9 163.0 213.4 198.0 289.6 333.4 470.3 534.1 479.8 444.2 513.8 Change In Real Terms 1970 = 100
100.0 103.7 137.7 161.9 128.4 155.4 151.6 188.2 198.6 157.5 123.4 118.5 Average** Industrial Income (£) 923 1,074 1,235 1,485 1,774 2,306 2,758 3,238 3,710 4,278 5,055 5,886 Agricultural Income as %of Industrial Earnings % 87.8 85.2 106.9 116.4 90.4 101.7 97.9 117.7 116.6 90.9 71.2 70.7 Family *** Farm Workers (000's) 225 219 215 210 206 203 198 195 193 189 187 185
* Family farm income is equivalent to "income from self-employment and other trading income", as published by the Central Statistics Office. This represents the amount available to remunerate farmers and members of their families for their labour and management and to cover interest on capital. ** Earnings of ail industrial workers (men, women, youths, and girls combined) in the transportable goods industries.
Table 2: Prices in Agriculture 1970-1981 Year 1970 1971 1972 1973 1974 1975 1976 1977 1978 1979 1980 1981 Prices Paid To Farmers 89.0 95.2 115.7 151.1 153.3 196.4 246.8 302.2 341.7 361.7 352.1 418.3 Prices Paid By Farmers All Inputs 92.4 100.3 107.4 131.9 184.9 217.4 251.6 305.9 318.8 358.8 410.0 470.7
Consumer Price Index
Food 91.6 98.4 110.0 128.2 146.9 178.5 208.0 242.0 266.2 305.2 338.2 388.9 Total 91.7 99.8 108.4 120.8 141.3 170.8 201.6 229.1 246.5 279.2 330.0 397.5
Indices to the base "1971" = 100 (average 1970, 1971, 1972)
Source The data in this table were compiled from the Input Price Indices, Output Price Indices and Consumer Price Indices published in various issues of the Irish Statistical Bulletin by the Central Statistics Office, Dublin.
Table 3: Index Numbers of the Volume of Agricultural Output and Inputs 1970 - 1981 (Base Year 1971* = 100)
Year 1970 1971 1972 1973 1974 1975 1976 1977 1978 1979 1980 1981 (eay Crops 96.9 104.9 98.0 90.2 89.8 95.9 92.1 115.9 118.8 114.0 117.3 109.7 Livestock and Livestock Products 93.7 99.4 107.1 109.6 111.9 118.4 113.3 120.6 129.6 129.4 127.9 125.8 Gross Output 94.2 100.3 105.5 106.3 108.1 114.5 109.6 119.9 127.7 126.7 126.7 123.6 Net Output 94.2 79.7 106.0 104.1 110.3 122.1 109.6 120.5 122.8 111.1 119.5 110.9 Farm Materials 94.5 102.1 103.4 114.5 103.3 96.1 110.6 119.8 141.9 168.4 146.9 157.8 All Current Farm Inputs 94.7 101.9 103.5 114.6 106.8 101.8 112.5 122.7 141.5 163.3 147.2 153.7
* Indices for livestock gross and net output include changes in livestock numbers average, 1970, 1971, 1972.
[image:12.490.69.410.367.563.2]Table 4: Crops Acreages and Livestock Numbers 1970-81 ('000 head/acres) Year 1970 1971 1972 1973 1974 1975 1976 1977 1978 1979 1980 1981 Cows 1,713.1 1,781.9 1,894.8 2,096.3 2,151.3 2,102.1 2,047.1 2,094.5 2,096.3 2,108.2 2,034.9 1,981.7 Cattle Total 5,956.5 6,133.7 6,438.1 6,969.8 7,214.5 7.168.1 6,954.0 7,124.3 7,124.8 7,177.9 6,934.7 6,695.8 Sheep Breeding 1,843.7 1,888.1 1,873.8 1,872.4 1,804.1 1,687.7 1,602.6 1,614.3 1,578.2 1,576.5 1,548.6 1,603.1 Total 4,082.3 4,188.7 4,260.4 4,219.9 4,059.7 3,682.7 3,474.7 3,533.8 3,385.4 3,375.6 3,291.3 3,362.9 Pigs Breeding 141.5 150.5 131.7 132.6 95.3 99.1 113.0 107.6 122.1 127.6* 124.1* 125.5* Total 1,192.5 1,322.5 1 ,199.1 1,107.6 922.6 795.5 924.8 933.8 1,055.9 1,154.3* 1 ,056.7* 1 ,082. 1*
Total Crops 1 1 1 1 1 1 1 1 Acreage ,071.5 ,081.6 ,027.6 985.2 970.3 937.1 980.5 ,051.6 ,059.3 ,090.2 ,101.3 ,068.1 *August enumeration.
Total Crops include wheat, oats, malting and other Barley and potatoes only.
[image:13.487.137.374.391.581.2]Figures for total crops are provisional Source: Dublin: Central Statistics Office
Table 5: Gross Value Added at Constant Prices (1975) (Volume Index)
Base Year 1975 = 100
(According to EEC concept of G.V.A.)
Year 1973 1974 1975 1976 1977 1978 1979 1980 1981 (Estimated) G.V.A. 81.9 88.9 100.0 87.9 96.3 96.9 84.5 93.2 86.5
Note: EEC concept differs from national concept in its treatment of VAT.
Source: Dublin: Central Statistics Office
Table 6: Annual Capital Investment in Agriculture (£m current prices) and Numbers Engaged (OOP) Year 1970 1971 1972 1973 1974 1975 1976 1977 1978 1979 1980** Breeding Stock + 6.9 + 8.5 + 33.1 +28.7 -13.1 -23.5 + 5.7 - 1.9 + 6.4 -13.4 -35.6 Buildings 9.8 15.4 16.9 16.7 13.3 25.8 48.3 59.2 63.7 110.9 125 Land Improvement 5.9 6.5 5.8 6.2 7.5 8.2 13.3 15.7 19.5 25.1 .9 Transport Machinery 8.2 8.3 10.4 14.7 15.1 16.4 26.3 35.9 51.3 53.9 57.6 Agricultural Machinery 17.4 15.7 22.1 25.4 28.2 37.4 57.2 99.4 116.8 119.5 11 Others 1.9 1.4 2.6 9.7 11.7 12.9 21.1 27.1 37.9 45.8 9.6 Total Capital Investment 50.1 55.8 90.9 101.4 62.7 77.2 171.9 235.4 295.6 341.8 267.5* Total Numbers Engaged 262 252 246 240 235 231 226 222 220 216 214 Notes:
*Estimated employment in Agriculture. It should be noted that the estimates for 1975 onwards are based on the results of the bi-annual series of Labour Force Surveys initiated in that year, whereas the estimates for the period prior to 1975 are based on Census of Population results., with estimates for inter-censal years based on trend indicators. As the Labour Fprce Survey involves a number of differences in methodology and in definitions which affect the measurement of the Labour Force, the survey results are not entirely comparable with the Census-based figures.
Table 7: Estimated Loans Outstanding to Farmers £m* 1975-1981
Year
1970
1971
1972
1973
1974
1975
1976
1977
1978
1979
1980
1981
Associated Banks*
55
67
66
100
116
113
152
220
301
464
606
690
N o n -Associated
Banks**
N.A.
N.A.
4.0
5.8
10.8
14.7
13.8
17.5
20.0
35.0
65.2
46.4
ACC***
22
25
33
49
64
86
103
137
173
224
279
323
Total
77
92
103
155
191
214
269
375
494
723
950
1059
Annual Change
_
+ 15
+ 11
+5z
+36
+23
+55
+ 106
+ 119
+229
+227
+ 109
N.A. Not Available
*The published figures on farming indebtedness have been adjusted to exclude
certain non-agricultural items (fishing, marts, agribusiness, etc). An element
of personal borrowing by farmers may still be included but no estimates are
available for this item.
**Year ending February.
***Year ending April.
Source: C. Cahill. Unpublished M.Sc. Thesis
Table 8a: Changes in Fertilizer Use, and in Crop and Livestock Output (1970-72 = 100)
Year
1970 1971 1972 1973 1974 1975 1976 1977 1978 1979 1980 1981
Fertiliser and Lime Usage
92.5 103.7 103.8 129.9 124.8 99.2 119.8 129.8 161.2 180.0 159.8 166.9
Total Feed Usage
98.9 100.4 100.6 102.7 93.6 98.2 103.4 105.7 113.9 139.5 120.6 132.7
Crop Output
96.9 104.9 98.0 90.2 89.8 95.9 92.1 115.9 118.8 114.0 117.3 109.7
Livestock Output
92.5 99.6 107.9 107.6 112.1 118.8 105.7 112.0 117.1 115.2 115.4 113.3
Livestock and Livestock Products Output
93.7 99.4 107.1 109.6 111.9 118.4 113.3 120.6 129.6 129.4 127.9 125.8
Table 8b: Changes in Compound feed use* and in the Output of Livestock Enterprise** (1970-1972 = 100)
Year 1970 1971 1972 1973 1974 1975 1976 1977 1978 1979 1980 1981 (estj Cattle Output 92.9 99.4 107.6 112.4 111.9 115.9 103.7 113.5 116.3 111.4 105.5 99.7 Feed 86.6 88.2 125.2 169.4 177.9 196.8 229.7 267.4 323.6 452.6 386.5 407.2 Milk Output 96.6 99.2 104.2 109.1 104.8 112.8 121.3 130.4 147.0 149.9 147.9 146.1 Feed 86.7 84.4 128.9 140.5 140.8 174.6 247.0 353.6 572.8 777.6 605.7 699.2 Sheep Output 89.7 110.2 100.1 102.9 97.2 101.7 89.4 76.5 88.3 86.1 91.6 101.4 Feed 103.6 85.0 111.3 202.5 215.6 180.9 169.9 258.6 261.6 502.4 472.4 730.6 Pigs Output 97.7 101.4 100.9 95.6 73.4 73.5 86.9 92.3 102.4 102.1 97.3 101.5 Feed 95.5 104.8 99.8 96.9 80.3 64.7 79.0 78.3 80.2 88.7 83.4 80.7 Poultry Output 85.8 104.3 109.9 121.9 104.0 98.1 116.8 116.2 119.2 127.7 128.2 124.2 Feed 95.3 101.8 102.9 105.2 99.2 93.4 100.0 105.4 98.1 106.7 105.6 103.6
Output including Livestock Change
Base average '70, '71 and f72 Source: ^Department of Agriculture
[image:17.489.73.435.362.577.2]** Irish Statistical Bulletin, Dublin: Central Statistics Office
Table 9: National and E E C (FEOGA) Expenditure and Irish Farm Income (£m)
Year 1970 (a) 1971 (b) 1972 (c) 1973 (d) 1974* 1975 1976 1977 1978 1979 1980 1981*
State Expenditure in relation to Agriculture
94.2 107.1 112.9 89.0 68.3 108.6 129.4 156.1 170.1 177.3 224.4 283.1 FEOGA Guidance -2.8 3.9 0.5 2.5 7.3 9.3 16.5 27.1 35.2 Guarantee -37.0 63.8 102.1 102.0 245.1 366.0 397.9 381.1 305.3 Total 94.2 107.1 112.9 128.8 136.0 211.2 233.9 408.5 545.4 591.7 632.6 665.6 Family Farm Income 182.3 200.3 283.9 363.1 330.4 476.3 534.9 743.0 834.5 734.0 672.0 787.0 * Estimated.
Note: The data for the years 1970 to 1973 are in respect of twelvejnonth periods between April of the year in question and March of the following year, and for 1974 in respect of the period April to December.
Source: Pre-Budget Tables 1982. Dublin: The Stationery Office.
Table 10: Factors Influencing the Trend in Agricultural Incomes (arithmetic mean per three year period 1979/'81 as % of 1973-1975)
EEC Member States
Germany France Italy Netherlands Belgium Luxembourg United Kingdom Ireland Denmark
Internal terms of trade (1)
90.5 88.3 101.7 90.9 91.3 90.7 91.0 93.8 95.3
External terms of trade (2)
82.7 79.2 90.9 72.8 75.9 73.4 73.7 94.0 90.1
Productivity of inputs (3)
92.4 89.3 87.8 98.2 101.3 104.8 107.9 80.1 86.4
Productivity of labour (4)
129.9 126.2 130.4 140.0 127.8 107.2 116.5 126.6 141.5
(1) Ratio of the index of farmgate prices to the index of input prices.
(2) Ratio of the deflator for gross value added in agriculture to the GDP deflator (3) Ratio of final production by volume to immediate consumption by volume (4) Ratio of final production by volume to labour input.
ANNEX 1: PROBLEMS IN ESTIMA TING CHANGES IN REAL FARM INCOMES
The changes in real farm incomes over recent years have become the major issue in the development of Irish Agriculture. While there can be no doubt about the fact that there was a substantial improvement during the years 1975-78 and an even more substantial fall in the subsequent years, there are, nevertheless, some significant problems in measuring precisely the changes that have taken place in real terms.
The main problems are:
(a) What is the appropriate method of deflating the income data from nominal to real terms;
(b) the farm income data published by the CSO does not provide a precise account of the net farm incomes in that they do not provide for interest payments made by farmers or for the depreciation on buildings; and (c) in order to get a full picture of farm income changes, it is necessary to take account of changes \n the number of people who share that income. So far as the problem of deflating nominal farm incomes is concerned, it has been the generally accepted convention in Ireland that the Consumer Price Index is the appropriate deflator. In so far as farm incomes are used for the purchasing of consumer goods, then this approach is fully justified. To the extent that the income data are used for non-consumption purposes (i.e., for servicing existing capital debts, for re-investment purposes, for savings, etc.), then a price index covering a wider spectrum would be appropriate. In practice, however, there is no single uniquely suitable price index; the view of the statis-ticians at SOEC (and their national counterparts) is that the implicit price index of GDP is the most appropriate one available. Real farm incomes, deflated by the GDP deflator, gives a slightly different result than when deflated by the CPI (see Table Al), but the differences do not affect, to any extent, the orders of magnitude of the changes since 1970.
The concept of farm income also needs further consideration. The CSO agricultural income data relate to "income from self-employment and other trading income". This is a global concept of the income generated in agriculture to reward the basic factors of production land, family labour and capital. At the present time the CSO are not in a position to produce an "income distribution account" for "the agricultural sector. As long as this income was all, or virtually all, enjoyed by the farm family, the lack of an income distribution account did not give rise to any difficulty. In recent years, however, the level of interest payments by farmers and the problems of accounting for depreciation of buil-dings had made this situation increasingly unsatisfactory, and family farm incomes have been considerably different to the conventional CSO agricultural income figures. At the same time, in considering incomes of farmers, no account is taken of interest earned on the very substantial amount of farm profits that have been invested outside the agricul-tural sector (e.g., with the lending institutions, including building societies, etc.).
This latter point is particularly important to the totality of incomes enjoyed by farm families, which is the kernel of the income situation in agriculture. A substantial propor-tion (probably around one-third) of farmers counted in the farm family populapropor-tion are in receipt, not only of farm incomes but of social welfare incomes as well. These are primari-ly old age pensioners (generalprimari-ly non-contributory) and beneficiaries of the "farmers' dole". In so far as these form part of the total incomes of these farmers, the changes in the farm-derived part of their income may be counterbalanced by changes in the social welfare element. This consideration does not cover the part-time farmer who has off-farm
income from other employment and who generally is not considered to be a normal full-time farmer and is, therefore, not included in the farm employment statistics.
This question of the numbers of people reckoned as the family farm labour force (i.e., the denominator in the per capita income calculation) is important in that changes in farm incomes should be related to changes in the numbers enjoying that income. At the present time, no figures are published of the changes in the number of family farm workers, but two series, i.e., the total number in agriculture, forestry and fishing, with the related data from the bi-annual labour force surveys and the number of males engaged in agriculture, are published annually by the CSO. In recent years, these series have shown somewhat different trends, the total numbers engaged declining by around 1.5 per cent per annum, while the males engaged figure declined by nearly double this rate. It would seem that a decline of around 2 per cent per annum would be a reasonable estimate of the recent decline in the family farm labour force, and the decline in total farm incomes ad-justed by this figure would give a realistic picture of the trends in farm incomes for com-parison with trends in incomes in other sectors.
Xable AI: Changes in Real Farm Incomes using CPf and GCP deflators
V p n v X Cdl
1970 1971 1972 1973 1974 1975 1976 1977 1978 1979 1980 1981(est)
Total
Farm Income*
182.3 200.3 283.9 363.1 330.4 476.3 534.9 743.0 834.5 734.0 672.0 787.0
In Consumer Price Index
100.0 108.9 118.4 131.8 154.2 186.4 219.9 249.9 269.0 304.6 360.1 433.6
In
PHP
UJJx
Index
100.0 109.8 124.8 142.7 152.5 189.0 226.8 256.1 282.2 315.7 362.0 427.2
Percentage Change
Changes In real terms using CPI 1970 = 100
100.0 100.9 131.5 151.1 117.5 140.2 133.4 163.1 170.2 132.2 102.4 99.6
Changes In real terms using GDP 1970 = 100
100.0 100.1 124.7 139.6 118.8 138.2 129.4 159.2 162.2 127.5 101.8 101.0
Source: Dublin: Central Statistics Office.
* Family Farm Income is equivalent to nincome from self-employment and other trading income"
DISCUSSION
5. J. Sheehy: I am pleased to have the opportunity of proposing the Society's thanks to
Dr Attwood for his very provocative paper. The central thesis is that resources have been
inefficiently utilised in agriculture in recent years and the current income problem is
attributable to this waste. The author points out that this diagnosis is at variance with
other analyses which attribute the problem primarily to adverse terms of trade for
farmers.
Since 1978 marked the end of prosperity in farming, it is logical to decompose this
issue into the performance of the industry up to 1978 and the performance since 1978.
From the mid-sixties up to 1978, a fitted exponential equation shows that the volume of
GAO grew by 3.3 per cent per annum while the volume of NAO (after deducting "farm
materials" which are feed, fertiliser and seed) grew by 2.7 per cent. This appeared to be a
satisfactory situation well in line with the Government's expectations as outlined in the
EEC Accession White Paper of 1972 (Prl. 2064). It was, however, criticised in NESC
Report No. 40 (Prl. 7127) as representing an inadequate response to the very great
in-crease in profitability in farming as a consequence of EEC membership. In reply to this
criticism, it was emphasised by the Agriculture Minister of the day and by other people
that the growth record of Irish agriculture was second only to that of the Netherlands - a
claim which was factually correct.
Between 1978 and 1981, profits were halved. The volume of GAO fell by 3.9 per cent
but farm materials' use increased by 11.3 per cent, so that NAO fell by 10.2 per cent. On
the face of it this is a perverse reaction. Economists reared on profit motivation would
have expected a cut-back in input use with perhaps some cut-back in output as well. The
author implies that this rational response has been prevented by over-zealous salesmen,
careless advisers and complacent farmers.
The author's conclusions are based on a comparison of output/input ratios in 1975
with ratios of more recent years. Since volumes of both outputs and inputs in agriculture
are notoriously variable from year to year, one has to be very careful in selecting base and
terminal years. The attached graph shows the ratio of the volume of GAO to the volume
of farm materials. (A volume index of all inputs is not available prior to 1970.) The 1975
to 1981 data (to which a trend line is fitted) certainly show a rapidly deteriorating
position if this is the path that agriculture is set upon. But 1975 was a most unusual year,
as is evident in the graph: over the previous two years, the volume of GAO increased by
7.7 per cent while the volume of farm materials fell by 16.1 per cent - a sharp reversal of
long established trends. This is highlighted when a trend line (exponential) is fitted to the
1961-1981 data.
Furthermore, among recent years, 1979 and 1981 would appear to have been
relative-ly unfavourable. The author is, of course, correct in treating the weather factor
sceptical-ly because it has so often been trotted out as an alibi in the past. However, the evidence
of recent years is heavily laden against the author's interpretation and 1982 is developing
to confirm that much of the inefficiency problem in the paper is attributable to weather
variation. The graph includes my current expectations on the output/input relationship
this year which incorporate a weather normalisation in line with that mentioned by the
author. It sits precisely on the long-term trend line and well above the 1975-1981 trend.
Therefore, as I interpret the trends of the past 20 years, any inefficiency problem
which exists - and there may be one - has to be related to the rate of output response to
input use over the long-term and not since 1975. The most comprehensive published
study of this reports that for the 1963 to 1976 period, total resource productivity (both
factor and non-factor) grew by 1.98 per cent annually in Ireland which was third in the
EEC league of eight countries (Behrens and de Haen).
Any such study embracing factor inputs as well as non-factor inputs would identify the high level of capital formation up to 1979 which the author discusses. That invest-ment was based on expectations which proved wrong. When charged at its acquisition price, it must now prove to have been inefficient. However, since the salvage value of this investment is very much lower than the acquisition price, it remains in production until it wears out. Thus, the capital stock in the industry is being reduced and will continue to be reduced if profit levels do not recover. In a matter of a few years, this capital bulge will have levelled out to an equilibrium more in keeping with current levels of returns. There may well have been a comfort-creating rather than an output boosting element in that investment, but if the State operates a Farm Modernisation Scheme, it can hardly be surprising if farmers respond by modernising their farms.
The Society is indebted to Dr Attwood for exploring these very important issues. As he himself realises, a great deal more analysis is necessary, however, to discover the real situation. That study should focus on the micro situation at farm level as well as on the macro picture. If there is a waste of inputs, then it is in everybody's interest that these be quickly identified and put right.
REFERENCES
The Accession of Ireland to the European Communities. The Stationery Office, Prl. 2064.
NESC, Policies to Accelerate Agricultural Development, Report No. 40, The Stationery Office, Prl. 7127, Ch. 1.
BEHRENS, R. and H. de HAEN, "Aggregate Factor Input and Productivity in Agriculture: A Com-parison for the EC-Member Countries, 1963-76". Eur. Rev. Agr. Econ. 7-2, pp. 109-146.
80
70
RATIO
60
50
RATIO OF VOLUME OF 6R0SS AGRICULTURAL OUTPUT
TO VOLUME OF FARM MATERIALS, 1953 - 100
1965 1970 1975
Y E A R
B. Kearney: The theme of Dr Attwood's analysis is, at once, challenging and provocative -challenging in that economists have been confronted with an explanation of the apparent divergence between output and inputs in recent years and provocative especially concer-ning the manner and extent of his analysis. Perhaps public attention was first drawn to this issue in the address of the Minister for Agriculture to the ASA* Conference in September 1981, when he noted that "prices of inputs and output in the past few years have not been conducive to any rapid expansion in production, but this being the case, it is hard to see the reason why . . . the large increases in inputs has taken place". And again in December 1981, the Minister said, when referring to proposals to improve, incomes by reducing inputs, "this approach would seem to confirm the existence of a use of inputs greater than is justified by the output which they generate".
Dr Attwood has outlined the economic milieu in which the sector has been operating over the decade, but his analysis is overly aggregative and perhaps understates the in-fluence of certain factors on farm decision-making. I think, however, that apart from aggregate developments, there is some cause for concern, particularly relating to the con-sumption of some of the major inputs. For instance, in the 1980 Farm Management Survey there appeared to be too much fertiliser used on some farms in relation to stock numbers and there is some evidence to suggest an over-use of fertiliser also in other instances, such as sugarbeet. Similarly in the livestock sector, there could be some mis-allocation of feed resources due to some injudicious concentrate feeding in some dairy herds but, for the moment at least, we believe that this problem has not been too serious. There are some rather sweeping conclusions in regard to the use of these inputs, however, in the paper. Take milk production, for example, where it is stated that in the aggregate purchased, feed has gone up seven-fold, with only a 46 per cent increase in milk output. Subsequently, it is stated that farmers have substituted purchased for home-produced feed to the detriment of the financial returns from their farms, but, frankly, we cannot find much evidence of this from our surveys. Concentrate feed per animal has increased only by about 120 per cent over the past decade and only in one year out of ten did margins suffer - in consequence, the production strategy has, in general, considerably increased the financial returns to the farmer.
While we are on the issue of productivity, we must not forget that irrespective of the substitution of purchased for home-produced inputs, the process of intensification implies a declining average productivity as well, of course, as a declining marginal produc-tivity. If, again, we take intensification in dairying, the expected fertiliser costs on high-ly intensive (0.9)^ farms would be at least 3 times that on moderatehigh-ly stocked farms (1.5)t, but revenue per unit area would be less than twice as large. I am using this illus-tration to scotch the widely-held belief that a declining average productivity is synony-mous with an irrational use of inputs.
A few points can also be made about the divergence between the pattern of output and investment in recent years. I believe first of all that much of the investment in agri-culture was unduly delayed and in many instances was maintained and even increased, as farm incomes were falling and interest rates rising. Those who set out early on the voyage of expansion had developed enough momentum to come through the storms relatively unscathed. However, many others have now a relatively modern resource base and can accommodate considerable expansion with but little additional capital investment. Gross Fixed Capital Formation in agriculture is now averaging about 9 per cent of agricultural turnover (output) as opposed to 20 per cent or greater in the years 1977-1979. It now seems as if the cash flow difficulties of the sector prevented farmers from building up their stock numbers so as to exploit the additional fixed investment, and it is a safe bet
* Agricultural Science Association f Stocking rate
that this will now materialise, beginning this year when cow numbers might expand by 4 per cent. Not only that, but I see this trend being maintained and for the next few years we may see the converse of what Dr Attwood has described for the past few years, i.e., a fairly appreciable increase in net product per annum.
This paper, I believe, underlined more than ever the need for a disaggregated analysis of developments in the sector in recent years to obtain a fully satisfactory explanation of what has transpired. The apparently irrational trend in the pattern of output and inputs perhaps reflects the dualism in the agricultural sector - where aggregate growth trends can obscure the increasing concentration of production and the relative decline (and im-poverishment) of a large category of farms. It is possible, and this has been accentuated by the cattle crisis of 1974 that much land is now less intensively used than heretofore. I would hypothesise that a more plausible and perhaps rational explanation for the events described in Dr Attwood's paper would be obtained if the analysis were concentrated on full-time commercial farms, as their expansionary performance has been diluted in the aggregate. We have numerous examples of this, and in 1981, for instance, whereas nation-al milk supplies declined by 1 per cent, production on the larger commercination-al farms increased by 6 per cent.
The dualistic issue is perhaps confusing the link between aggregate productivity and expenditure on R & D also. Dr Attwood points out that spending on research, education and advisory work is equivalent to about 5 per cent of GAP (actually it was 2.5 per cent in 1978), but in this context we must once again employ a differentiated analysis in order to see the direct link between expenditure on R & D and the uptake of the relevant technology and significance of the sector availing of this service. (Actually, the general administration costs in agriculture have grown faster than R & D and now exceed expen-diture on education, advice and research).
In conclusion, we must be grateful to Dr Attwood for focussing attention on a funda-mental problem in the agricultural sector. He has not abided by the maxim that discretion is the better part of valour, and I am very happy to express the gratitude of the Society by seconding the vote of thanks here tonight.
P. Power. I would like to congratulate Dr Attwood on his stimulating and thought-provoking paper. The paper focuses on a very important aspect of agricultural production. The basic question that Dr Attwood poses is what is happening to technical efficiency in agriculture? Has the output-input ratio declined since the mid-seventies and if it has de-clined, is this a permanent feature of Irish agriculture?
While the figures put forward by Dr Attwood are not really contestable, the interpre-tation of what is happening is not altogether a simple matter. There are, in my view, sufficient unusual factors to suggest that there is no long-term decline in the technical efficiency of Irish agriculture and that the apparent inefficiency can be explained by un-usual and non-recurring factors. In order to answer the question in a more comprehensive manner, disaggregation would be essential.
The beef industry is one of the two major components of agricultural production. The extraordinary gyrations in this key output sector also help to explain the decline in out-put. The slaughter of almost 600,000 cows in 1975 represented an increase of 200,000 cows above normal culling rates. A high proportion of these cows which were culled in 1975 were not replaced. However, the progeny of these cows were sold as adult cattle in 1977 and 1978. Accordingly, their removal from the national breeding herd was not re-flected in a permanent loss in the volume of cattle output until 1979 and subsequent years. Similarly, the relatively high levels of calf exports to Continental Europe in 1975 and later years ensured that these animals were not coming on stream as finished cattle from 1978 onwards.
After the boom year of 1978, there was an increase in the volume of inputs used. The main area of input increase was in feedingstuffs, which is a simple technology. Some of the increase in input usage would appear to be income led and this may have accounted for the relatively high usage of feedingstuffs beyond recognised fodder deficit periods, such as the Spring/early Summer period of 1979.
All of these factors, Mr Chairman, are sufficient to explain the apparent decline in the ratio of output to input which took place in recent years. In my opinion, it will not be a permanent feature of Irish agriculture. Under more normal circumstances, especially weather-wise, the former technical ratios should obtain. Again, I would like to congra-tulate Dr Attwood for his stimulating address.
A. Leavey: There are a number of problems I have with this paper as follows:
1. The base years which have an effect on the conclusions reached with regard to volume of inputs.
2. The movement of prices of the output of farming and materials for farming and again how the base year used affects the conclusions reached.
3. The fact that all farming is dealt with in aggregate. No reference is made to the fact that there is a commercial sector in Irish farming which is reasonably dynamic and a non-commercial sector - mainly older people on smaller farms - which values the ownership of land rather than the use of land.
4. Capital investment - extra capital investment will be needed if Irish Agriculture is to develop. We have 1/4 to 1/6 the capital investment per acre of the more developed agricultures in Europe.
1. Taking the mid-seventies, especially 1975, as a base year could be misleading. In that year the level of volume of all inputs declined to less than 1971, 4 years before, while feed and fertiliser declined to the level of 1970. Given that gross output had increased by 14.5 per cent between 1971 and 1975 and over 20 per cent between 1970 and 1975, there is no way that that input-output ratio could be maintained. In addition, Dr Attwood mentions that the weather could have an effect of up to 5 per cent on gross output, but does not attempt to include it in his detailed analysis. Taking a three-year average around 1971 and allowing 5 per cent increase in gross output for the weather factor in 1979 and 1981, the comment could be re-written to read: "Com-pared with the early seventies, we are now using 54 per cent more inputs to produce 29 per cent more output". Perhaps we still have a problem but it is of a different dimension.
Explanation of Increase In Inputs
(i) Change from oats in small acreages in the West which were not traded to barley in the East which was.
(ii) 300,000 sucklers whose milk was fed to calves to 140,000 milking cows whose
milk was sold. They had to be fed with extra meal and the original milk fed to calves had to be replaced.
(iii) If the value of the extra output is matched to the extra costs, it makes more sense than is indicated in Table 8.6.
It is my opinion that the emphasis on the increase in the volume of inputs might lead us to a wrong diagnosis of the problem. It may be that it is a lack of growth in the volume of gross output that is our problem rather than too high level of inputs. Given the structure of the Irish agricultural industry, that means that we have not enough cows. The cows we are missing are the 300,000 suckler cows which disappeared, main-ly off more traditional-type farms, since the 1974 cattle crisis. True, many of them were replaced by dairy cows. But these replacements were on different farms, most of which were operating further up the production curve which may also explain some of the increase in inputs. The farmers who are liable to be involved in suckling cows are much less likely to be influenced by research and advisory work and are not normally among the regular clientele of those services. They are, however, amenable to public policy in the form of a suckler cow grant of sufficient level to encourage them to hold their cows (i.e., at the level of the real value of the early seventies' grant) and not change to competing, usually store cattle, enterprises. It is easy to be wise now but if some such action had been taken in 1974 and subsequently, we would probably have retained those cows. The rest of the agricultural industry would probably have expanded independently. Our gross output would be approximately 5 per cent higher, our factories would be busier and our balance of payments healthier. The farmers producing the raw material would still be making derisory incomes but that is a differ-ent problem.
2. Dr Attwood stated that the relationship between input and output prices is similar now to what it was in 1975. By 1975, however, a significant price squeeze had already occurred compared to the situation prior to EEC entry. If you assume a price ratio as at an average of the years 1970, 1971 and 1972 and allow for the 5 per cent weather factor in 1981, farm income would be 56 per cent higher. So, if you go back to pre-EEC for the base year, you can explain nearly all the present income problem on the basis of the price cost squeeze and the recent bad weather.
3. In the paper, all farming has been dealt with in aggregate. There are, however, at least two types of farm when characterised by inclination or indeed ability to expand and develop. We should look at public policy as to how it relates to those two sections. One section's contraction may counteract the other's expansion. I have already alluded to a suckler cow scheme for the less innovative farmer. The other policy which might move the land in the hands of older people into the hands of those who will utilise it more is an attractive pension scheme allied to leasing rather than to sale. In addition, it should not make more difficult transfer of land within the family.
4. Including transfers from EEC as state expenditure seems to me to be wrong. This transfer is a net gain to the country consequent on farmers' productive efforts. It is a plus rather than a minus. The cost to the Irish taxpayer of transfers, directly or through administration, to agriculture is different. The cost of Agriculture, Forestry and Fishing as a percentage of total public expenditure declined from 14.1 per cent in 1967-69 to 6.8 per cent in 1975-77.