Particle in-flight velocity and dispersion measurements at increasing particle feed rates
in Cold Spray
M. Meyer, S. Yin, *R. Lupoi, Trinity College Dublin, The University of Dublin, Department of Mechanical and Manufacturing Engineering, Parsons Building, Dublin 2, Ireland [*Contact email: lupoir@tcd.ie]
Cold Spray (CS) is attracting the interest of research and industry due to its rapid, solid-state particle deposition process and the respective advantages over conventional deposition technologies. The acceleration of the particles is critical to the efficiency of CS, and previous fluid dynamic investigations rarely consider the particle feed rate important. However, because higher particle loadings are typically used in the process, the effect of this cannot be assumed negligible. This study therefore investigates the particle velocities in the supersonic jet of an advanced CS system at low and high pressure levels and varying particle feed rates using Particle Image Velocimetry (PIV). The particle dispersion and velocity evolution along the jet axis were investigated for several feedstock materials. It was found that the average particle velocity noticeably decreases with increasing particulate loading in all cases. This effect is aggravated for lower working pressures, but mainly depends on the feedstock material, which implies more complex, volume-fraction related physics playing a role in this respect. Moreover, the velocity distribution and particle dispersion were also observed to be influenced by the feed rate, depending on the particle material. Increased particle feed rates hence affect the magnitude and distribution of impact velocity and consequently the efficiency of CS. In particular, numerical models neglecting this interconnection are required to be further improved, based on these experimental studies.
1 Introduction
Cold Spray (CS) is a coating manufacturing process, in which a feedstock powder is deposited onto a substrate by means of high velocity impacts and solid state deformation. As the process makes use of the high kinetic energy of the particles obtained from a supersonic process gas rather than their thermal energy, it allows for very low temperature levels compared to other coating technologies. It eliminates or minimizes the disadvantages of melting and hence it provides a possibility to coat oxidisation-sensitive materials and material combinations with different melting temperatures [1][2]. It is generally accepted that for deposition to occur a critical impact velocity must be crossed. This represents a threshold value that makes the particle acceleration a critical aspect of the technology [3][4]. Each material combination is characterized by a specific critical speed level. Both experimental and numerical studies on the two-phase nozzle flow were conducted in the past decades, yielding to the main parameters for gas and particulate acceleration. Primarily, the gas stagnation pressure and temperature [5][6], the gas species [7][8] and the powder injection conditions [9][10] are important. Another critical parameter is the particle material and size, as the larger and heavier particles are the less susceptible to the flow, having a much higher characteristic reaction time [11][12][13], whereas the particle shape is connected to the drag coefficient [14][15]. With the objective of analysing the gas and particle dynamics, different optical measurement techniques were employed in CS. Schlieren photography was frequently used to visualise the flow features. Only resolving the density gradients of the gas phase however impedes quantification of the velocity and particle motion. Therefore, non-intrusive velocity measurement techniques were used, firstly by Gilmore et al. [16]
particulate plume characteristics in CS with PIV. Although a sufficiently high particle density is required to enable field measurements with PIV, these studies did not consult the links to velocity results. There is no doubt that the faster processing times can be achieved by higher the feed rates. In order to start understanding the detailed effect of the particle feed rate as a process parameter, this work aims to investigate the particle velocity in the jet of a Cold Spray system working under low pressure and high pressure conditions in dependence of the particle feed rate using PIV, in combination with a tracking algorithm for the identification of single particle vectors. Feedstock materials are varied and measured under different flow conditions.
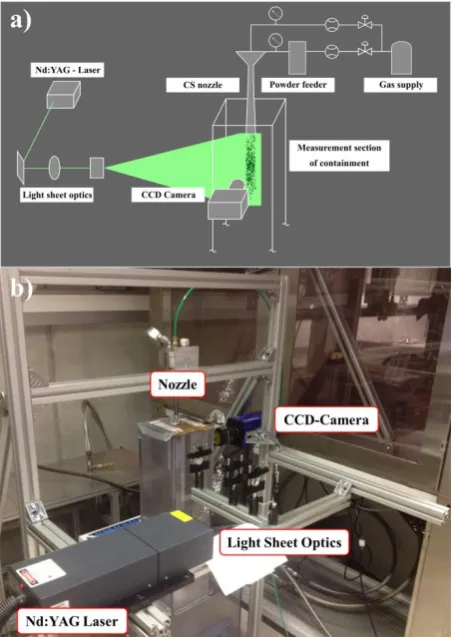
Figure 1. a) Scheme of experimental set-up and b) picture of the measurement system in the laboratory.
2 Methods
2.1 Cold Spray system and materials
Figure1a) illustrates a schematic of the experimental arrangement, including PIV and the CS process. The nitrogen gas flow was provided by a supply, delivering the settings of 30bar and 15bar constant pressure at the nozzle inlet. The gas line was split into two lines, a main line, which was connected to the nozzle head, and the powder feeder line; both of which comprised flow meters and pressure gauges. The wheel type powder feeder included a load cell to measure the mass feed rate of powder. The setting of powder feed rate was increased according to the capabilities of the feeder for each material. Downstream, the gas–solid
mixture then merged with the main flow in the nozzle head. The in-house nozzle-design of de-Laval converging/diverging shape had a full length of 210mm, a 2mm throat diameter and 6mm exit diameter. The velocity measurement area was oriented within the longitudinal direction and with a length of 50mm from the nozzle exit, such that the relevant region of the particle jet was covered. The nozzle sprayed into the measurement section of an enclosed area, which ensured undisturbed flow. Figure1b) shows the CS-PIV setup in TCD.
Figure 2. Comparison of SEM images of measured CS
powders: a) Aluminium, b) Titanium, c) Stellite-6.
[image:2.595.50.278.231.550.2]to obtain useful results for Titanium at 30bar pressure, frequently particles started glowing due to collisions with the nozzle wall, which interfered with the imaging techinique.
Feedstock material
Stellite-6 (ST)
Titanium (TI)
Aluminium (AL) Density
[kg/m-3] 8440 4500 2700
Pressure
[bar-g] 30/15 15 30/15
Temperature
[image:3.595.325.532.298.462.2][K] 290 290 290
Table 1. Poder materials and spray conditions
2.2 Measurement set-up
Particle Image Velocimetry was used to optically measure the particle velocity within the jet. They were illuminated with two subsequent laser pulses formed to a light sheet in the plane of measurement. A camera system captured two images of the scattered light respectively with varying pulse separation time depending on the conditions. These images were processed by a cross–correlation algorithm, deducing the particle displacement, which corresponds to velocity information by knowledge of the pulse separation. As the feedstock particles are measured directly in CS, the gas phase is not subject to measurement in this study. A Nd:YAG Laser with a wavelength of 532nm and 6ns pulse duration was used as the light source at 4Hz repetition rate. The light sheet thickness and width were approximately 1mm and 60mm respectively in order to obtain velocities of particles on the plan of symmetry. A monochromic camera with a resolution of 1280x1024 pixels and a 12bit dynamic range delivered the consecutive image pairs. The repetition rate was limited by the CCD readout time of the camera, such that the entire evolution of the particles through the flow field could not be tracked considering the high order of the present velocities. The pre–processing of images included a background subtraction and high– pass filtering to reduce stationary image features and low–frequency background variations. The processing involved a multi–pass cross–correlation with reducing interrogation window size and an additional tracking algorithm, which identified single particle vectors. The optical measurement error was estimated to be in the order of 1.3%.
3 Results and Discussion
3.1 Flow and loading conditions
As wheel speed of the powder feeder was increased, the mass feed rate of particles depends on the powder in use and the spray conditions. This results in varying ranges of feed rates for the different materials. For aluminium, having the lowest density, it was possible to increase the mass feed rate to just below
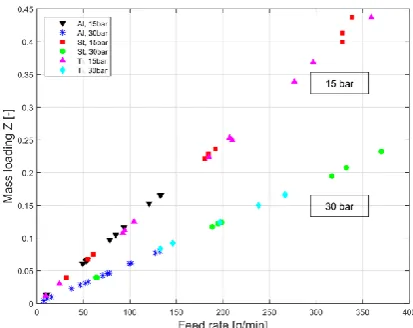
150g/min (corresponding to full wheel speed), whereas titanium could be fed at a maximum of 350g/min. For Stellite-6 even higher feed rates would have been possible, which would be beyond the scope of interest of this study. Figure 3 shows the connection between the particle feed rate and the corresponding relative mass loading Z as the ratio of the overall particle and gas mass flow rate in the nozzle. The gas flow conditions were measured to be constant for all measurements of each pressure setting, yielding 0.0136kg/s at 15bar and 0.0271kg/s at 30bar inlet pressure. Due to this, one can see linear the connection to the relative loading. The gas flow approximately doubles when increasing the pressure from 15 to 30 bar, which results in a steeper slope for the low pressure setting. One can hence expect any loading effect to be more drastic for such case – Z goes up to a maximum of 0.4, but even at lower values, the mass fraction is high enough for the phase interaction to become significant.
Figure 3. Verification of linear correlation between particle feed rate and raltive mass loading
3.2 Mean velocity change
In order to compare this phase-coupling effect for the chosen set of materials, one can investigate the particle exit velocity. As the experiments were conducted repeatedly and provided spatially resolved data, it is convenient to analyse the average change in particle velocity. This averaging was conducted over all measured particles, hence including changes with position, and over all image sets, as a temporal average. Figure 4 shows the respective results. The line segments are least-square linear fitting curves for the data points, clarifying the change in velocity. The error bars comprise 2σ-confidence intervals and the inherent uncertainty associated with the optical analysis.
particles is higher in its size distribution, as can be seen in Figure 2. As the pressure level is increased, this low-feed velocity increases by about 20% for both Stellite-6 and Aluminium, or by 75 and 90m/s respectively. Most importantly, one can clearly see a decrease in average velocity for all materials at given conditions. This trend appears to be approximately linear in the given range of feed rates and slightly less severe at higher pressure. The loss in particle velocity can be as high as 10% for Aluminium, and up to 16 and 20% for Stellite-6 and Titanium respectively, when taking into account the extended range of particle feed rates explored. It is very interesting to note that, depending on the material, the same amount of additional particle mass injected in the nozzle does not induce the same velocity loss. This implies that the slope for Stellite-6 is less steep than for Titanium, and the reaction of Aluminium is the most severe. According to the observation, the effect becomes more significant with decreasing density. Based on the conservation of momentum and energy, it can be argued that the velocity of the discrete phase must drop because its mass increased by a specific amount. However, for the different materials, the given mass feed rate corresponds to different numbers of particles and volumetric feed rates, and therefore to different volume fractions. For example, 100g/min feed rate corresponds to volume feed rates of 0.0118 and 0.037 litres/min for Stellite-6 and Aluminium respectively. The complex effects that are connected to a change in volume fraction seem to have an additional influence on the average particle dynamics. Such effects can be linked, for instance, to particle-particle collisions, change in turbulence and dissipation, as well as a dense regime in the nozzle throat region. In order to quantify these effects, it would be necessary to investigate the particle behaviour during acceleration, i.e. inside the nozzle.
Figure 4. Comparison of material behaviour due to
increasing particle feed rate using spatial and temporal average of particle velocity at the nozzle exit.
3.3 Profile evolution and distribution
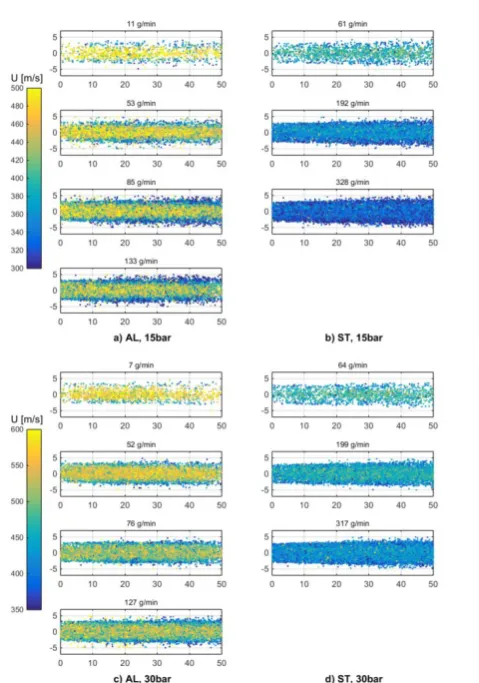
Figure 5 shows a comparison of particle distributions depending on the loading for Aluminium and Stellite-6
at 15bar (a,b) and at 30bar (c,d) respectively. The positions of detected particles are projected in the plane of measurement, where the origin is on the centreline at the nozzle exit, and coloured by the their velocity magnitude. In this test, no substrate was present. At the nozzle exit, each plot shows a narrow stream of exiting particles that widens downstream until the plume approximately occupies the region from -5 to 5 mm. This downstream dispersion most likely results from the interaction of particles with turbulence, the shock waves forming in the gas jet and the shear layer at its edge. It is stronger for high loading cases, and Aluminium, providing the lighter particles, is more prone to this effect. The overall decrease in velocity due to growing feed rate can also be seen in this graphic, as the level of both the higher velocities in the jet core and the lower velocities at the boundaries decreases. The higher the loading of particles is, the stronger the downstream deceleration becomes. For both materials, one can record that the dispersion is weaker for higher pressure. Consequently, the more momentum the particles have, the less susceptible they are to unfavourable deviations and, at the lower pressure level, the gas jet is drastically over-expanded leading to stronger shock systems.
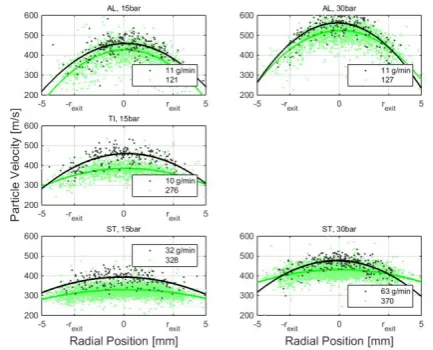
[image:4.595.313.553.359.701.2] [image:4.595.57.265.506.670.2]It is interesting to investigate the particle velocity at locations where a substrate could be placed, when choosing larger possible stand-off distances, as it is an indicator of the expected trends for particle impact velocity. Figure 6 therefore displays particle velocity profiles in the radial direction of particles which are located between 40 and 50mm downstream of the nozzle exit, hence on the far right side of the plots in Figure 5. In this illustration, differences become clear and can be quantified more easily. In each subplot, the dots are data points for individual particle speeds, whereas the curves are second order fits to guide the eye for the comparison. When opposing the different materials, a weaker curvature of the profiles can be noticed when going from Aluminium through Titanium to Stellite-6. The maximum velocities of the profiles are located around the centreline and the radial velocity drop associated with the curvature easily reaches 200m/s for the light material, while for the alloy, it is only in the order of 50-70m/s. This observation shows that the light material is affected more than twice as much by the spreading of the gas jet. For higher pressure, the curvature is slightly higher than for smaller pressure due to the same reason, and one can register a shift of the maximum to higher velocities by about 23% for Aluminium and 21% for Stellite-6. This is approximately the amount by which the velocities reduce when finally comparing the low feed to high feed cases. Generally, the slowest particles in the dilute cases are as fast as the fastest in the dense flow case. This reduction in maximal velocity is stronger for Titanium and Stellite-6. In these cases, the velocity profile flattens as relatively fast particles tend to occupy the areas further away from the centreline. For Aluminium, the particles in these locations are rather slow. This is plausible as they are decelerated faster when entering regions of negative relative gas-particle velocity. In every case, the low feed results show particles mainly within the region of the nozzle exit diameter (±rexit), whereas the high feed indicates a significantly stronger dispersion.
These observations are important considering effective deposition of different materials at increasing particle feed rates. The pressure level, the feed rate and the radial profiles affect the velocity of particles and hence the impact conditions. It is important to note, that due to the absence of a substrate, the additional effects of the bow shock system upon impact are not analysed. However, the analysed velocity reductions can lead to sub-critical impact velocities after passing through the shock and hence significantly reduce deposition efficiency.
4 Conclusions
In Cold Spray, the acceleration of the particles is critical to efficiency, and previous fluid dynamic investigations rarely consider the particle feed rate important. However, higher particle loadings can change the process, and induce noticeable effects on the particle dynamics. This study therefore
[image:5.595.323.540.341.516.2]experimentally investigated the particle velocities in the supersonic jet at lower and higher pressure level, analysing the effect of varying particle feed rates on Stellite-6, Aluminium and Titanium particles using PIV. The main novel findings are that the average particle velocity was reduced in every case when the particle loading was increased, in part as high as 20%. It was found that the materials behave slightly differently when changing this parameter. It is proposed, that complex processes which involve non-linear effects due to differing increase of volume fractions play a role in this respect. Moreover, the study found that the particle velocity decreases more strongly while traveling downstream at high loadings. Aluminium was found to be more prone to radial velocity decrease also for high feed rates, but all materials show intensified particle dispersion at large distances from the nozzle exit. Increased particle feed rates hence affect the magnitude and distribution of impact velocity and consequently the efficiency of Cold Spray. In particular, computational modelling approaches neglecting this interconnection are required to be further improved, based on experimental studies presented in this paper.
Figure 6. Radial velocity profiles at 40-50mm distance from nozzle exit by the PIV apparatus. Data points represent single particle velocities, lines indicate profile trend as 2nd order fits.
Acknowledgements
The authors wish to aknowledge FP7 Marie Curie Actions (Grant 333663) for the financial support and to the CRANN Advanced Microscopy Laboratory (AML) for the cooperation, as well as to Dr. Tim Persoons for the technical advice and support.
5 Literature
[1] A. Alkhimov, V. F. Kosarev, and A. Papyrin, “Method of Cold-Gas Dynamic Spraying,” Dokl.
Acad. Nauk SSSR, vol. 315, no. 5, pp. 1062–
1065, 1990.
[2] A. Papyrin, “COLD SPRAY TECHNOLOGY,”
Adv. Mater. Process., vol. 159, no. 9, pp. 49–
51, 2001.
Kreye, “Bonding mechanism in cold gas spraying,” Acta Mater., vol. 51, no. 15, pp. 4379–4394, 2003.
[4] M. Grujicic, C. L. Zhao, C. Tong, W. S. DeRosset, and D. Helfritch, “Analysis of the impact velocity of powder particles in the cold-gas dynamic-spray process,” Mater. Sci. Eng., vol. 368, no. 1–2, pp. 222–230, 2004.
[5] T. Han, Z. Zhao, B. a. Gillispie, and J. R. Smith, “Effects of Spray Conditions on Coating Formation by the Kinetic Spray Process,” J.
Therm. Spray Technol., vol. 14, no. 3, pp.
373–383, 2005.
[6] E. H. Kwon, S. H. Cho, J. W. Han, C. H. Lee, and H. J. Kim, “Particle behavior in supersonic flow during the cold spray process,” Met.
Mater. Int., vol. 11, no. 5, pp. 377–381, 2005.
[7] T. C. Jen, L. Li, W. Cui, Q. Chen, and X. Zhang, “Numerical investigations on cold gas dynamic spray process with nano- and microsize particles,” Int. J. Heat Mass Transf., vol. 48, no. 21–22, pp. 4384–4396, 2005. [8] H. Katanoda, T. Matsuoka, and K. Matsuo,
“Experimental study on shock wave structures in constant-area passage of cold spray nozzle,” J. Therm. Sci., vol. 16, no. 1, pp. 40– 45, 2007.
[9] S. Yin, Q. Liu, H. Liao, and X.-F. Wang, “Effect of injection pressure on particle acceleration, dispersion and deposition in cold spray,”
Comput. Mater. Sci., vol. 90, pp. 7–15, Jul.
2014.
[10] S. Yin, X. Suo, H. Liao, Z. Guo, and X. Wang, “Significant influence of carrier gas temperature during the cold spray process,”
Surf. Eng., vol. 30, no. 6, pp. 443–451, 2014.
[11] F. Gärtner, T. Stoltenhoff, T. Schmidt, and H. Kreye, “The Cold Spray Process and Its Potential for Industrial Applications,” J. Therm.
Spray Technol., vol. 15, no. 2, pp. 223–232,
2006.
[12] A. Sova, A. Okunkova, S. Grigoriev, and I. Smurov, “Velocity of the Particles Accelerated by a Cold Spray Micronozzle: Experimental Measurements and Numerical Simulation,” J.
Therm. Spray Technol., vol. 22, no. 1, pp. 75–
80, Nov. 2012.
[13] S. Li, B. Muddle, M. Jahedi, and J. Soria, “A Numerical Investigation of the Cold Spray Process Using Underexpanded and Overexpanded Jets,” J. Therm. Spray
Technol., vol. 21, no. 1, pp. 108–120, Oct.
2011.
[14] X.-F. Wang, S. Yin, and B. P. Xu, “Effect of cold spray particle conditions and optimal standoff distance on impact velocity,” J. Dalian
Univ. Technol., vol. 51, no. 4, pp. 498–504,
2011.
[15] W.-Y. Li and C.-J. Li, “Optimization of spray conditions in cold spraying based on numerical analysis of particle velocity,” Trans. Nonferrous Met. Soc. China (English Ed., vol. 14, no. 2,
pp. 43–48, 2004.
[16] D. L. Gilmore, R. C. Dykhuizen, R. A. Neiser, T. J. Roemer, and M. F. Smith, “Particle Velocity and Deposition Efficiency in the Cold Spray Process,” J. Therm. Spray Technol., vol. 8, no. 4, pp. 576–582, 1999.
[17] H. Fukanuma, N. Ohno, B. Sun, and R. Huang, “In-flight particle velocity measurements with DPV-2000 in cold spray,” Surf. Coatings
Technol., vol. 201, no. 5, pp. 1935–1941,
2006.
[18] B. Jodoin, F. Raletz, and M. Vardelle, “Cold spray modeling and validation using an optical diagnostic method,” Surf. Coatings Technol., vol. 200, no. 14–15, pp. 4424–4432, 2006. [19] F. Raletz, M. Vardelle, and G. Ezo’o, “Critical
particle velocity under cold spray conditions,”
Surf. Coatings Technol., vol. 201, no. 5, pp. 1942–1947, 2006.
[20] X.-J. Ning, Q.-S. Wang, Z. Ma, and H.-J. Kim, “Numerical Study of In-flight Particle Parameters in Low-Pressure Cold Spray Process,” J. Therm. Spray Technol., vol. 19, no. 6, pp. 1211–1217, Sep. 2010.
[21] S. P. Pardhasaradhi, V. Venkatachalapathy, S. V Joshi, and S. Govindan, “Optical Diagnostics Study of Gas Particle Transport Phenomena in Cold Gas Dynamic Spraying and Comparison with Model Predictions,” J. Therm. Spray
Technol., vol. 17, no. 4, pp. 551–563, Oct.
2008.
[22] B. Samareh, O. Stier, V. Lüthen, and A. Dolatabadi, “Assessment of CFD Modeling via Flow Visualization in Cold Spray Process,” J.
Therm. Spray Technol., vol. 18, no. 5–6, pp.
934–943, Aug. 2009.
[23] R. Lupoi, “Current design and performance of cold spray nozzles: experimental and numerical observations on deposition efficiency and particle velocity,” Surf. Eng., vol. 30, no. 5, pp. 316–322, Jun. 2014.
[24] M. Meyer and R. Lupoi, “An analysis of the particulate flow in cold spray nozzles,” Mech. Sci., vol. 6, no. 2, pp. 127–136, 2015.
[25] J. A. Pattison, S. Celotto, a. Khan, and W. O’Neill, “Standoff distance and bow shock phenomena in the Cold Spray process,” Surf.
Coatings Technol., vol. 202, no. 8, pp. 1443–
1454, 2008.
[26] S. H. Zahiri, W. Yang, and M. Jahedi, “Characterization of Cold Spray Titanium Supersonic Jet,” J. Therm. Spray Technol., vol. 18, no. 1, pp. 110–117, Nov. 2008.