In European countries with advanced forestry models and software systems for the forest growth simulation and prognosis (PRETZSCH 1992; HASENAUER 1994; STERBA 1995;NAGEL 1996) are continuously improved. Models keep on achieving a higher level of detail: describe the evolution of single trees, take into account the competi-tion ships, mortality, different forest tending programmes and are closely related to site fertility and climatic char-acteristics. They are better adapted to forest practice re-quirements at the same time. Their software resolutions become more developed (SILVA, MOSES, PROGNAUS, BWIN).
An inseparable part of the above-mentioned models and computer programmes seems to be extended modules for forest visualisation. They enable to review simulation re-sults and to record the dynamics of forest stand evolution visually. Some visualisation modules (mainly static ones) are a direct part of growth simulators. Independent pro-grammes that can visualise the forest stand or its part on the basis of determined data formats are also developed. A good example is the well-known Stand Visualisation System (MCGAUGHEY 1997).
A new trend of utilisation of these models is their in-troduction into the field of training and education of the forestry community. A transition from static visualisation (2D or 3D) to dynamic virtual forest stand is connected with this. It is possible to move, i.e. walk (virtual walk-through) or fly (virtual fly-walk-through), without any limits in this type of stand. Except this, the environment is in close interaction with the user. It means that it is possible to mark trees, to cut trees and to change it in this way. The tool serves for presentation, publicity and demon-stration aims, for example the presentation of different
stand structures and demonstration of different forest mensuration procedures (an estimate of stand density and tree species composition, methodology of sample plot establishment). After the connection with growth simulators it becomes a tool for virtual training of forest tending, i.e. “thinning training tool”. This sophisticated approach offers an absolute liberty of tree marking for forest cuttings to the forestry community, moreover the impacts can immediately be tested by means of growth simulations. Another tendency is switching these tools to geographical information systems. The actual forest stands situated in a real geographic position and terrain situation of similar stand structure are subsequently used for education and training. It passes from the level of virtual forest stand to the level of virtual district. The lat-est element of these systems is their introduction into the Internet environment, the transition from the local con-nection to the remote one. Then these systems become a basis of sophisticated systems for forestry electronic education (e-learning).
The purpose of this study is to present the methodology focused on the virtual forest stand generation and to intro-duce its applied realisation. The designed system will be a part of growth simulator “SIBYLA” and thinning train-ing tool “TREVYL” developed at the Department of Forest Management and Geodesy within an information system for forest users (FABRIKA 2002a). The system for the crea-tion of virtual forest stands arose within the projects of the 5th framework programme of European Union
Implement-ing Tree Growth Models as Forest Management Tools,
home Research Project VEGA Biodiversity, Forest State
Assessment and Evolution Prognosis and project from the
field of information technologies Project of IT Utilisation
Virtual forest stand as a component of sophisticated forestry
educational systems
M. F
ABRIKATechnical University, Faculty of Forestry, Zvolen, Slovak Republic
ABSTRACT:The paper presents the methodology of virtual stand generation. Virtual stand serves for forestry e-learning as a tool for training of forest tending and demonstration of stand structure and some forest mensuration practices. The model can be connected with growth simulator and geographical information system, or integrated into the Internet environment. In the first part of the paper, the methodology of individual tree visualisation, total stand visualisation, terrain and stand environment visualisation and the principle of user’s interaction with virtual forest are proposed. The Virtual Reality Model Language (VRML 97) was used for these goals. In the second part of the paper, an example of model usage for the training of forest tending is presented.
Keywords:forest visualisation;forest modelling; e-learning; VRML 97; thinning training tool
as Tool for e-learning at Forestry Faculty as a product of their bilateral co-operation.
METHODOLOGY
In the development process of the tool for the virtual forest stand generation it is necessary to solve some meth-odological questions. Primarily it is important to choose the software platform for virtual forest stands. The follow-ing possibilities come into consideration:
1. Utilisation of user-ready applications. Several solu-tions exist in the form of computer programmes in the world. A disadvantage is their binding with certain data format, limited number of tree species, language localisation, more complicated integration with other systems, impossible implementation into the Internet environment and finally license conditions. A notable example of this system is a programme TreeView (SEIFERT 1998), experimentally introduced into the Forest Information System in Slovakia (FABRIKA 2002b).
2. Construction of new applications on graphic library
basis. This method requires a development of new
spe-cific application with utilisation of some 3D-graphic libraries (e.g. OpenGL or Direct3D) in the develop-ment of programme environdevelop-ment (e.g. Visual C++ or Delphi). An advantage is maximum liberty of adapta-tion of requirements of the forestry community. But their creation is very difficult and expensive, mainly for the infiltration into the Internet environment. At the same time the mentioned products are limited only to the functions embedded by the development proc-ess and any change requires a re-entry into the source code.
3. Utilisation of language for building of virtual worlds
(VRML). Virtual Reality Model Language – VRML
(CAREY, BELL 1997; ŽÁRA 1999) appears as very promising because of its opened architecture (Open-Source principle), severe ISO standardisation and primary determination for the Internet platform. The description of the virtual world is in an external text file and the absolute possibility offers to build virtual worlds (not only forest stands). Number of viewers exists, even as a part of the Internet applica-tions Netscape Communicator and Internet Explorer. Programme libraries for the integration into the own systems are available on ActiveX components ba-sis.
The third possibility was chosen for our needs that seemed to be the most convenient from the aspect of establishment difficulty, service properties and a chance of future adaptation. For these purposes we developed a viewing programme “MARKO POLO 3D Explorer” in the Delphi environment. Consequently it was necessary to solve other methodological questions: a method of single tree visualisation, a method of the total stand gen-eration based on commonly available forest information, a method of implementation and terrain visualisation
from the digital model in the GIS environment, visuali-sation of surrounding world for complete virtual experi-ence (background, lighting, visibility, sound extension) and finally to ensure the interaction between the user and the forest environment (tree marking, tree cutting and connection with growth simulator).
Single tree visualisation
The biggest requirements for the forest visualisation are reposed on a 3-dimensional model of single tree. It is necessary that the given kind of tree species will look real to satisfy the purpose of virtual forest stand. This puts great demands on the projection of crown habit and bark texture. Hereby, it is needed that the tree dimensions (tree diameter – d1.3, tree height – h, crown
diameter – b, crown length – l) will act as variable values. These requirements are really very important, chiefly if we realise that this tool is intended for stu-dents whose routine in tree differentiation is forming. Wrong results of tree species visualisation can cause wrong habits of tree species recognition. That is why the specialists in forest dendrology verified the result-ing tree species prototypes.
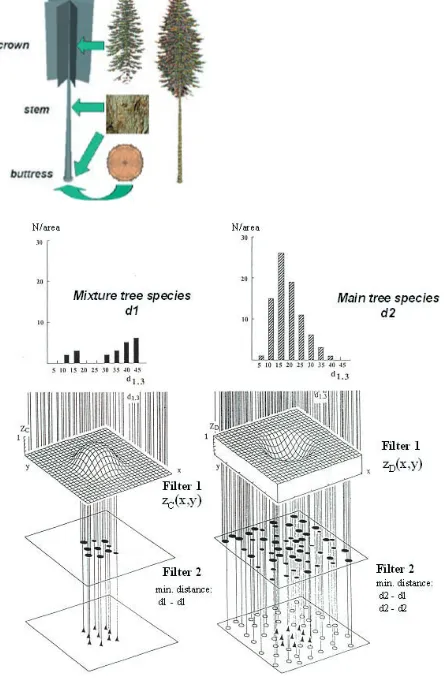
A suitable space model has to be chosen for tree visu-alisation. Most existing tools use tree generation into the simplest models as frequently as possible. For example, the stem is represented as a cylinder and the crown is a simple body (a ball for broad-leaved trees and a cone for conifers) or the body composed of “lighted part” (a cone, a ball section, paraboloid) and “shaded part” (a cone, a ball section, a cut cone, a cut neiloid, a cut paraboloid). But this visualisation is far from the real look of trees. A different visualisation model was used for our purposes, based on the latest procedures applied to the development of the latest 3D computer games. A principle is shown in Fig. 1.
The tree was divided into three parts: stem, crown and buttress. The stem and the buttress are made up of inter-locked cones. The crown consists of four planes rotated at 45°. Bark texture of the particular tree species is built up on the stem and buttress. The bottom of the buttress cone is covered with wood texture in a cross-section (important for cut trees). The illusion of real crown is achieved by texturing the crown habit into the rotated planes. Textures are of transparent background (GIF format was used). Required pictures were scanned and modified according to the drawing of treecrowns in an atlas (COOMBES 1992) and according to photographs of tree bark in atlases (AAS, RIEDMILLER 1987; KREMER 1995; PAGAN, RANDUŠKA 1987, 1988).
Transform {
translation 30.5 500 20.0 children[
TREE_JD { tree_number 1 tree_status 0 tree_text „“ tree_height 20 tree_dbh 26
crown_parameters 4 10 4 }
] }
These values are necessary for the visualisation of bodies: height and bottom radius of the cone, the crown is defined by the spatial co-ordinates of the corners of planes. The bottom radius of the stem is calculated using the extrapolation of the tree breast height diameter (d1.3) and height (h) according to:
d
1.3.h
r0 = –––––––––––– (1)
200.(h – 1.3)
The height of the stem cone is equal to tree height. The bottom radius of the buttress cone is determined by:
2
r´0 = ––––. r0 (2)
1.5
The cone height of the buttress is determined by: h
h´ = ––– (3)
30
The crown prototype of the size 1 × 1 × 1 m is used for the crown and its real size is obtained by changing the scale in x, y and z-axis direction.
26 prototypes of tree species were created by the above-mentioned procedure: spruce, fir, pine, Douglas fir, larch, beech, oak, hornbeam, aspen, birch, cherry, willow, pop-lar, dwarf pine, hedge maple, sycamore, Norway maple, elm, rose acacia, ash, lime, walnut, buttonwood, alder, chestnut and yew tree. Examples of some tree species are in Fig. 2.
Visualisation of forest stand
Another important step in the creation of virtual forest stand is generation of its structure. It becomes problematic when no data on single trees are available (for example, from permanent sample plots). It is necessary to know not only the diameters and heights of the trees, but also their position co-ordinates and crown parameters (diameter and height of the onset). In case these data are not available, it is necessary to generate them. The most common situation is that data on the diameters and heights of trees are miss-ing, i.e. only average stand data are known (e.g. from the stand description in the forest management plan). In this case, it is required to generate the frequency distribution of tree diameters and heights.
For these objects the stand structure generator was used (STRUGEN) that is a part of growth simulator SILVA 2.2 (PRETZSCH 1993). An algorithm was applied and an independent module was created that can generate particular tree characteristics on the basis of stand data (mean diameter dm, mean height hm, average basal area per hectare Gha and average number of trees per hectare
Nha with regard to tree species in different storeys). These data are normally available from stand description. The principle of generation is as follows:
1. Generation of diameter frequency distribution (n) on the basis of Weibull function (F(d1.3)), as modified by NAGELand BIGING(1995):
7 a1 d1.3 a1
–– –– a0 a0
F(d1.3) = 1 – e . e (4) 2. Generation of single tree heights (h) on unit height
curves (ŠMELKOet al. 1987):
1 1 [(a0 + a1.hm + a2.dm) . d
1.3 dm
h = 1.3 + ( hm – 1.3).e (5)
3. Generation of crown diameters (b) and crown onsets (hl) according to the relations (PRETZSCH, KAHN 1998):
h a0 + a1 . ln (d1.3) + a2 . h + a3 . ln (d
1.3 )
b = e (6)
h a0 + a1. d 1.3
+ a2 . d1.3
hl = h . 1 – e (7)
4. Generation of position co-ordinates of single trees on the basis of Poisson’s homogeneous process (PRETZSCH 1993). The algorithm enables to simu-late a random tree distribution or group (alternatively strip) addition of one tree species into the random distribution of other species. The principle of group mixture is designed in Fig. 3. The generation is car-ried out on the basis of filters. In the first step the positions of a mixture tree species are generated. In the second step other species fill up the stand. A stand macrostructure (i.e. groups or strips) is created by the first grade filter (filter 1). It means that the points of different probability decreasing from the middle of the groups or strips are accepted. The filter has the same probability through the entire area in the case of random tree distribution. The second filter (filter 2) regulates the stand microstructure. It means that only the points at a distance greater than the permitted minimum distance to the created trees are accepted. Minimum distances depend on tree species and their crown diameters. The process of occupation the stand area realises till all the trees generated at point 1 are placed.
Detailed algorithm description and coefficient values are in appropriate publications.
)
(
Fig. 1. The principle of single tree visualisation
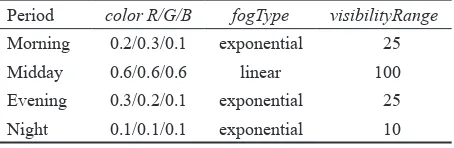
Fig. 6. Comparison of view into the stand at midday and by night
[image:5.595.74.517.58.192.2]Spruce Fir Pine Larch Beech Oak
Fig. 2. An example of visualisation of some tree species
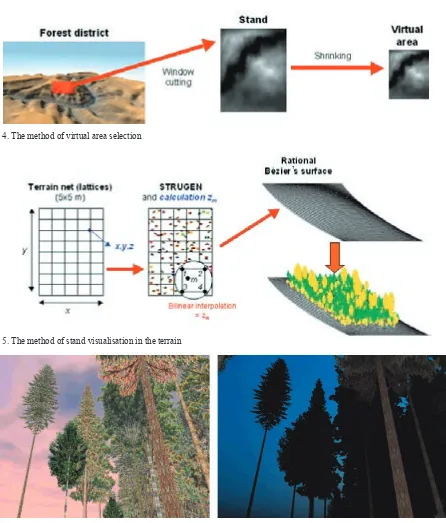
[image:5.595.78.524.214.737.2]Fig. 5. The method of stand visualisation in the terrain Fig. 4. The method of virtual area selection
Terrain visualisation
It is not possible to create a real model of virtual stand without a terrain model. This simultaneously affects com-petition relationships among the tree species because the competition situation is different between the lowland and the dissected slope. This factor determines the mutual tree position (shading and straitening) and thus a computation of competition indications (BACHMANN 1998). By the ter-rain generation for the virtual forest stand it is necessary to solve some methodological problems: representative terrain sample and its extraction from the data sources, derivation of the height position co-ordinate for each tree and at last the method of final visualisation together with the forest stand.
For the selection of a representative sample it is neces-sary to choose a suitable size of the area, its shape and this shape to extract from the original terrain model. From the aspect of calculation speed it is not favourable to choose the size of the whole stand. For the purposes of the virtual area and consecutive growth simulations the size that re-sults from the optimisation among the representativeness of stand structure and calculation and user’s suitability is sufficient. An optimal compromise seems to be the area of 25 ares. In dependence on stand density it consists of approximately 50 trees (200 trees per hectare) to 2,500 trees (10,000 trees per hectare).
Another question is the selection of an area part to ex-tract it from the original terrain. It is possible to choose the system for a location of this part into the stand centre. But this approach implies some methodological problems and at the same time it does not represent the entire stand well, especially when terrain conditions are markedly different from the area centre. For our purposes, the approach of shrinking the stand area into the required virtual area was chosen (Fig. 4). In the first step a rectangle (alternatively square) is selected from the digital terrain model coming from the forest district. The geometrical figure out-rounds the chosen forest stand. A given terrain section is conse-quently reduced into the required size by scalingthe raster. This approach will ensure better representation of the area from the aspect of competition situation in the stand.
The method of derivation of the height position of single trees and final visualisation is illustrated in Fig. 5. A net of 5 × 5 m points is derived from the virtual area (i.e. lat-tices). Single trees are placed into this net according to the approach in the preceding chapter. A bilinear interpolation of horizontal tree co-ordinates (xm, ym) and height co-ordi-nates of the appropriate cell corners (z1, z2, z3, z4) is used
for the derivation of height co-ordinate for each tree: (ym – y1)
z1
m = z1 + (z3 – z1) . ––––––– (8)
(y3 – y1)
(ym – y2) z2
m = z2 + (z4 – z2) . ––––––– (9)
(y4 – y2) (xm – x1) zm = z1
m + (z2m – z1m) . ––––––– (10)
(x – x)
The derived terrain net is used for the creation of a surface model on the basis of rational Bézier’s surface (BÉZIER 1972). The algorithm description is in the paper by ŽÁRAet al. (1992). The individual trees are located onto the presented area.
Visualisation of the surrounding environment
The environment visualisation does not have any direct impact on the function of stand model, but it has an im-mense significance for the perception quality and virtual experience. These are the questions of the image back-ground, light, visibility and sound effects.
The background was resolved by projection of pano-ramic pictures onto the inside walls of a cube surround-ing the virtual forest stand. Four backgrounds were made: morning (sunrise), midday, evening (sunset) and night (full moon). For the ground cover 16 textures (i.e. phytocenology tapestries) were prepared and their utili-sation depends on the forest and stand type (FABRIKA 2002b). For the light a universal model suited for all the introduced day periods was used. The best seemed to be the spot light projected from the sun or moon side on the panorama background:
PointLight { on TRUE
location 167.04 668.16 167.04 radius 1336.32
intensity 1.0 ambientIntensity 1.0 color 1.0, 1.0, 1.0 attenuation 1.0 0.0 0.0 }
The visibility (Fig. 6) was variantly resolved with regard to the time periods of the day. The effect was guarded by changing the visibility distance (visibilityRange), colour-ing the fog (color R/G/B) and by a process of mixing the object colours with the colours of the fog (fogType). Se-lected parameters are in Table 1.
Table 1. Parameters of visibility for time periods during the day
Period color R/G/B fogType visibilityRange Morning 0.2/0.3/0.1 exponential 25
Midday 0.6/0.6/0.6 linear 100
Evening 0.3/0.2/0.1 exponential 25 Night 0.1/0.1/0.1 exponential 10
Sound extension was executed by means of sounds di-rectly recorded in the forest and converted into the audio files WAV.
Interaction with the surrounding environment
[image:6.595.305.532.573.647.2]ensured by perception of the real size of the surrounding objects and their precise identification and simultane-ously by a possibility of changing the surrounding stand. Anyhow, the communication with growth simulator for a change of the forest state is also important. Percep-tion of the real sizes of trees (diameters and heights) was achieved by entering a 3D figure (i.e. Avatar) into the stand model, who “moves in the forest instead of the user”. This principle is the same as in computer games of “THIRD-PERSON” type. The user gains a real imagina-tion of tree dimensions on the basis of a relative compari-son of the figure “Avatar” and trees around. Imaging the attendant information of trees on which the cursor was placed (tree_text from input data structure) supports their identification. The process is guarded by the creation of a touch zone (i.e. TouchSensor) on the part of the stem (from height of 0.8 m to height of 1.8 m) and by sending information on tree to the console through the JavaScript (text on event isOver). The arbitrary data on tree (e.g. tree species, diameter, height, quality) is possible to insert into the item tree_text. An immediate interaction between the user and the stand culminates by a chance of marking the trees with repeated clicking on the stem in its touch zone. Marking represents a green strip (target tree) or red strip (cut tree) whipped around the stem at the breast height 1.3 m. This event is again activated by JavaScript (reac-tion on isActive). Information on tree marking is saved to the variable (tree_status from input data structure). The model of virtual stand also provides a possibility to cut a tree by clicking on his buttress touch zone. An action enables to take measure on releasing the stand canopy after the removal of competitors.
The final communication with the growth simulator (we utilised simulator SILVA) is carried out through the
transmission of resultant file containing the information on all the tree status to the console:
–1 ... tree marked for harvesting 0 ... unmarked tree
1 ... target tree.
RESULTS AND DISCUSSION
The methodology of virtual forest stand was examined as a tool for the training of stand tending: “thinning
train-ing tool”. For these purposes stand No. 802 from
Univer-sity Forest School Enterprise Zvolen was chosen, a mixed stand composed of these tree species: beech (53%), spruce (27%), maple (11%) and hornbeam (9%) at the age of 45 on the area of 0.37 ha. “The virtual thinning treatment” was carried out in this stand. A quality crown thinning was applied although the stand tending was divided into two phases: selective and release ones. The selective phase focused on future crop (CT) and target trees (TT). Its quantitative description is in Table 2. The release phase began at the age of 85 years and aimed to support the target trees (first the beech) in order to enlarge the growth incre-ment (i.e. light increincre-ment supply) by effective releasing their crowns.
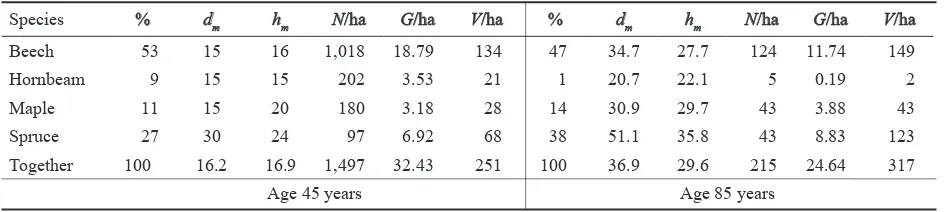
A comparison of the stand at the beginning (45 years) and at the end (85 years) of the thinning treatment is shown in Table 3. The thinning treatment increased the proportion of spruce and maple to the detriment of beech and mainly hornbeam, whose abundance was reduced to a minimum. The number of trees per hectare was reduced from 1,497 to 215 although the volume per hectare increased from 251 m3/ha to 317 m3/ha.
Aver-age stem volume increased from 0.14 m3 to 1.26 m3. In
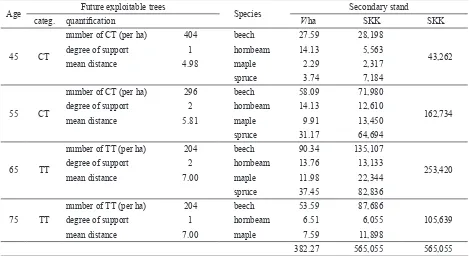
[image:7.595.63.535.490.746.2]Table 2 the yield from all thinning interventions in the Table 2. Selected thinning concept in a selective phase for stand 802
Age Future exploitable trees Secondary stand
categ. quantification Species V/ha SKK SKK
45 CT
number of CT (per ha) 404 beech 27.59 28,198
43,262
degree of support 1 hornbeam 14.13 5,563
mean distance 4.98 maple 2.29 2,317
spruce 3.74 7,184
55 CT
number of CT (per ha) 296 beech 58.09 71,980
162,734
degree of support 2 hornbeam 14.13 12,610
mean distance 5.81 maple 9.91 13,450
spruce 31.17 64,694
65 TT
number of TT (per ha) 204 beech 90.34 135,107
253,420
degree of support 2 hornbeam 13.76 13,133
mean distance 7.00 maple 11.98 22,344
spruce 37.45 82,836
75 TT
number of TT (per ha) 204 beech 53.59 87,686
105,639
degree of support 1 hornbeam 6.51 6,055
mean distance 7.00 maple 7.59 11,898
selective phase is evaluated on the basis of stand sorting and current wood prices (Ponukový cenník 2000). Total yield of thinnings is 565,055 SKK.
The methodology of virtual forest stand generation is a significant contribution to building the sophisticated sys-tems of modern forest electronic education (e-learning). In Slovakia it is especially important because no similar model has been developed until now. The assumed contri-butions can be summarised in the following points: – The model solves some methodological problems that
have not been resolved in an adequate way by other systems. It mainly applies to the real looking model of individual trees with real looking crown habit and bark textures for 26 tree species, to the original solu-tion to terrain model implementasolu-tion on the principle of representativeness for the competitive model, real looking surrounding environment and finally to a high level of interaction between the user and the forest stand environment.
– The connection with the growth simulator SILVA forms a suitable medium for the training of forest tending and in its present version it is ready to be used for forest education purposes. That is why this system has been experimentally introduced into the education process for subjects such as Silviculture and Forest Manage-ment at Forestry High School in Banská Štiavnica. – This system is built on VRML 97 language basis and
thus it is possible to integrate it into the Internet envi-ronment. Its connection with forest management infor-mation system LesHIS (FABRIKA 2002a) and with the general Slovak forest information system GOLEM is assumed (FABRIKA 2002c). In the years to come the system can be a modern tool not only for e-learning but also for decision support and prognostic purposes. – The model of virtual forest stand will be a part of the
Slovak simulator for forest biodynamics “SIBYLA” developed on the basis of growth model SILVA SK and a part of the envisaged thinning training tool “TREVYL”.
The designed methodology is a considerable contribu-tion to the three-dimensional modelling of virtual forest stands and forestry e-learning. For its wider application in the education process and forest information systems it will be necessary to resolve several methodological and applied questions as automated connection with forest data bank (forest management plan, geographic information system), completion of extension modules,
development of methodological instructions in the field of education, completion of virtual reality in the field of forest mensuration (methodology of sample plot establish-ment for stand forest inventory), promotion of this system into the Internet environment for “remote access” and so on. The new problems of standards for improving the vir-tual reality will be researched in a longer time span: flow data transmission, multiuser environment, direct support of programming languages and others (ŽÁRA 1999).
Acknowledgement
I am very grateful to Ing. MÁRIA PAČUTOVÁ for help-ing me with translation of the text into English.
References
AAS G., RIEDMILLER A.,1987. GU Naturführer Bäume. München, Gräfe und Unzer Verlag GmbH: 255.
BACHMANN M., 1998. Indizes zur Erfassung der Konkur-renz von Einzelbäumen. Methodische Untersuchung in Bergmischwäldern. Forstliche Forschungsberichte Nr. 171, München: 245.
BÉZIER P.E., 1972. Numerical Control – Mathematics and Application. London, John Wiley: 112.
CAREY R., BELL G., 1997. The Annotated VRML97 Reference Manual, Addison Wesley.
COOMBES A.J., 1992. Trees. London, Doorling Kindersley Ltd.: 320.
FABRIKA M., 2002a.Lesnícky informačný systém LesHIS. In: Zbor. ref. Nové metódy a techniky pre meranie lesa a dreva: VI-1–VI-8.
FABRIKA M., 2002b. Vizualizácia lesa – nástroj hľadania nových informačných súvislostí. In: Zbor. ref. Nové trendy v zisťovaní a monitorovaní stavu lesa, Zvolen – Poľana, 16.–17. september 2002: 172, CD príloha.
FABRIKA M., 2002c. GOLEM – globálna organizačná lesnícka elektronická mapa. Aplikačný program.
HASENAUER H.,1994.Ein Einzelbaumsimulator für ungleich-altrige Fichten-Kieferen- und Buchen-Fichtenmischbestände. Forstliche Schriftenreihe Universität für Bodenkultur, Wien, Band 8: 152.
KREMER B.P., 1995. Stromy. Sprievodca prírodou. Bratislava, Slovak edition Ikar: 287.
[image:8.595.63.536.72.178.2]McGAUGHEY R.J., 1997. Visualizing forest stand dyna-mics using the stand visualization system. In: Proc. of the 1997, ACSM/ASPRS Annual Convention and Exposition, Table 3. Comparison of the stand between the start and end of thinning concept
Species % dm hm N/ha G/ha V/ha % dm hm N/ha G/ha V/ha
Beech 53 15 16 1,018 18.79 134 47 34.7 27.7 124 11.74 149
Hornbeam 9 15 15 202 3.53 21 1 20.7 22.1 5 0.19 2
Maple 11 15 20 180 3.18 28 14 30.9 29.7 43 3.88 43
Spruce 27 30 24 97 6.92 68 38 51.1 35.8 43 8.83 123
Together 100 16.2 16.9 1,497 32.43 251 100 36.9 29.6 215 24.64 317
April 7–10, 1997. Seattle, WA. Bethesda, D: American Society for Photogrammetry and Remote Sensing. Vol. 4: 248–257. NAGEL J., 1996.Anwendungsprogramm zur
Bestandesbewer-tung und zur Prognose der Bestandesentwicklung. Forst u. Holz, 51: 76–78.
NAGEL J., BIGING G.S., 1995. Schätzung der Parameter der Weibullfunktion zur Generierung von Durchmesserverteilun-gen. AFJZ, 166: 185–189.
PAGAN J., RANDUŠKA D.,1987.Atlas drevín 1 (Pôvodné dreviny). Bratislava, Obzor: 360.
PAGAN J., RANDUŠKA D., 1988.Atlas drevín 1 (Cudzokrajné dreviny). Bratislava, Obzor: 408.
Ponukový cenníkihličnatých sortimentov surového dreva podľa STN 48 0055 platný na obdobie od 1. 1. 2000 do odvolania. Lesy Slovenskej republiky, š. p.
PRETZSCH H., 1992. Konzeption und Konstruktion von Wuchsmodellen für Rein- und Mischbestände. Forstliche Forschungsberichte München, Nr. 115: 332.
PRETZSCH H., 1993.Analyse und Reproduktion räumlicher Bestandesstrukturen. Versuche mit dem Strukturgenerator STRUGEN, Schriften aus der Forstlichen Fakultät der
Uni-versität Göttingen und der Niedersächsischen Forstlichen Versuchsanstalt, Bd. 114: 87.
PRETZSCH H., KAHN M., 1998. Konzeption und Konstruk-tion des Wuchsmodells SILVA 2.2 – Methodische Grundlagen. Abschlußbericht Projekt W 28, Teil 2, München: 277. SEIFERT S., 1998. Dreidimensionale Visualisierung des
Waldwachstums. Diplomarbeit im Fachbereich Informatik der Fachhochschule München in Zusammenarbeit mit dem Lehrstuhl für Waldwachstumskunde der Ludwig-Maximil-lians-Universität München, München.
STERBA H., 1995. Prognaus – ein absandsunabhängiger Wachstumssimulator für ungleichaltrige Mischbestände. DVFF – Sektion Ertragskunde, Joachimstahl: 173–183. ŠMELKO Š., PÁNEK F., ZANVIT B., 1987. Matematická
for-mulácia systému jednotných výškových kriviek rovnovekých porastov SSR. Acta Fac. For. Zvolen., XIX: 151–174. ŽÁRA J., 1999. VRML97 Laskavý průvodce virtuálními světy.
Brno, Computer Press: 238.
ŽÁRA J. et al., 1992. Počítačová grafika – principy a algoritmy. Praha, Grada, a. s.: 472.
Received for publication April 14, 2003 Accepted after corrections June 26, 2003
Virtuálny lesný porast ako súčasť sofistikovaných lesníckych vzdelávacích systémov
M. FABRIKA
Technická univerzita, Lesnícka fakulta, Zvolen, Slovenská republika
ABSTRAKT: Príspevok prezentuje metodiku generovania virtuálnych lesných porastov. Virtuálny porast slúži pre lesníc-ke elektronické vzdelávanie (e-learning) ako nástroj pre tréning výchovy lesa a demonštráciu rôznych porastových štruktúr a rôznych dendrometrických postupov. Model je možné prepojiť s rastovým simulátorom a integrovať do prostredia geografic-kého informačného systému, prípadne do prostredia Internetu. V prvej časti príspevku je predstavená metodológia vizualizácie jednotlivých stromov, celých porastov, terénu a okolitého prostredia, ako aj princíp interakcie užívateľa s virtuálnym lesom. Pre účely tvorby virtuálneho porastu bol použitý jazyk VRML 97. V druhej časti je predstavený príklad použitia modelu pre tréning výchovy lesných porastov.
Kľúčové slová:vizualizácia lesa; modelovanie lesa; e-learning; VRML 97; prebierkový trenažér
V lesnícky vyspelých európskych krajinách sa neustále zdokonaľujú modely a softwarové systémy pre simuláciu a prognózovanie rastu lesa (PRETZSCH 1992; HASE -NAUER 1994; STERBA 1995; NAGEL 1996). Neoddeliteľnou súčasťou uvedených modelov a počítačových programov sú nadstavbové moduly pre vizualizáciu lesa. Umožňujú sprehľadniť výsledky simulácií a vizuálne zachytiť dynamiku vývoja lesných porastov. Novým trendom využitia týchto modelov je prienik do oblasti výchovy a vzdelávania lesníckej verejnosti. S tým súvisí prechod od statickej vizualizácie lesa k dynamickému virtuálnemu lesnému porastu. Cieľom príspevku je predložiť metodiku na generovanie virtuálnych lesných porastov a predstaviť
jej praktickú realizáciu. Navrhovaný systém bude súčasťou rastového simulátora „SIBYLA“ a prebierkového tre-nažéra „TREVYL“ budovaného na Katedre hospodárskej úpravy lesov a geodézie Technickej univerzity vo Zvo-lene v rámci informačného systému pre užívateľa lesa (FABRIKA 2002a).
vizualizácia okolitého prostredia pre dokonalý virtuálny zážitok a napokon zabezpečenie interaktivity užívateľa s prostredím virtuálneho lesa.
Pre účely tvorby virtuálnych lesných porastov sme zvolili platformu jazyka VRML 97 (CAREY, BELL 1997; ŽÁRA 1999). Pre vizualizáciu jednotlivých stro-mov sme využili model vizualizácie, ktorý vychádza z najmodernejších postupov používaných pri vývoji najnovších 3D počítačových hier. Princíp je zobrazený na obr. 1. Strom bol rozdelený do troch častí: kmeň, koruna a koreňový nábeh. Kmeň a koreňový nábeh sú tvorené do seba zapadajúcimi kužeľmi. Koruna je vytvorená štyrmi rovinami, ktoré sú pootočené o 45°. Reálny vzhľad stro-mov bol zabezpečený kvalitnými textúrami. Parametre geometrických objektov sa vypočítajú na základe vzťahov (1)–(3). Celkovo bolo vytvorených 26 prototypov drevín. Príklad niektorých je na obr. 2.
Na generovanie štruktúry porastu z bežne dostupných informácií o lese (napríklad lesného hospodárskeho plánu) bol použitý generátor štruktúry porastu. Model vychádza z generátora STRUGEN (PRETZSCH 1993), ktorý bol prispôsobený pre slovenské podmienky. Na ge-nerovanie hrúbkových početností bol použitý vzťah (4), výšky stromov sú odvodené z jednotnej výškovej krivky (5), parametre korún sa dopočítajú podľa rovníc (6)–(7). Princíp generovania polohových súradníc je znázornený na obr. 3.
Model terénu pre virtuálnu plochu porastu sa extrahuje z vrstvy GIS podľa obr. 4. Z extrahovanej plochy sa odvodí sieť 5 × 5 m (lattices). Sieť sa použije na odvodenie výškových súradníc stromov na základe bilineárnej interpolácie (8)–(10). Terén sa vizualizuje pomocou racionálnej Bézierovej plochy (obr. 5).
Metodika tvorby virtuálneho lesného porastu rieši aj otázky pozadia, osvetlenia, viditeľnosti a ozvučenia. Rovnako je zabezpečená aj interaktivita užívateľa s pro-stredím virtuálneho lesa (identifikácia parametrov stro-mov, vyznačovanie stromov a ich ťažba, komunikácia s rastovým simulátorom).
Metodika virtuálneho lesného porastu bola vyskúšaná ako nástroj pre tréning výchovy porastov „prebierkový trenažér“ na poraste Vysokoškolského lesného podniku Zvolen č. 802. Popis jednotlivých zásahov pokusnej pre-bierky je v tab. 2. V tab. 3 je zobrazené porovnanie stavu porastu na začiatku (45 rokov) a na konci (85 rokov) prebierkového režimu.
Navrhovaná metodika je významným prínosom k pro-blematike trojdimenzionálneho modelovania virtuálnych lesných porastov a lesníckeho elektronického vzdeláva-nia. Pre rozsiahlejšie zavedenie do vzdelávacieho procesu a lesníckych informačných systémov bude potrebné vyriešiť niekoľko ďalších metodických a praktických otázok ako je automatizované prepojenie na banku lesníckych údajov (lesný hospodársky plán, geografický informačný systém), dokončenie rozširujúcich programových modulov, vypracovanie systému metodických pokynov pre oblasť vzdelávania, dopracovanie virtuálnej reality pre oblasť dendrometrie (metodika zakladania skusných plôch pre maloplošnú inventarizáciu lesa), nasadenie systému do prostredia Internetu pre „vzdialený prístup“ a podobne. V dlhšom časovom horizonte sú otvorené aj otázky nových štandardov pre zdokonaľovanie virtuálnej reality, a to: prúdového prenosu dát, viac užívateľského prostre-dia, priamej podpory programovacích jazykov a ďalších.
Corresponding author:
Ing. MAREK FABRIKA, Ph.D., Technická univerzita, Lesnícka fakulta, Katedra hospodárskej úpravy lesov a geodézie, T. G. Masaryka 24, 960 53 Zvolen, Slovenská republika