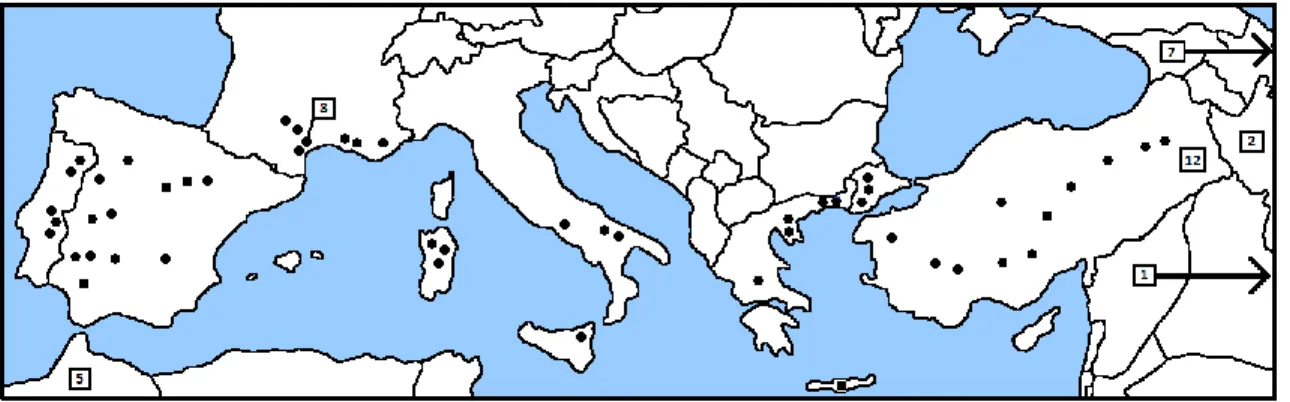
TAENIATHERUM CAPUT-MEDUSAE
142
0
0
Full text
(2)
(3)
(4)
(5)
(6)
(7)
(8)
(9)
(10)
(11)
(12)
(13)
(14)
(15)
(16)
(17)
(18)
(19)
(20)
(21)
(22)
(23)
(24)
(25)
(26)
(27)
(28)
(29)
(30)
(31)
(32)
(33)
(34)
(35)
(36)
(37)
(38)
(39)
(40)
(41)
(42)
(43)
(44)
(45)
(46)
Figure


+7


Related documents
amarus leaves aqueous extract to castor oil induced diarrhea rats, Charcoal meal test and.. PGE 2 induced enteropooling gastric motility could decrees in activity via
Additionally, our results performed that down- regulation of CXCR3A and up-regulation of CXCR3B brought about the increased expres- sions of PLCβ, MMP-1, and MMP-3 except
One of the important contributing factors in severe or refractory asthma is the increase in the airway smooth muscle mass. Bronchial thermoplasty is a procedure were thermal
Erin Davis, Parker Trudeau, Geneva Wandahsega, Marilyn Shawano, Crystal Lea, Jackie Kang, Charlotte Harris (in at 3:40), Mary
Dynamic analysis of nitrate, nitrite content and nitrosodimethylamine (NDMA) and nitrosodiethylamine (NDEA) formation were performed on meat samples (chicken ham,
According to other research, veterans had worse health if they were deployed to a combat zone than if they were not, but only within the first five years after they
Haematological parameters evaluated include packed cell volume (PCV), Haemoglobin (Hb) and white blood cell (WBC), while some biochemical parameters studied were liver
ефективна допрофесійна підготовка учнівської молоді може здійснюватися тільки за умови створення цілісної системи функціонування закладу середньої освіти – ліцею,
