JOURNAL OF FOREST SCIENCE, 51, 2005 (2): 77–94
Plywood sheets are defined as sheets with mutual-ly glued plies, the direction of fibres of neighbouring plies being perpendicular to each other. In general, outside and inside plies on both sides are symmetri-cal with respect to the core (or central ply).
The manufacture of plywood sheets belongs to the youngest branches of the wood-processing industry. Plywood sheets have occupied one of the leading places on the market of large-area materials. They are used in many sectors of human activities, e.g. in engineering, textile industry, furniture manufacture, transport, industrial and building production, etc.
Plywood materials, together with agglomerated materials are ranked among large-area materials. They are manufactured by hot-pressing the sets of veneers spread with a synthetic adhesive under interaction of pressure.
As against agglomerated materials, i.e. particle-boards and fibreparticle-boards, they show certain advan-tages. They are substantially lighter (showing lower
density) and demonstrate higher values of particular mechanical and physical properties. Their main ad-vantage is that they maintain an appearance of natu-ral wood. Plywood sheets can also be manufactured as formed moulded articles. In general, their coating (surface finish) is simple. According to the purpose of use, plywood sheets can be manufactured as ex-terior (water-resistant) plywoods by adding special types of synthetic adhesives or using special foils.
Plywood sheets show, however, the greatest use in furniture industry (non-water-resistant plywoods). In building industry, however, exterior water-re-sistant plywood sheets are used. Building industry uses plywood sheets also for the construction and manufacture of floors, plywood lining, structural walls, laminated constructions, etc. As for trans-port, plywood sheets are used in the manufacture of railway cars, buses, trams, lorries, ships, etc.
Plywood sheets are categorised according to the construction to plywoods (joinery, building,
pack-Assessing the bending strength and modulus of elasticity
in bending of exterior foiled plywoods in relation
to their construction
J. HRÁZSKÝ, P. KRÁL
Faculty of Forestry and Wood Technology, Mendel University of Agriculture and Forestry Brno,
Brno, Czech Republic
ABSTRACT: The paper summarizes results of an institutional research aimed at assessing the bending strength and modulus of elasticity in bending of exterior foiled combined and all-beech plywoods in relation to their construction. A relationship was studied of the plywood construction and selected physical and mechanical properties. In studied sheets, moisture, density, bending strength and modulus of elasticity were analysed along and across the grain of the upper veneer. All measurements were carried out in water-resistant plywoods with surface treatment with a phe-nolformaldehyde foil 8, 10, 12 and 15 mm thick in combined plywoods and 10, 12, 15 and 18 mm thick in all-beech plywoods. The construction of plywoods significantly influences their quality that is determined particularly by the bending strength and modulus of elasticity. Using regression analysis relationships were demonstrated particularly that with the increasing moisture content of plywoods the bending strength decreased and with the increasing density the bending strength and modulus of elasticity increased. The same trend was also proved in connection with the increas-ing number of veneers of plywood sheets. Usincreas-ing correlation analysis, combinations of interrelationships of the given properties were statistically tested.
aging, aircraft, laminated wood), core boards (lam-inboards, blockboards, battenboards, veneered boards), sandwich boards (honey-comb panels) and also according to the form (flat and shaped).
Another categorisation of plywood sheets can be made according to main qualitative parameters, i.e. according to service life (for use in outdoor condi-tions and in the interior dry environment), mechani-cal properties, surface appearance, surface treatment (sanded, non-sanded, surface treated, coated).
The plywood sheet quality is assessed according to many criteria and characteristics. Generally, it is possible to state that plywood sheets are classified according to particular standards. They have to meet requirements for size accuracy (sizes and dimension stock), gluing quality, external qualitative param-eters, physical and mechanical properties, special requirements of customers (decreased release of formaldehyde, increased fire resistance, mould, fungi and insect resistance).
Bending strength and modulus of elasticity (MOE) in bending of plywood materials are affected by a number of factors, viz. tree species, tree quality, wood moisture, wood density, wood structure, temperature, number of plies, adhesive, and permanent load.
Effects of wood moisture
The moisture content of veneers used for the production of plywood sheets ranges between 4 and 10%. Strength and elastic properties of wood and wood-based materials are dependent on the mois-ture content up to the fibre-saturation point. Above the point, the properties do not change any more. Within the moisture range of 8 to 18%, changes in properties of wood and plywood sheets are most intensive being linear. With the moisture change by 1% (at a range of 5–30%) the bending strength is changed by 4% and MOE by 1% (ŠTELLER 1978).
Effects of density
With the increasing density, MOE in bending and bending strength increase. The relation is expressed linearly. The relationship between density and me-chanical properties of wood is more complicated because wood strength is dependent not only on its density but also on its anatomical structure. Effects of density are most shown in dry wood be-ing inexpressive at the moisture content above the hygroscopicity point (ŠTELLER 1967).
Effects of temperature
With the increasing temperature MOE in bending and bending strength decrease. Effects of a tem-perature on mechanical properties change with the
moisture content. Interactions of temperature and wood moisture are markedly manifested at 60–90°C. With the increasing temperature and moisture con-tent wood strength markedly decreases. Simultane-ous effects of both the factors decrease the wood strength more than separate effects of each of the factors (MATOVIČ 1993).
Effects of permanent load
In practice, except short-term load timber struc-tures are stressed also by permanent load. Un-der long-term load, wood deformation occurs (KOŽELOUH 1998). With a longer period of load the values characterising wood strength decrease. Therefore, under conditions of permanent load the results from short-term static loads cannot be used. Long-term behaviour of plywoods is based on wood quality, course of load, wood moisture and wood temperature. Therefore, it is necessary to take into account a reduction of the bending MOE value for permanent load by a certain value, viz.:
– for long-term load operating more than 1 year: 0.7–0.4
– for medium-term load operating less than 1 year: 0.8–0.6
– for short-term load operating less than 1 week: 1.0–0.7.
Effects of the number of plies
In bending load, a decisive role is played by the geometrical arrangement of particular plies. Prop-erties of particular plies and their proportion in the total thickness of a sheet are a cardinal parameter. In elements subject to bending load, it is possible to carry out the extreme reduction of a central ply (e.g. using the honeycomb structure or foams) and thus to obtain relatively light combined boards with the high modulus of elasticity and bending strength. The reduction of central plies can, however, cause problems in the application of the boards, e.g. in mounting fittings (BALDWIN 1973).
Effects of structure
determines resistance to weather effects. Taking into account particular factors mentioned above the properties of solid wood can be even exceeded. As compared with solid wood marked homogenisation can be achieved because defective spots (knots, splits, etc.) are evenly distributed. A possibility to adapt the anisotropy of plywood sheets to a certain construc-tional function by the choice of the thickness profile appears to be a great advantage of plywood sheets that cannot be achieved by competitive semifinished products at all or only by a very difficult adaptation of production technology. The producer of plywood sheets is, however, limited by regulations on the admissible thickness of particular veneers. Relation-ships between the sheet construction and elastic and strength properties make it possible to calculate elastomechanical properties (when the sheet con-struction is known) or under requirements for certain elastomechanical properties to find out the sheet construction that can fulfil the requirements.
Present trends in veneer and plywood production are characterised by the fact that production has been transferred into regions with cheap working sources and inexpensive labour. Asia has accounted for the largest proportion since 1991. In 2000, it was already 48% of the world production of plywoods. The second largest producer of plywoods is North America with 34% market share. Europe occupies the third position with only 10% of the world production.
In many regions, plywood production is oriented to various special products the purpose of which is to substitute solid wood in other technologies or other kinds of materials, for example metals and plastics. Maximum use of decorative properties of natural wood is also of great importance.
Another effect influencing the plywood produc-tion is the expansion of producproduc-tion of other types of large-area materials, mainly particleboards and
fibreboards. These cheaper materials lead to a de-creased use of plywoods in standard technologies, e.g. in the manufacture of furniture and wooden constructions, which naturally results in the stagna-tion of plywood sheet producstagna-tion.
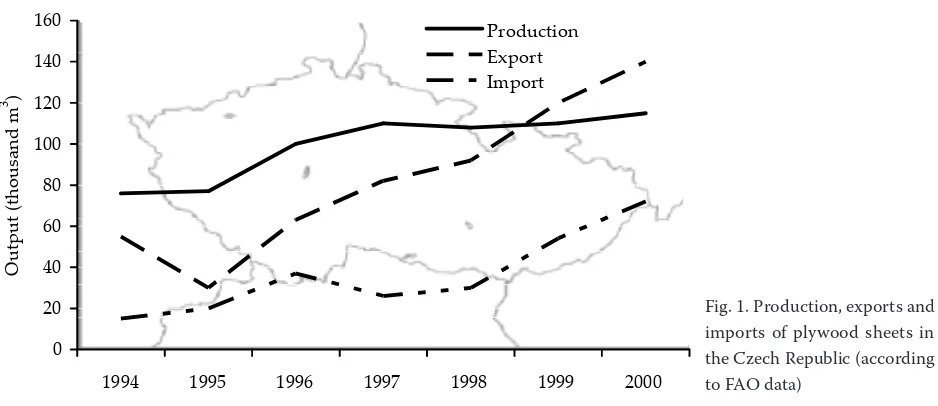
Fig. 1 depicts the situation of the production, ex-ports and imex-ports of plywoods in the CR. The figure indicates the stagnation of plywood production due to the high volume of imports of cheaper plywood sheets from Asia, Brazil, etc. The increasing export of plywoods from the Czech Republic accounted, however, for only 2.3% from the total volume of exports of wood products in 2000. Sawn timber with its volume of 1,701,000 m3 shows the largest
proportion in exports from the CR.
The aim of the paper was to assess the bending strength and modulus of elasticity of exterior foiled plywoods in relation to their construction.
Mechanical loading means the process when interactions occur between mechanical forces and other loading factors in wood. Temporary or per-manent changes in the body form are a result of the process.
According to physical nature, loading of wood or wood-based materials is divided into mechanical, moisture, thermal and other types of loading.
During the action of an external force on a body a stress (σ) occurs in the body. The stress is defined as the size of an internal force related to the unit area. If forces act perpendicularly to the body surface, it is normal stress. It is calculated according to the following relation:
F
σ = S
where: F – the force uniformly acting on the body surface (N),
S – the body surface (mm2).
0 20 40 60 80 100 120 140 160
1994 1995 1996 1997 1998 1999 2000
O
ut
pu
t(
th
ou
sa
nd
m
3 )
[image:3.595.64.533.561.764.2]Production Export Import
If forces act parallelly to the body surface, they cause so-called shear stress (τ). It is calculated ac-cording to the following relation:
Fτ
τ = S
where: F – the force uniformly acting on the body surface (N),
S – the body surface (mm2).
Normal and shear stress is expressed in N/mm2.
Because of the effect of external forces, changes in the body size, volume or shift in dimensions occur and thus also the partial change in the body form. These changes are called deformations.
Wood or more accurately the basis of its cell walls represents in principle a complex of natural polymers with long chain molecules. The structure of polymers determines the nature of their behav-iour under loading. If external forces act on the polymers, the following three types of deformations can occur:
– immediate elastic deformation (εp) – caused by reversible changes in average distances between chain molecules of polymers (it occurs immedi-ately during the action of the force and after its relaxation it promptly disappears);
– elastic deformation developing with time (εt) – sometimes called elastic deformation con-nected with the reversible rearrangement of par-ticles of chain molecules (it increases gradually with time and disappears after some time after relaxation);
– plastic (irreversible) deformation (εpl) – caused by intermixing the chain molecules. It remains after the acting force was relaxed (it is also called residual deformation, permanent deformation). In wood, deformations caused by changes in the moisture content occur very often. Wood obtains various dimensions thereby being deformed. Swell-ing represents elastic deformations. As soon as wood changes its dimensions and shape, internal forces have to originate in the wood causing stress (moisture stress). After the removal of water from the wood structure the wood obtains its original dimensions and deformations disappear.
Relationships between stress and deformation provide very useful information for the development of production of construction materials of wood. These relationships are of great importance mainly in determining parameters for plywood pressing, laminated densified wood, particleboards, etc.
Characteristics of failures in bending stress are various. They are primarily dependent on the geom-etry of shape, wood structure and effects of external
forces. Several basic characteristics of failures are distinguished (Figs. 2–5).
MATERIAL AND METHODS
Tests were carried out on foiled exterior plywood sheets of two types of construction with slip-resist-ant (skidproof) treatment.
The construction of combined plywood sheets is given in Table 1 and that of all-beech plywood sheets in Table 2.
In both types of plywood sheet construction, producers give the surface density of surface foils 167 g/m2, gluing class 3 according to ČSN EN
314-2 (49 0173) standard, i.e. complying with AW 100 test and formaldehyde emission class A according to ČSN EN 1084 (49 2407) standard.
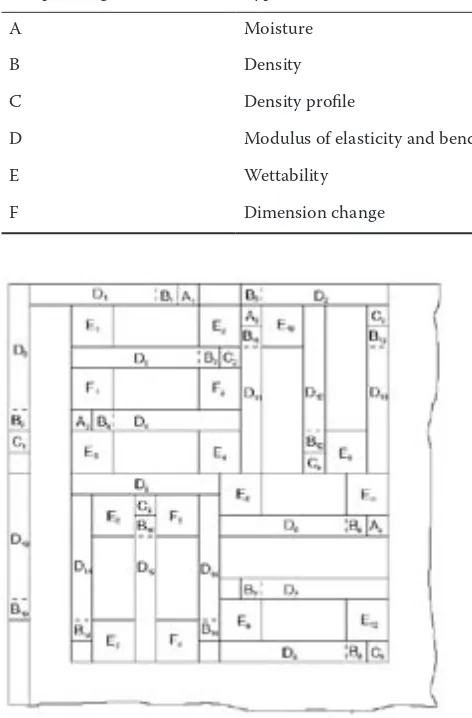
According to EN 326-1 and EN 325 standards, plans of plywood cutting were prepared. An exam-ple of the plan for plywoods 15 mm thick is depicted in Fig. 6. The number of samples used for the tests is given in Table 3.
Particular physical and mechanical properties of plywood sheets were determined according to the following standards:
– ČSN EN 310 Determination of modulus of elastic-ity in bending and bending strength
– ČSN EN 322 Boards of wood – Determination of moisture
– ČSN EN 323 Boards of wood – Determination of density
Fig. 2. Failure in the central ply caused by the effect of shear stress
Fig. 3. Failure caused by the fibre rupture in the tensile zone
Fig. 4. Failure – a blunt fracture along the height of the body
– ČSN EN 325 Determination of dimensions of sample pieces
– ČSN-EN 326 -1 Boards of wood. Sampling, cutting and control. Part 1: Sampling, cutting test pieces and expressing the test results.
Normality of sets was verified using Shapiro-Wilkov’s test. Subsequently, single-factor analysis of variance was carried out; to assess the interre-lations of sets correlation and regression analysis was used.
RESULTS AND DISCUSSION
Moisture
[image:5.595.63.299.379.738.2]Results of moisture measurements with basic statistic characteristics of combined and all-beech plywoods are given in Table 4.
Table 1. Construction of exterior plywoods – combined plywoods
Plywood thickness Number of plies Construction
8 5 1.5 – 2.6 – 1.5 – 2.6 – 1.5
10 7 1.5 – 1.8 – 1.5 – 1.8 – 1.5 – 1.8 – 1.5
12 7 1.5 – 2.6 – 1.5 – 2.6 – 1.5 – 2.6 – 1.5
15 7 1.5 – 3.5 – 1.5 – 3.5 – 1.5 – 3.5 – 1.5
18 9 1.5 – 3.5 – 1.5 – 3.5 – 1.5 – 3.5 – 1.5 – 3.5 – 1.5
Veneer thickness 1.5 mm – beech other veneer thickness – coniferous species
Table 2. Construction of exterior plywoods – all-beech plywoods
Plywood thickness Number of plies Veneer thickness of all plies (mm)
10 7 1.5
12 9 1.5
15 11 1.5
18 13 1.5
Table 3. Number of samples for particular tests from one plywood sheet
Sample designation Type of the test Number of samples
A Moisture combined 4/all-beech 8
B Density 16
C Density profile 6
D Modulus of elasticity and bending strength 8
E Wettability 12
F Dimension change 4
Table 4. Moisture content of combined and all-beech plywoods
Statistic value
Combined All-beech
8 10 12 15 18 10 12 15 18
n 8 8 8 8 8 8 8 8 8
–
x 9.16 8.74 9.68 9.24 9.22 9.78 10.04 10.41 10.18
S 0.76 0.34 0.50 0.13 0.29 0.42 1.599 0.519 0.389
V (%) 8.31 3.84 5.20 1.41 3.12 4.30 15.93 4.986 3.824
Min. 8.62 8.36 8.89 9.07 8.86 9.16 6.393 9.707 9.614
Max. 10.66 9.45 10.42 9.43 9.65 10.49 11.49 11.16 10.75
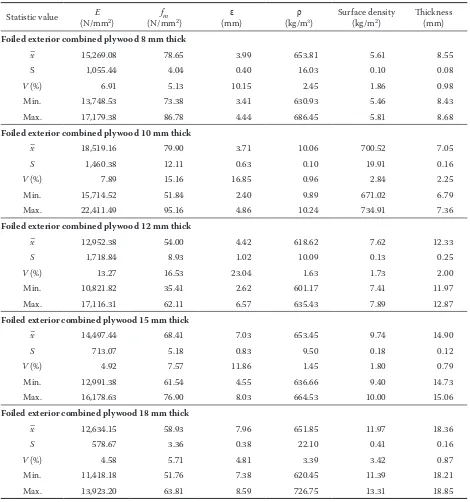
Table 5. Modulus of elasticity and bending strength of combined plywoods along the grain (n = 16)
Statistic value (N/mmE 2) (N/mmfm 2) (mm)ε (kg/mρ 3) Surface density (kg/m2) Thickness (mm)
Foiled exterior combined plywood 8 mm thick
–x 15,269.08 78.65 3.99 653.81 5.61 8.55
S 1,055.44 4.04 0.40 16.03 0.10 0.08
V (%) 6.91 5.13 10.15 2.45 1.86 0.98
Min. 13,748.53 73.38 3.41 630.93 5.46 8.43
Max. 17,179.38 86.78 4.44 686.45 5.81 8.68
Foiled exterior combined plywood 10 mm thick
–x 18,519.16 79.90 3.71 10.06 700.52 7.05
S 1,460.38 12.11 0.63 0.10 19.91 0.16
V (%) 7.89 15.16 16.85 0.96 2.84 2.25
Min. 15,714.52 51.84 2.40 9.89 671.02 6.79
Max. 22,411.49 95.16 4.86 10.24 734.91 7.36
Foiled exterior combined plywood 12 mm thick
–x 12,952.38 54.00 4.42 618.62 7.62 12.33
S 1,718.84 8.93 1.02 10.09 0.13 0.25
V (%) 13.27 16.53 23.04 1.63 1.73 2.00
Min. 10,821.82 35.41 2.62 601.17 7.41 11.97
Max. 17,116.31 62.11 6.57 635.43 7.89 12.87
Foiled exterior combined plywood 15 mm thick
–x 14,497.44 68.41 7.03 653.45 9.74 14.90
S 713.07 5.18 0.83 9.50 0.18 0.12
V (%) 4.92 7.57 11.86 1.45 1.80 0.79
Min. 12,991.38 61.54 4.55 636.66 9.40 14.73
Max. 16,178.63 76.90 8.03 664.53 10.00 15.06
Foiled exterior combined plywood 18 mm thick
–x 12,634.15 58.93 7.96 651.85 11.97 18.36
S 578.67 3.36 0.38 22.10 0.41 0.16
V (%) 4.58 5.71 4.81 3.39 3.42 0.87
Min. 11,418.18 51.76 7.38 620.45 11.39 18.21
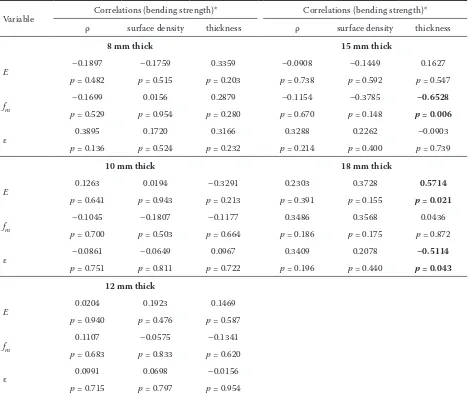
Table 6. Correlation analysis of combined plywoods along the grain
Variable Correlations (bending strength)* Correlations (bending strength)*
ρ surface density thickness ρ surface density thickness
8 mm thick 15 mm thick
E –0.1897 –0.1759 0.3359 –0.0908 –0.1449 0.1627
p = 0.482 p = 0.515 p = 0.203 p = 0.738 p = 0.592 p = 0.547
fm
–0.1699 0.0156 0.2879 –0.1154 –0.3785 –0.6528
p = 0.529 p = 0.954 p = 0.280 p = 0.670 p = 0.148 p = 0.006
ε 0.3895 0.1720 0.3166 0.3288 0.2262 –0.0903
p = 0.136 p = 0.524 p = 0.232 p = 0.214 p = 0.400 p = 0.739
10 mm thick 18 mm thick
E 0.1263 0.0194 –0.3291 0.2303 0.3728 0.5714
p = 0.641 p = 0.943 p = 0.213 p = 0.391 p = 0.155 p = 0.021
fm –0.1045 –0.1807 –0.1177 0.3486 0.3568 0.0436
p = 0.700 p = 0.503 p = 0.664 p = 0.186 p = 0.175 p = 0.872
ε –0.0861 –0.0649 0.0967 0.3409 0.2078 –0.5114
p = 0.751 p = 0.811 p = 0.722 p = 0.196 p = 0.440 p = 0.043
12 mm thick
E 0.0204 0.1923 0.1469
p = 0.940 p = 0.476 p = 0.587
fm 0.1107 –0.0575 –0.1341
p = 0.683 p = 0.833 p = 0.620
ε 0.0991 0.0698 –0.0156
p = 0.715 p = 0.797 p = 0.954
*Marked correlations are significant atp < 0.050;n = 16 (casewise deletion of missing data
Density, strength and modulus of elasticity of plywood sheets
Results of measurements with basic statistic characteristics of density, strength and MOE of combined and all-beech plywoods and results of correlation analysis are given in Tables 4–12. Ta-ble 12 is an aggregate taTa-ble of bending strength and MOE in bending for combined plywoods, Table 13 gives results of the respective correlation analysis. Table 14 is an aggregate table of bending strength and MOE in bending for all-beech plywoods, Table 15 gives results of the respective correlation analysis. Table 16 gives results of correlation analy-sis for combined and all-beech plywoods. Important relationships are represented in italics. Negative correlation coefficient expresses negative depend-ence. The value ofp given in tables under correlation
coefficients expresses probability of the occurrence of a studied phenomenon in the basic set.
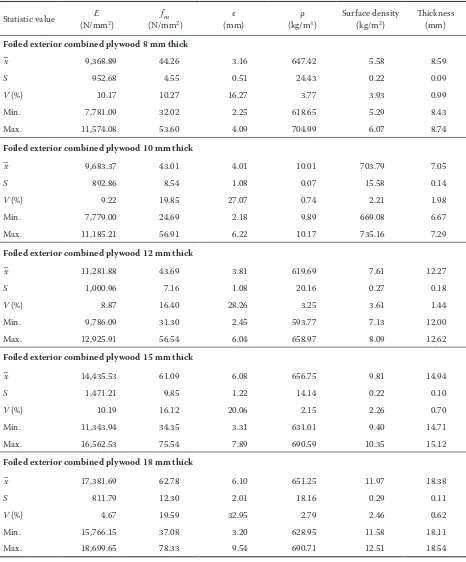
Table 7. Modulus of elasticity and bending strength of combined plywoods across the grain (n = 16)
Statistic value (N/mmE 2) fm
(N/mm2) (mm)ε (kg/mρ 3) Surface density (kg/m2) Thickness (mm) Foiled exterior combined plywood 8 mm thick
–x 9,368.89 44.26 3.16 647.42 5.58 8.59
S 952.68 4.55 0.51 24.43 0.22 0.09
V (%) 10.17 10.27 16.27 3.77 3.93 0.99
Min. 7,781.09 32.02 2.25 618.65 5.29 8.43
Max. 11,574.08 53.60 4.09 704.99 6.07 8.74
Foiled exterior combined plywood 10 mm thick
–x 9,683.37 43.01 4.01 10.01 703.79 7.05
S 892.86 8.54 1.08 0.07 15.58 0.14
V (%) 9.22 19.85 27.07 0.74 2.21 1.98
Min. 7,779.00 24.69 2.18 9.89 669.08 6.67
Max. 11,185.21 56.91 6.22 10.17 735.16 7.29
Foiled exterior combined plywood 12 mm thick
–x 11,281.88 43.69 3.81 619.69 7.61 12.27
S 1,000.96 7.16 1.08 20.16 0.27 0.18
V (%) 8.87 16.40 28.26 3.25 3.61 1.44
Min. 9,786.09 31.30 2.45 593.77 7.13 12.00
Max. 12,925.91 56.54 6.04 658.97 8.09 12.62
Foiled exterior combined plywood 15 mm thick
–x 14,435.53 61.09 6.08 656.75 9.81 14.94
S 1,471.21 9.85 1.22 14.14 0.22 0.10
V (%) 10.19 16.12 20.06 2.15 2.26 0.70
Min. 11,343.94 34.35 3.31 631.01 9.40 14.71
Max. 16,562.53 75.54 7.89 690.59 10.35 15.12
Foiled exterior combined plywood 18 mm thick
–x 17,381.69 62.78 6.10 651.25 11.97 18.38
S 811.79 12.30 2.01 18.16 0.29 0.11
V (%) 4.67 19.59 32.95 2.79 2.46 0.62
Min. 15,766.15 37.08 3.20 628.95 11.58 18.11
Max. 18,699.65 78.33 9.54 690.71 12.51 18.54
and relative deformation on the number of plies in all-beech plywoods.
Fractures of plywoods
The bending tests have demonstrated that both combined and all-beech plywoods of all thicknesses
comply with minimum strength values given by DIN 68 705 Teil 3 standard.
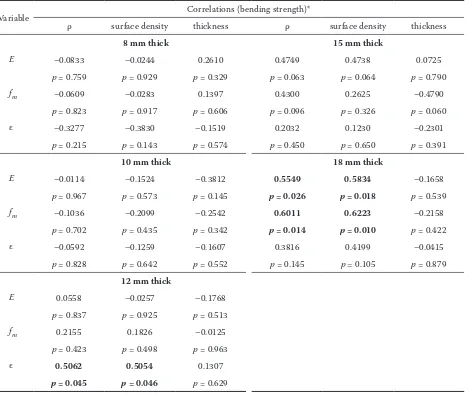
Table 8. Correlation analysis of combined plywoods across the grain
Variable Correlations (bending strength)*
ρ surface density thickness ρ surface density thickness
8 mm thick 15 mm thick
E –0.0833 –0.0244 0.2610 0.4749 0.4738 0.0725
p = 0.759 p = 0.929 p = 0.329 p = 0.063 p = 0.064 p = 0.790
fm –0.0609 –0.0283 0.1397 0.4300 0.2625 –0.4790
p = 0.823 p = 0.917 p = 0.606 p = 0.096 p = 0.326 p = 0.060
ε –0.3277 –0.3830 –0.1519 0.2032 0.1230 –0.2301
p = 0.215 p = 0.143 p = 0.574 p = 0.450 p = 0.650 p = 0.391
10 mm thick 18 mm thick
E –0.0114 –0.1524 –0.3812 0.5549 0.5834 –0.1658
p = 0.967 p = 0.573 p = 0.145 p = 0.026 p = 0.018 p = 0.539
fm –0.1036 –0.2099 –0.2542 0.6011 0.6223 –0.2158
p = 0.702 p = 0.435 p = 0.342 p = 0.014 p = 0.010 p = 0.422
ε –0.0592 –0.1259 –0.1607 0.3816 0.4199 –0.0415
p = 0.828 p = 0.642 p = 0.552 p = 0.145 p = 0.105 p = 0.879
12 mm thick
E 0.0558 –0.0257 –0.1768
p = 0.837 p = 0.925 p = 0.513
fm 0.2155 0.1826 –0.0125
p = 0.423 p = 0.498 p = 0.963
ε 0.5062 0.5054 0.1307
p = 0.045 p = 0.046 p = 0.629
[image:9.595.66.535.73.468.2]*Marked correlations are significant atp < 0.050;n = 16 (casewise deletion of missing data)
Fig. 7. Dependence of modulus of elasticity on the sheet thick-ness in combined plywoods
Fig. 8. Dependence of bending strength on the sheet thickness in combined plywoods
in cross direction. The failures occurred as a result of surmounting the central veneer shear strength (Fig. 30). Fig. 31 depicts failures in the central zone due to the central veneer defect.
The results of correlation and regression analysis for particular thicknesses and directions of the
act-ing force as related to density, surface density and thickness proved the relationships only in a small number of measurements.
Correlation analysis has demonstrated more re-lationships in aggregate sets for particular types of plywoods (Tabs. 13 and 14). Table 13 demonstrates
5,000 10,000 15,000 20,000 25,000
6 8 10 12 14 16 18 20
Board thickness (mm)
E
(N
/m
m
2 )
40 50 60 70 80 90
6 8 10 12 14 16 18 20
Board thickness (mm)
f(Nm
/m
m
2 )
——
along– –
across——
along
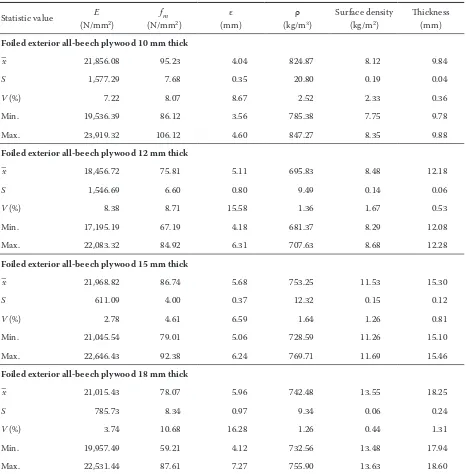
Table 9. Modulus of elasticity and bending strength of all-beech plywoods along the grain (n = 8)
Statistic value E
(N/mm2)
fm
(N/mm2)
ε (mm)
ρ
(kg/m3)
Surface density (kg/m2)
Thickness (mm)
Foiled exterior all-beech plywood 10 mm thick
–x 21,856.08 95.23 4.04 824.87 8.12 9.84
S 1,577.29 7.68 0.35 20.80 0.19 0.04
V (%) 7.22 8.07 8.67 2.52 2.33 0.36
Min. 19,536.39 86.12 3.56 785.38 7.75 9.78
Max. 23,919.32 106.12 4.60 847.27 8.35 9.88
Foiled exterior all-beech plywood 12 mm thick
–x 18,456.72 75.81 5.11 695.83 8.48 12.18
S 1,546.69 6.60 0.80 9.49 0.14 0.06
V (%) 8.38 8.71 15.58 1.36 1.67 0.53
Min. 17,195.19 67.19 4.18 681.37 8.29 12.08
Max. 22,083.32 84.92 6.31 707.63 8.68 12.28
Foiled exterior all-beech plywood 15 mm thick
–x 21,968.82 86.74 5.68 753.25 11.53 15.30
S 611.09 4.00 0.37 12.32 0.15 0.12
V (%) 2.78 4.61 6.59 1.64 1.26 0.81
Min. 21,045.54 79.01 5.06 728.59 11.26 15.10
Max. 22,646.43 92.38 6.24 769.71 11.69 15.46
Foiled exterior all-beech plywood 18 mm thick
–x 21,015.43 78.07 5.96 742.48 13.55 18.25
S 785.73 8.34 0.97 9.34 0.06 0.24
V (%) 3.74 10.68 16.28 1.26 0.44 1.31
Min. 19,957.49 59.21 4.12 732.56 13.48 17.94
[image:10.595.66.532.71.545.2]Max. 22,531.44 87.61 7.27 755.90 13.63 18.60
Fig. 9. Dependence of relative deformation on the sheet thick-ness in combined plywoods
Fig. 10. Dependence of modulus of elasticity on the sheet density in combined plywoods
2 3 4 5 6 7 8 9
6 8 10 12 14 16 18 20
Board thickness (mm)
(m
m
)
y = 69.85x – 31,027 R2= 0.7758
5,000 10,000 15,000 20,000 25,000
600 620 640 660 680 700 720
(kg/m3)
E
(N
/m
m
2 )
y = –25.953x + 29,448
R2 = 0.0509
y = 69.85x – 31,027
R2 = 0.7758
——
along– –
across——
along
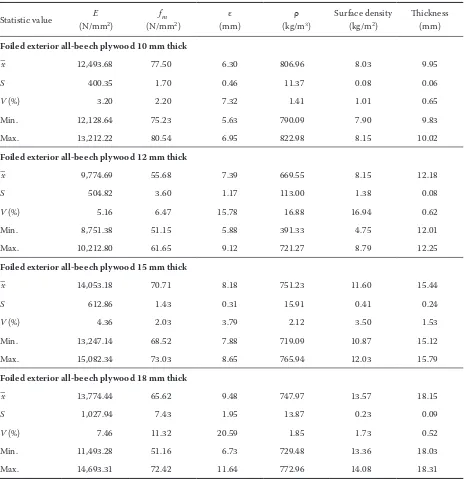
Table 10. Modulus of elasticity and bending strength of all-beech plywoods across the grain (n = 8)
Statistic value E
(N/mm2)
fm
(N/mm2)
ε (mm)
ρ
(kg/m3)
Surface density (kg/m2)
Thickness (mm)
Foiled exterior all-beech plywood 10 mm thick
–x 12,493.68 77.50 6.30 806.96 8.03 9.95
S 400.35 1.70 0.46 11.37 0.08 0.06
V (%) 3.20 2.20 7.32 1.41 1.01 0.65
Min. 12,128.64 75.23 5.63 790.09 7.90 9.83
Max. 13,212.22 80.54 6.95 822.98 8.15 10.02
Foiled exterior all-beech plywood 12 mm thick
–x 9,774.69 55.68 7.39 669.55 8.15 12.18
S 504.82 3.60 1.17 113.00 1.38 0.08
V (%) 5.16 6.47 15.78 16.88 16.94 0.62
Min. 8,751.38 51.15 5.88 391.33 4.75 12.01
Max. 10,212.80 61.65 9.12 721.27 8.79 12.25
Foiled exterior all-beech plywood 15 mm thick
–x 14,053.18 70.71 8.18 751.23 11.60 15.44
S 612.86 1.43 0.31 15.91 0.41 0.24
V (%) 4.36 2.03 3.79 2.12 3.50 1.53
Min. 13,247.14 68.52 7.88 719.09 10.87 15.12
Max. 15,082.34 73.03 8.65 765.94 12.03 15.79
Foiled exterior all-beech plywood 18 mm thick
–x 13,774.44 65.62 9.48 747.97 13.57 18.15
S 1,027.94 7.43 1.95 13.87 0.23 0.09
V (%) 7.46 11.32 20.59 1.85 1.73 0.52
Min. 11,493.28 51.16 6.73 729.48 13.36 18.03
[image:11.595.67.532.71.550.2]Max. 14,693.31 72.42 11.64 772.96 14.08 18.31
Fig. 11. Dependence of bending strength on the sheet density in combined plywoods
Fig. 12. Dependence of relative deformation on the sheet density in combined plywoods
y = –0.0353x + 74.103
R2 = 0.0109 y = 0.2963x – 126.29
R2 = 0.5819
40 50 60 70 80 90
600 620 640 660 680 700 720
(kg/m3) fm
(N
/m
m
2 )
y = 0.0005x + 4.3108 R2 = 0.0001
y = –0.0131x + 14.035 R2 = 0.0406
0 2 4 6 8 10
600 620 640 660 680 700 720 (kg/m3)
!
(m
m
)
——
along– –
across——
along– –
acrossy = 0.2963x –126.29
R2 = 0.5819
y = –0.0353x + 74.103
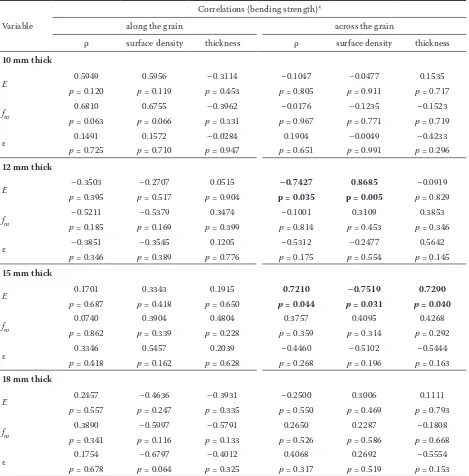
Table 11. Correlation analysis of all-beech plywoods along and across the grain
Variable
Correlations (bending strength)*
along the grain across the grain
ρ surface density thickness ρ surface density thickness
10 mm thick
E 0.5949 0.5956 –0.3114 –0.1047 –0.0477 0.1535
p = 0.120 p = 0.119 p = 0.453 p = 0.805 p = 0.911 p = 0.717
fm 0.6810 0.6755 –0.3962 –0.0176 –0.1235 –0.1523
p = 0.063 p = 0.066 p = 0.331 p = 0.967 p = 0.771 p = 0.719
ε 0.1491 0.1572 –0.0284 0.1904 –0.0049 –0.4233
p = 0.725 p = 0.710 p = 0.947 p = 0.651 p = 0.991 p = 0.296
12 mm thick
E –0.3503 –0.2707 0.0515 –0.7427 0.8685 –0.0919
p = 0.395 p = 0.517 p = 0.904 p = 0.035 p = 0.005 p = 0.829
fm
–0.5211 –0.5379 0.3474 –0.1001 0.3109 0.3853
p = 0.185 p = 0.169 p = 0.399 p = 0.814 p = 0.453 p = 0.346
ε –0.3851 –0.3545 0.1205 –0.5312 –0.2477 0.5642
p = 0.346 p = 0.389 p = 0.776 p = 0.175 p = 0.554 p = 0.145
15 mm thick
E 0.1701 0.3343 0.1915 0.7210 –0.7519 0.7290
p = 0.687 p = 0.418 p = 0.650 p = 0.044 p = 0.031 p = 0.040
fm 0.0740 0.3904 0.4804 0.3757 0.4095 0.4268
p = 0.862 p = 0.339 p = 0.228 p = 0.359 p = 0.314 p = 0.292
ε 0.3346 0.5457 0.2039 –0.4460 –0.5102 –0.5444
p = 0.418 p = 0.162 p = 0.628 p = 0.268 p = 0.196 p = 0.163
18 mm thick
E 0.2457 –0.4636 –0.3931 –0.2500 0.3006 0.1111
p = 0.557 p = 0.247 p = 0.335 p = 0.550 p = 0.469 p = 0.793
fm
0.3890 –0.5997 –0.5791 0.2650 0.2287 –0.1808
p = 0.341 p = 0.116 p = 0.133 p = 0.526 p = 0.586 p = 0.668
ε 0.1754 –0.6797 –0.4012 0.4068 0.2692 –0.5554
p = 0.678 p = 0.064 p = 0.325 p = 0.317 p = 0.519 p = 0.153
*Marked correlations are significant atp < 0.050; n = 16 (casewise deletion of missing data)
Fig. 13. Dependence of modulus of elasticity on the number of plies in combined plywoods
Fig. 14. Dependence of bending strength on the number of sheet plies in combined plywoods
y = –658.73x + 19,386 R2 = 0.1561
y = 2,003.2x – 1,592.1 R2 = 0.6863 5,000
10,000 15,000 20,000 25,000
4 5 6 7 8 9 10
Number of plies
E
(N
/m
m
2)
y = –4.93x + 102.49 R2 = 0.3644
y = 4.6286x + 18.565 R2 = 0.425
40 50 60 70 80 90
4 5 6 7 8 9 10
Number of plies
fm
(N
/m
m
2)
——
along– –
across——
along
– –
acrossy = 2,003.2x –1,592.1
Table 12. Aggregate table of bending strength and modulus of elasticity in bending for combined plywoods
Thickness (mm)
Number of plies
w
(%)
Surface density (kg/m2)
ρ
(kg/m3)
εII
(mm)
ε⊥ (mm)
fmII (N/mm2)
fm ⊥ (N/mm2)
EII (N/mm2)
E⊥ (N/mm2)
8 5 9.16 5.59 650.61 3.99 3.16 78.65 44.26 15,269.08 9,368.89
10 7 8.74 7.05 702.16 3.71 4.01 79.90 43.01 18,519.16 9,683.37
12 7 9.68 7.61 619.15 4.41 3.81 54.00 43.69 12,952.38 11,281.88
15 7 9.24 9.77 655.10 7.03 6.08 68.41 61.09 14,497.44 14,435.53
[image:13.595.62.533.240.480.2]18 9 9.22 11.97 651.55 7.96 6.10 58.93 62.78 12,634.15 17,381.69
Table 13. Correlation analysis – combined plywoods
Variable Correlations (summary)*
thickness No. of layer w surface density ρ
Εalong
0.9479 0.7245 0.1824 0.9502 –0.2015
p = 0.014 p = 0.166 p = 0.769 p = 0.013 p = 0.745
εacross
0.9325 0.7592 0.0200 0.9402 0.0106
p = 0.021 p = 0.137 p = 0.975 p = 0.017 p = 0.988
fm along
–0.6510 –0.6037 –0.8295 –0.5791 0.7628
p = 0.234 p = 0.281 p = 0.082 p = 0.306 p = 0.134
fm across
0.9019 0.6519 0.0805 0.9109 –0.1045
p = 0.036 p = 0.233 p = 0.898 p = 0.032 p = 0.867
Ealong –0.6172 –0.3950 –0.8486 –0.5535 0.8808
p = 0.267 p = 0.510 p = 0.069 p = 0.333 p = 0.048
Eacross 0.9833 0.8285 0.2222 0.9846 –0.2257
p = 0.003 p = 0.083 p = 0.719 p = 0.002 p = 0.715
*Marked correlations are significant atp < 0.05000; n = 5 (casewise deletion of missing data)
that relationships of bending strength or modulus of elasticity show a reversible character of development along and across the grain in the upper veneer.
The trend is also evident from Figs. 18 and 19 where an increase in bending strength or MOE
[image:13.595.64.294.598.724.2]in bending across the grain occurs while there is a decrease in the values along the grain. The fact is caused by the construction of plywoods where spruce veneers 3.5 mm thick are used as the second outer plies in plywoods 15 and 18 mm thick. These
[image:13.595.307.532.600.724.2]Fig. 15. Dependence of relative deformation on the number of sheet plies in combined plywoods
Fig. 16. Dependence of MOE on the sheet thickness in all-beech plywoods
5,000 10,000 15,000 20,000 25,000
8 10 12 14 16 18 20
Board thickness (mm)
E(N
/m
m
2 )
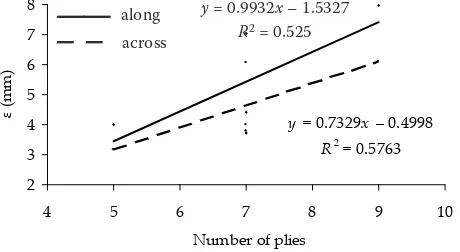
y = 0.7329x– 0.4998 R2= 0.5763
2 3 4 5 6 7 8
4 5 6 7 8 9 10
Number of plies
(m
m
)
y = 0.9932x – 1.5327
R2 = 0.525
——
along– –
across——
alongTable 14. Aggregate table of bending strength and MOE in bending for all-beech plywoods
Thickness
(mm) Number of plies (%)w Surface density(kg/m2) (kg/mρ 3) (mm)ε II (mm)ε⊥ (N/mmfmII 2)(N/mmfm ⊥ 2) (N/mmEII 2) (N/mmE⊥ 2)
10 7 9.78 8.07 815.91 4.04 6.30 95.23 77.50 21,856.08 12,493.68
12 9 10.04 8.32 682.69 5.11 7.39 75.81 55.68 18,456.72 9,774.69
15 11 10.41 11.56 752.24 5.68 8.18 86.74 70.71 21,968.82 14,053.18
18 13 10.18 13.56 745.23 5.96 9.48 78.07 65.62 21,015.43 13,774.44
plies take over the majority of strength in bending stress across the grain and vice versa only surface beech veneers 1.5 mm thick are most stressed along the grain.
Table 15 of correlation analysis calculated for all thicknesses and types of plywoods shows a strong dependence of bending strength and MOE on the sheet density.
y = –0.0088x + 14.419 R2 = 0.1279
3 4 5 6 7 8 9 10
650 700 750 800 850
ρ (kg/m3)
(m
m
)
y = 49.507x + 20,329 R2 = 0.0061
y = 406.04x + 8,463.6 R2 = 0.2877
5,000 10,000 15,000 20,000 25,000
6 7 8 9 10 11 12 13 14
Number of plies
E
(N
/m
m
2 )
Fig. 22. Dependence of MOE on the number of sheet plies in all-beech plywoods 50 60 70 80 90 100
8 10 12 14 16 18 20
Board thickness (mm)
fm (N /m m 2) along across 3 4 5 6 7 8 9 10
8 10 12 14 16 18 20
Board thickness (mm)
ε
(m
m
[image:14.595.305.533.61.182.2])
[image:14.595.64.288.230.352.2]Fig. 19. Dependence of MOE on the sheet density in all-beech plywoods
Fig. 17. Dependence of bending strength on the sheet thickness in all-beech plywoods
Fig. 18. Dependence of relative deformation on the sheet thick-ness in all-beech plywoods
y = 20.285x – 2,670 R2 = 0.3195
y= 25.736x + 1,547.6 R2 = 0.7352
5,000 10,000 15,000 20,000 25,000
650 700 750 800 850
ρ (kg/m3)
E
(N
/m
m
[image:14.595.302.531.235.357.2]2 )
[image:14.595.62.292.400.530.2]Fig. 21. Dependence of relative deformation on the sheet density in all-beech plywoods
Fig. 20. Dependence of bending strength on the sheet density in all-beech plywoods
——
along– –
across——
along– –
across——
along– –
across——
along– –
acrossy = 0.1652x – 56.36 R2 = 0.9584
y = 0.149x – 27.619 R2 = 0.8375
50 60 70 80 90 100
660 680 700 720 740 760 780 800 820 840
ρ (kg/m3)
fm
(N
/m
m
2)
——
along– –
across——
along– –
acrossy = –0.0082x + 11.309
R2 = 0.2737
y = 0.149x – 27.619
[image:14.595.308.533.402.528.2] [image:14.595.63.531.659.756.2]Fig. 23. Dependence of bending strength on the number of sheet plies in all-beech plywoods
[image:15.595.306.532.374.495.2]Fig. 24. Dependence of relative deformation on the number of sheet plies in all-beech plywoods
Fig. 25. Fracture along the height of the specimen in a com-bined plywood 18 mm thick
[image:15.595.306.531.546.599.2]Fig. 26. Fibrous fracture along the height of the specimen in a combined plywood 18 mm thick
Fig. 27. Fibrous fracture along the height of the specimen in a beech plywood 15 mm thick
Fig. 28. Rupture of fibres in the tensile zone of the specimen in a combined plywood 15 mm thick
y = –2.0274x + 104.24 R2 = 0.3486
50 60 70 80 90 100
6 7 8 9 10 11 12 13 14
Number of plies fm
(N
/m
m
2 )
[image:15.595.65.291.547.597.2]y = –1.0301x + 77.678 R2 = 0.0837 Table 15. Correlation analysis of an all-beech plywood
Variable Correlations (summary)*
thickness No. of plies w surf.ace ensity ρ
Εalong 0.9360 0.9631 0.8742 0.8671 –0.5232
p = 0.064 p = 0.037 p = 0.126 p = 0.133 p = 0.477
ε across
0.9927 0.9959 0.7142 0.9481 –0.3576
p = 0.007 p = 0.004 p = 0.286 p = 0.052 p = 0.642
fm along
–0.5323 –0.5904 –0.3890 –0.3489 0.9151
p = 0.468 p = 0.410 p = 0.611 p = 0.651 p = 0.085
fm across
–0.2154 –0.2894 –0.2261 –0.0115 0.9790
p = 0.785 p = 0.711 p = 0.774 p = 0.989 p = 0.021
Ealong
0.1466 0.0782 0.1408 0.3438 0.8575
p = 0.853 p = 0.922 p = 0.859 p = 0.656 p = 0.143
Eacross
0.5920 0.5364 0.4844 0.7417 0.5652
p = 0.408 p = 0.464 p = 0.516 p = 0.258. p = 0.435
*Marked correlations are significant atp < 0.050; n = 5 (casewise deletion of missing data)
y = 0.3169x + 2.0281 R2 = 0.9276
y = 0.5163x + 2.6734 R2 = 0.9918
3 4 5 6 7 8 9 10
6 7 8 9 10 11 12 13 14
Number of plies
ε
(m
m
)
——
along– –
across——
along– –
across [image:15.595.67.292.661.719.2] [image:15.595.308.537.667.719.2]Table 16. Correlation analysis for combined and all-beech plywoods
Variable Correlations (summary for all boards)*
εalong εacross fm along fm across Ealong Eacross
Thickness 0.8767 0.6996 –0.3457 0.4595 –0.0482 0.8506
p = 0.002 p = 0.036 p = 0.362 p = 0.213 p = 0.902 p = 0.004
Number of plies 0.4439 0.9078 0.1050 0.5127 0.4926 0.4684
p = 0.231 p = 0.001 p = 0.788 p = 0.158 p = 0.178 p = 0.203
w 0.0949 0.7693 0.2852 0.5803 0.5789 0.1638
p = 0.808 p = 0.015 p = 0.457 p = 0.101 p = 0.102 p = 0.674
Surface density 0.7562 0.8377 –0.0779 0.6207 0.2309 0.8070
p = 0.018 p = 0.005 p = 0.842 p = 0.074 p = 0.550 p = 0.009
ρ –0.2229 0.5525 0.8725 0.7517 0.9189 0.0795
p = 0.564 p = 0.123 p = 0.002 p = 0.019 p = 0.000 p = 0.839
*Marked correlations are significant atp < 0.050; n = 9 (casewise deletion of missing data)
[image:16.595.65.292.164.200.2]Fig. 32. Comparison of MOE in bending (A) and bending strength (B) between combined and all-beech plywoods
[image:16.595.67.534.278.473.2]Fig. 31. Failure in the central zone due to shear stress caused by the defect of a central veneer in a combined plywood 10 mm thick
Fig. 29. Rupture of fibres in the tensile zone of the specimen in a beech plywood 18 mm thick
Fig. 30. Failure in the central zone due to shear stress in a combined plywood 18 mm thick
If we compare bending strength and MOE in bending between all-beech and combined plywoods (Figs. 32 and 33) we can conclude that all-beech plywoods reach higher values than combined ply-woods. It is given by the fact that beech wood shows twice higher bending strength than spruce wood.
8 10
12 15
18 0
5,000 10,000 15,000 20,000 25,000
E
�
(N
/m
m
2 )
Thickness�(mm)
8 10
12 15
18 0
20 40 60 80 100
fm�
(N/mm
2 )
Thickness�(mm)
(A) (B)
[image:16.595.61.521.516.732.2]References
BALDWIN R.F., 1973. Plywood Manufacturing Practices. San Francisco, Miller Freeman Publications: 141.
MATOVIČ A., 1993. Fyzikální a mechanické vlastnosti dřeva a materiálů na bázi dřeva. Brno, MZLU: 212.
POŽGAJ A. et al., 1993. Štruktúra a vlastnosti dreva. Bratis-lava, Príroda: 486.
ŠTELLER Š., 1967. Príspevok k stanoveniu niektorých pev-nostných vlastností preglejok výpočtom. Bratislava, ŠDVÚ, Drevársky výskum, 1: 29–38.
ŠTELLER Š., 1978. Vplyv vlhkosti na pevnosť v ohybe a modul pružnosti v ohybe celobukových vodovzdorných preglejok. Bratislava,ŠDVÚ,Drevársky výskum, 4: 255–266. KOŽELOUH B., 1998. Dřevěné konstrukce podle Eurokódu
5. Zlín, KODR: 248.
ČSN EN 310 Desky ze dřeva. Stanovení modulu pružnosti v ohybu a pevnosti v ohybu. Český normalizační institut, 1995: 8.
ČSN EN 322 Desky ze dřeva. Zjišťování vlhkosti. Český normalizační institut, 1993: 8.
ČSN EN 323 Desky ze dřeva. Zjišťování hustoty. Český normalizační institut, 1994: 8.
ČSN EN 325 Stanovení rozměrů zkušebních těles. Český normalizační institut, 1995: 8.
ČSN EN 326-1 Dřevní materiály. Odběr vzorků, řezání a dozor. Český normalizační institut, 1997: 12.
Received for publication November 28, 2003 Accepted after corrections March 11, 2004
Posouzení pevnosti v ohybu a modulu pružnosti v ohybu vodovzdorných
fóliovaných překližek v závislosti na jejich konstrukci
J. HRÁZSKÝ, P. KRÁL
Lesnická a dřevařská fakulta, Mendelova zemědělská a lesnická univerzita v Brně, Brno, Česká republika
ABSTRAKT: Článek shrnuje výsledky institucionálního výzkumu zaměřeného na posouzení pevnosti v ohybu a modulu pružnosti v ohybu vodovzdorných fóliovaných kombinovaných a celobukových překližek v závislosti na jejich konstrukci. Byl zkoumán vztah konstrukce překližek a vybraných fyzikálních a mechanických vlastností. U zkoumaných desek byla ana-lyzována ve vzájemných souvislostech vlhkost, hustota, pevnost v ohybu a modul pružnosti v ohybu podél a napříč vláken vrchní dýhy. Veškerá měření byla provedena na vodovzdorných překližkách s povrchovou úpravou fenolformaldehydovou fólií kombinovaných o tloušťce 8, 10, 12 a 15 mm a celobukových o tloušťce 10, 12, 15 a 18 mm. Konstrukce překližek vý-znamným způsobem ovlivňuje kvalitu, která je určována zejména pevností v ohybu a modulem pružnosti v ohybu. Použitím regresní analýzy byly prokázány závislosti – zejména to, že s rostoucí vlhkostí překližek klesá pevnost v ohybu a se zvyšující se hustotou roste pevnost v ohybu a modul elasticity. Stejný trend se prokázal i v souvislosti se zvyšujícím se počtem dýh překližovaných desek. Korelační metodou byly statisticky testovány vzájemné kombinace závislostí uvedených vlastností.
Klíčová slova: překližka; hustota; plošná hmotnost; vlhkost; tloušťka; pevnost v ohybu; modul pružnosti v ohybu; dýha; statistická analýza
Překližované desky jsou definovány jako desky se vzá-jemně slepenými vrstvami, přičemž směr vláken soused-ních vrstev je na sebe kolmý. Ve všeobecnosti jsou vnější a vnitřní vrstvy na obou stranách vzhledem ke střední (případně středové vrstvě) symetricky uspořádány.
Výroba překližovaných desek patří k nejmladším od-větvím dřevozpracujícího průmyslu. Překližované des-ky se během času dostaly na jedno z vedoucích míst trhu s velkoplošnými materiály. Používají se v mnoha odvětvích lidské činnosti, například ve strojírenství, v textilním průmyslu, ve výrobě nábytku, v dopravě, v průmyslové a ve stavební výrobě apod.
Překližované materiály, které řadíme spolu s mate-riály aglomerovanými k materiálům velkoplošným, se vyrábějí lisováním souborů dýh nanesených syntetic-kým lepidlem za tepla a za spolupůsobení tlaku.
pou-žití – za přídavku speciálních typů syntetických lepidel nebo fóliováním speciálními fóliemi – se dají překližo-vané desky vyrábět jako vodovzdorné.
Největší uplatnění nacházejí překližované desky (ne-vodovzdorné) v nábytkářském průmyslu. Ve staveb-nictví se naopak používají překližované desky vodo-vzdorné. Stavebnictví používá překližované desky i pro konstrukci a výrobu podlah, obkladů, nosných stěn, lamelových konstrukcí apod. V dopravě mají překli-žované desky použití při výrobě železničních vagonů, autobusů, tramvají, nákladních vozů, lodí apod.
Překližované desky se rozdělují podle konstrukce na překližky (truhlářské, stavební, obalové, letecké, z vrst-veného dřeva), jádrové desky (laťovky, dýhovky), slože-né desky (voštinové, velitové desky) a dále podle tvaru na ploché a tvarové.
Jejich další rozdělení je možné podle hlavních kva-litativních znaků, tj. podle životnosti (pro použití ve venkovním a ve vnitřním suchém prostředí), mecha-nických vlastností, vzhledu povrchu, způsobu úpravy povrchu (nebroušené, broušené, povrchově upravené, oplášťované).
Kvalita překližovaných desek je posuzována podle mnoha kritérií a znaků. Obecně lze konstatovat, že pře-kližované desky se třídí podle platných norem. Musí spl-ňovat požadavky na rozměrovou přesnost (formáty i pří-řezy), kvalitu lepení, vnější kvalitativní znaky, fyzikální a mechanické vlastnosti, speciální požadavky zákazníků (snížené uvolňování formaldehydu, zvýšená požární odolnost, odolnost vůči plísním, houbám a hmyzu).
Pevnost v ohybu a modul pružnosti v ohybu překli-žovaných materiálů ovlivňuje celá řada faktorů – druh dřeviny, kvalita dřeviny, vlhkost dřeva, hustota dřeva, struktura dřeva, teplota, počet vrstev, použité lepidlo a trvalé zatížení.
Cílem práce bylo posouzení pevnosti v ohybu a mo-dulu pružnosti vodovzdorných fóliovaných překližek v závislosti na jejich konstrukci.
Zkoušky byly prováděny na fóliovaných vodovzdor-ných překližovavodovzdor-ných deskách s protiskluzovou úpra-vou, a to dvou typů konstrukce. V souladu s normami EN 326-1a EN 325 byly sestaveny nářezové plány.
Jednotlivé fyzikální a mechanické vlastnosti překli-žovaných desek byly zjišťovány podle následujících no-rem:
– ČSN EN 310 Stanovení modulu pružnosti v ohybu a pevnosti v ohybu
– ČSN EN 322 Desky ze dřeva – Zjišťování vlhkosti
– ČSN EN 323 Desky ze dřeva – Zjišťování hustoty – ČSN EN 325 Stanovení rozměrů zkušebních těles – ČSN-EN 326-1 Desky ze dřeva. Odběr vzorků,
naře-závání a kontrola. Část 1: Odběr vzorků, nařenaře-závání zkušebních těles a vyjádření výsledků zkoušek. Normalita souborů byla ověřena pomoci Shapiro--Wilkovova testu. Následně byla provedena jednofak-torová analýza rozptylu a pro posouzení vzájemných závislostí souborů korelační a regresní analýza.
Provedené ohybové zkoušky prokázaly, že překližky kombi i celobukové všech tlouštěk splňují minimální hodnoty pevnosti dané normou DIN 68 705, Teil 3.
Při ohybových zkouškách docházelo k porušení vět-šinou na povrchových vrstvách tahové zóny (obr. 28 až 29) anebo po celé tloušťce vzorku (obr. 25–27). U kombinovaných překližek o tloušťce 18 mm při ohy-bu v příčném směru došlo v 75 % k porušení ve střední vrstvě vzniklé překonáním smykové pevnosti střední dýhy (obr. 30). Na obr. 31 je patrné porušení ve středo-vé zóně vlivem vady střední dýhy.
Z výsledků korelační a regresní analýzy pro jednotli-vé tloušťky a směry působení síly se dependencemi na hustotě, plošné hmotnosti a tloušťce podařilo tyto zá-vislosti dokázat jen u velice mála měření.
Korelační analýza u souhrnných souborů pro jed-notlivé typy překližek nám prokázala více závislosti (tab. 13 a 14). V tab. 13 je zajímavé, že závislosti pev-nost, resp. modul pružnosti mají obrácený charakter vývoje v podélném a příčném směru vláken horní dýhy. Teto trend je patrný i z obr. 18 a 19, kde dochází k ná-růstu pevnosti v ohybu, resp. modulu pružnosti v ohy-bu v příčném směru a k poklesu hodnot v podélném směru. Tato skutečnost je způsobena konstrukcí pře-kližek, kde jsou u tlouštěk 15 mm a 18 mm použity jako druhé vnější vrstvy smrkové dýhy o tloušťce 3,5 mm. Ty přebírají většinu pevnosti při namáhání na ohyb v příč-ném směru překližky a naopak v podélpříč-ném směru jsou nejvíce namáhány jen povrchové bukové dýhy o tloušť-ce 1,5 mm.
Z tab. 15 korelační analýzy vypočtené za všechny tloušťky a typy desek je patrná silná závislost pevnosti a modulu pružnosti na hustotě desky.
Porovnáním pevnosti v ohybu a modulů pružnosti ohybu mezi celobukovými a kombinovanými překliž-kami (obr. 32) dojdeme k očekávanému závěru, že celo-bukové překližky dosahují vyšších hodnot než překliž-ky kombi, protože dřevo buku má dvakrát větší pevnost v ohybu než dřevo smrkové.
Corresponding author:
Dr. Ing. JAROSLAV HRÁZSKÝ, Mendelova zemědělská a lesnická univerzita v Brně, Lesnická a dřevařská fakulta, Lesnická 37, 613 00 Brno, Česká republika