Analysis of force effects measured in the tractor
three-point linkage
J. Čupera, F. Bauer, L. Severa, M. Tatíček
Faculty of Agronomy, Mendel University in Brno, Brno, Czech Republic
Abstract
Čupera J., Bauer F., Severa L., Tatíček M., 2011. Analysis of force effects measured in the tractor three-point linkage. Res. Agr. Eng., 57: 79–87.
The work is focused on description of tractor individual axels and wheels loading during ploughing. A combination of tractor inclination with force and momentum effects need not always result in marked differences in the load of driving wheels. This paper documents the relationship existing between forces working in the upper drawbar Fh of the three-point linkage and the momentum MTx. It was also demonstrated that with the increasing value of MTx the difference between loads of both rear wheels reduces. The described algorithm enables to evaluate output parameters of ploughing aggregates for different variants of forces changing in the tractor three-point linkage due to various ways of suspension and adjustment of individual plough types. When using data recorded in the course of ploughing operations it is possible to demonstrate the effect of plough adjustment/attachment on the efficiency of the whole ploughing aggregate.
Keywords: three-point linkage; wheel load; load cell
Supported by the Ministry of Education, Youth and Sports of the Czech Republic, Project No. MSM 6215648905 and Internal Grant Agency TP1/2011.
The development of tractors and tools directed to system with either attached or trailed machines resulted in certain discrepancies between the man-ner of operation of tractors and the methods of measuring their tractive properties. Attached and/ or trailed sets of machines are characterised by the fact that the tools are connected with the tractor by means of a three-point linkage so that their result-ing force effect on tractor is usually markedly dif-ferent from effects of simple tractive forces, which typically exist in each tractive test of tractors.
Measurements of forces existing in the three-point linkage of a tractor and the projection of measured force effects into its centre of gravity were described by Bauer et al. (1989). Results of the first experiment with the determination of effects of the ploughing operation on soil compaction were pre-sented in a paper published by Mišun and Bauer
(1992). Problems associated with force effects of ploughs on tractors ploughs kinematics were stud-ied by many authors (Kazzaz, Grečenko 1968; Upadhyaya, Kemble 1985; Sloboda et al. 1997; Mouazen et al. 2009). Also other factors affect-ing drawbar characteristics such as tire inflation and others were deeply studied (Novák et al. 2009; Šmerda, Čupera 2010).
ploughing aggregates, with right wheels moving in the furrow. As far as these ploughing aggregates are concerned, many authors refer to the compaction of subsoil due to the movement of tractor wheels in the furrow (Upadhyaya, Kemble 1985; Renius 1987). The analysis of forces influencing the three-point linkage of a ploughing tractor was performed due to the fact that, as compared with tractor trac-tive tests, the load of a ploughing tractor shows characteristic differences. When ploughing, the tractor wheels move on one side in the furrow so that it is inclined. In combination with power ef-fects of the plough this inclination causes a different load of individual wheels and changes in the load of both axles. This results in significant changes not only in the grip of driving wheels but also in an in-creased compaction of soil. Performed analysis can be used for further studies on dynamic properties of tractor units or other vehicles as described e.g. in Chalupa et al. (2006, 2009).
MATeriAL And MeThodS
Field measurements were performed on the farm Agroservis Višňové (Znojmo district, Czech Re-public), on a field with sandy-loamy soil (the av-erage moisture content Whwas 17 vol. % and the measured specific resistance of plough was 69 kPa). All measurements were performed under identical conditions. The total area of the experimental field
was 60 ha and the measurements were performed on a plot 50 m long. Prior to the measurements the plough and its linkage were adjusted in such a way that it was possible to observe effects of different lengths of the upper bar on selected parameters of the ploughing aggregate. During all measurements it was strictly controlled that the plough was cor-rectly adjusted and that the ploughing result met all agrotechnical requirements.
This paper presents results of those measurements, which demonstrate problems associated with the load of driving wheels of a tractor when ploughing either on its right or the left side with an attached reversible plough. As during nearly all tests not only the forces in drawbars of the three-point linkage but also the trac-tive force existing in the traction rope (the ploughing tractor was pulled by another tractor by means of a rope), the measured force Fts could be used as an in-put value not only for the estimation of the momen-tary average coefficient of the rolling resistance fvbut also of the momentary average coefficient of adhe-sion µ. However, this could be performed only on the assumption that also another input value – resistive force Fw (required for the surpassing of the resistance in gearings of the pulled tractor) would be exactly measured. Measurements of gear resistance were performed on a roller dynamometer in laboratories of Mendel University in Brno, Brno, Czech Republic.
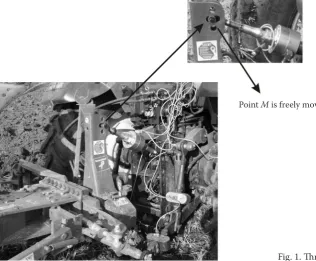
[image:2.595.67.384.497.758.2]Measurements of forces influencing the plough-ing tractor were performed by means of five tenso-metric sensors fitted to drawbars of the three-point
Fig. 1. Three-point linkage fitted with load cells
linkage and also to the pulling rope (Fig. 1). When analysing the measured values, we have calculated average sectional values of axial forces occurring in drawbars and the average sectional value of the force Fts existing in the rope; these forces occurred as a response to the ploughing, i.e. as a set of values
{Fld, Flz, Fpd, Fpz, Fh, Fts} (1)
where:
Fld, Fpd – average sectional values of axial forces working in the lower drawbars (kN)
Flz, Fpz – average sectional values of axial forces working in the lifting drawbars (kN)
Fh – average sectional values occurring in the upper drawbar (kN)
Fts – average value of the traction force existing in the rope (kN)
The average sectional forces were transformed into the gravity point of the tractor within each time interval i = 1... n using the relationship
Af = [FTx, FTy, FTz, MTx, MTy, MTz]T (2)
where:
is the matrix of transformation of binding effects from points AL, AP, DL, DP, and H (Fig. 2) into the tractor’s centre of gravity; x, y, z are coordinates of corresponding points AL, AP, DL, DP and H and
f = [fAL, fAP, fDL, fDP, fH]T (kN) (4)
is the vector of force effects in the aforementioned binding points. It is also obvious that
fAL = [FALx, FALy, FALz]T (kN) (5)
fAP = [FAPx, FAPy, FAPz]T (kN) (6)
fDL = [FDLx, FDLy, FDLz]T (kN) (7)
fDP = [FDPx, FDPy, FDPz]T (kN) (8)
fH = [FHx, FHy, FHz]T (kN) (9)
If the product of Eq. (2) is, among others, also the force FTx, it is obvious that the difference
[image:3.595.64.333.84.293.2]Fvm = Fts – FTx = Fv + Fw (kN) (10)
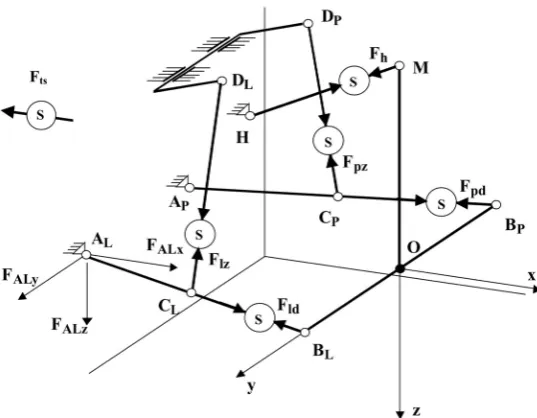
Fig. 2. Schematic presentation of three-point linkage with load cells
S – load cell; AP, AL – Linkage of lower draw bars to the tractor; P – right; L – left; BP, BL – linkage of lower draw bars to the plough; DP,
DL – linkage of lift-up draw bars to the tractor;
H – linkage of the upper draw bar to the tractor;
M – linkage of the upper draw to the plough;
Fpz – force in the right lift-up draw bar; Flz – force in the left lift-up draw bar; Fpd – force in the right lower draw bar; Fld – force in the left lower draw bar; Fh – force in the upper draw bar; Fts – pulling force; FALx – force in the point A situated left from the x axis; FALy – force in the point A situated left from the y axis; FALz – force in the point A situated left from the z axis
» » » » » » » » ¼ º « « « « « « « « ¬ ª 0 x y 0 x y 0 x y 0 y 0 x y x 0 z x 0 z x 0 z 0 x 0 z y z 0 y z 0 y z 0 y 0 y z 0 1 0 0 1 0 0 1 0 0 1 0 0 1 0 0 0 1 0 0 1 0 0 1 0 0 1 0 0 1 0 0 0 1 0 0 1 0 0 1 0 0 1 0 0 1 H H Dp Dp A A A A H H Dp Dp A A A A H H Dp Dp A A A A L D L D P P L L L D L D P P L L L D L D P P L L x x z z
is equal to the sum of the Fv force of rolling ance of wheels of the pulled tractor with the resist-ance force Fw of freely rotating tractor’s parts. It results from Eq. (10) that the resistance is the force of rolling resistance
Fv = Fts – FTx – Fw (kN) (11)
If α is the tilt angle of the tractor driving with left wheels in a furrow then the total vertical force affecting the tractor in its centre of gravity is ex-pressed by the equation
FTzc = FTz + Gcos α (kN) (12)
and the average momentary sectional value of the coefficient of rolling resistance
(–) (13)
where:
α – oriented angle of the tractor’s inclination
If F–ts, F–Tx and F–Tz represent arithmetic midpoints of corresponding sectional values of a concrete
measurement, then the arithmetic midpoint F–w of Fw values can be expressed by the equation
F–w = F–ts – F–Tx – f–v(F–Tz + Gcosα) (kN) (14)
The statistical analysis of measurements of ploughing operations at the measured concrete value f–= 0.08 produced F–w values ranging from 1.8–2.4 kN (Eq. 14).
When modelling the tractor’s drive, the front wheels were replaced by a single wheel with a dou-bled reaction 2 × FCz (Fig. 3) and with the total side effect FCy, which influences both front wheels. Due to the tractor’s inclination such a single wheel fol-lows an imaginary pathway but has the same prop-erties ( fv, µ) as rear wheels.
The transformation of binding reactions and re-actions of soil to the tractor’s movement (as pro-jected into its centre of gravity) and the equation of the balance of actions and reactions in this centre of gravity is expressed by the equation
BfR + [FTx, FTy + Gcos α, FTz + Gcos α, MTx, MTy, MTz]T
= 0T
6 (15)
[image:4.595.69.296.74.303.2]where:
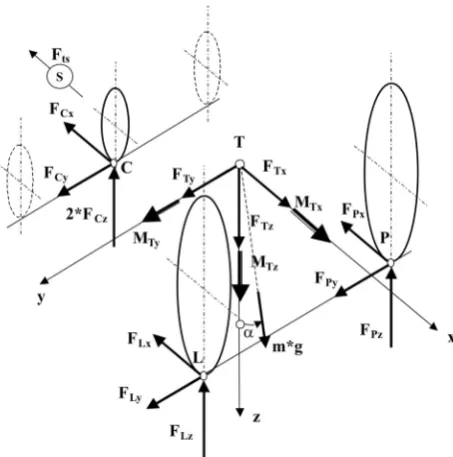
Fig. 3. Schematic presentation of forces impacting to the tractor
P – point of force impact to the right wheel; L – point of force impact to the left wheel; C – point of force impact to the front axle; T – tractor’s point of gravity; FPx, FPy,
FPz – forces impacting the right wheel in axes x, y, z; FLx,
FLy, FLz – forces impacting the left wheel in axes x, y,z; FCx,
FCy, FCz – forces impacting the front axle in axes x, y,z; FTx,
FTy, FTz – forces in the point of tractor’s gravity in axes x, y,z; MTx, MTy, MTz – momentums in the point of tractor’s gravity around axes x, y, z; Fts – pulling force; α – inclination of tractor; x, y, z – coordinates
is the matrix of transformation of binding reactions of the plough into the tractor’s centre of gravity, where x, y, and z are coordinates of points L, P, and C of the tractor; r and R represent radius of wheels and
fR = [fC, fL, Fp] (kN) (17)
is the vector of the binding reactions of soil to the tractor’s movement.
As the modelling of this problem was based on an assumption that both the front double wheel and the rear wheels are driving wheels with differential locks, then
fC = [–2FCz(μ – fv), FCy, –2FCz]T (kN) (18)
fL = [–FL(μ – fv), FS, –FL]T (kN) (19)
fP = [–FP(μ – fv), 0, –FP]T (kN) (20)
provided that the denomination
FL = FLz, FP = FPz, FS = FLy + FPy
is used in accordance with Fig. 3.
Eq. (15) results in obtainment of six equations for a set of six unknowns
Sn = {μ, FCy, FCz, FL, FP, FS} (21)
reSuLTS
The algorithm described above indicates that it is possible to calculate forces and moments working in the tractor’s centre of gravity as well as forces influencing its rear wheels and the forces occurring in the point C (Fig. 3). As the objective of this paper is to explain reactions of soil to the movement of rear wheels of the ploughing tractor (which partici-pate in a decisive manner in an efficient transfer of the driving moment from wheels on the soil sur-face) the tables contain only those values that are directly related to these problems.
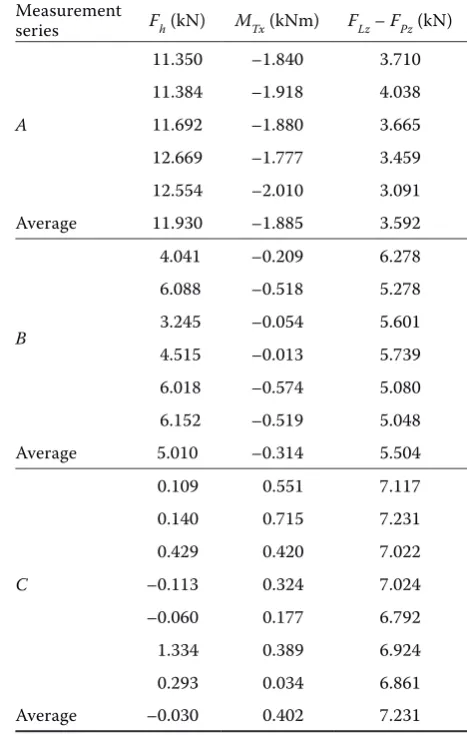
A series of measurements presented in Table 1 re-fer to those ploughing operations, which were per-formed on the left side of the pathway of a plough-ing tractor. The upper drawbar of the tractor’s three-point linkage was adjusted to three different lengths. For Groups A, B and C of measurements, the lengths of the upper drawbar were adjusted to
[image:5.595.297.531.329.697.2]640 mm, 665 mm, and 695 mm, respectively. The measured values indicate that in Group A (with the shortest drawbar) a marked tractive force was recorded in all measurements and that its average value was 11.93 kN. In Group B the length of up-per drawbar was 665 mm and it was found out that due to the elongation by 25 mm the tractive force decreased to 5.01 kN. In Group C the length of the upper drawbar was 695 mm and the point M moved freely within the oblong opening of the plough (see a detail in Fig. 1). Theoretically, there should not be any force measured in the upper drawbar. However, the bumpiness of the field surface caused that the average values of measured forces were not zero but fluctuating about zero values.
Table 1. Average force values measured for different lengths of upper drawbar
Measurement
series Fh (kN) MTx (kNm) FLz – FPz (kN)
A
11.350 –1.840 3.710 11.384 –1.918 4.038 11.692 –1.880 3.665 12.669 –1.777 3.459 12.554 –2.010 3.091 Average 11.930 –1.885 3.592
B
4.041 –0.209 6.278 6.088 –0.518 5.278 3.245 –0.054 5.601 4.515 –0.013 5.739 6.018 –0.574 5.080 6.152 –0.519 5.048 Average 5.010 –0.314 5.504
C
0.109 0.551 7.117 0.140 0.715 7.231 0.429 0.420 7.022 –0.113 0.324 7.024 –0.060 0.177 6.792 1.334 0.389 6.924 0.293 0.034 6.861 Average –0.030 0.402 7.231
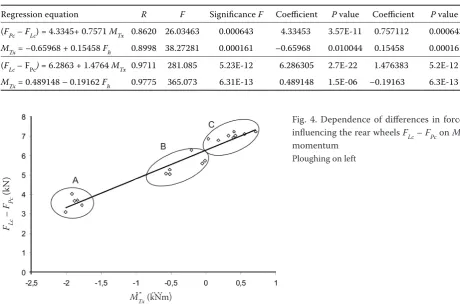
Table 2. Test of regression functions
[image:6.595.62.535.104.188.2]Regression equation R F Significance F Coefficient P value Coefficient P value (FPc – FLc) = 4.3345+ 0.7571 MTx 0.8620 26.03463 0.000643 4.33453 3.57E-11 0.757112 0.000643 MTx = –0.65968 + 0.15458 Fh 0.8998 38.27281 0.000161 –0.65968 0.010044 0.15458 0.000161 (FLc – FPc) = 6.2863 + 1.4764 MTx 0.9711 281.085 5.23E-12 6.286305 2.7E-22 1.476383 5.2E-12 MTx = 0.489148 – 0.19162 Fh 0.9775 365.073 6.31E-13 0.489148 1.5E-06 –0.19163 6.3E-13
Fig. 5. Dependence of MTx momentum on force Fh in the upper drawbar
Ploughing on left Results of these measurements were analysed
sta-tistically by means of the regression analysis. The measured values were plotted along a straight line using the results of linear regression. The statistical significance of the regression function was tested by F-test. Test results presented in Table 2 indicate that the tested regression was statistically signifi-cant (this was also documented by the calculated significance levels). The significance of the regres-sion function coefficients was tested by t-test and
the obtained results are presented in Table 2. These results indicate that the calculated coefficients were statistically highly significant.
Dependencies presented in Figs 4 and 5 were calculated by means of regression analysis. The de-pendence of the linear course of the moment MTx on the force working in the upper drawbar of the three-point linkage of a tractor is presented in Fig. 4. Increasing negative values of the moment MTx (as related to the orientation of the x-axis indicate
MTx(kNm)
F Lc
–
F Pc
(kN
)
Fig. 4. Dependence of differences in forces influencing the rear wheels FLc – FPc on MTx
momentum
Ploughing on left
Fh(kN) MTx
[image:6.595.63.539.571.767.2]that with the increasing force working in the upper drawbar the wheel moving in the furrow is de facto deloaded (Fig. 2).
If the difference in forces influencing the left and the right rear driving wheels (FLc – FPc) is denoted as a value dependent on the moment MTx(Fig. 5), then it is possible to say that the length of the upper drawbar influences the load of wheels in the furrow and on the field. As far as the pulling characteristics of a tractor are concerned it is possible to conclude that the length of the upper drawbar of the three-point linkage influences the load of wheels moving in the furrow and on the field surface. With regard to the pulling characteristics of tractors this obser-vation is significant.
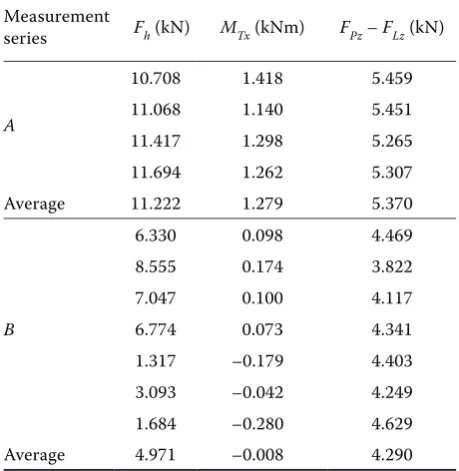
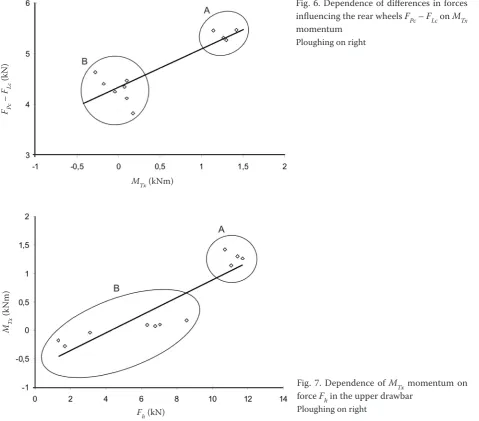
The series of measurements presented in Table 3 refer to ploughing performed on the right side of the moving tractor. The upper drawbar of the three-point linkage was adjusted to two different lengths. For the measurements marked in Table 3 as Groups A and B the upper drawbar was adjusted to the same lengths as in experiments with left-side ploughing, i.e. to 640 mm and 665 mm for groups A and B, respectively. The measured data indicate that in Group A with the shortest upper drawbar marked tractive forces were registered in all cases and that their average value was 11.22 kN. Group B involves measurements performed on drawbars
ad-justed to 665 mm (i.e. +25 mm) and its length was the same as in experiments with ploughing on the left side of the moving tractor. The obtained results indicate that the ploughing operation on tractor’s right side was subjected to the same rules as in a series of measurements performed on the left side of ploughing tractor.
This analysis indicates that the moment MTx in-creased with the increasing force working in the upper drawbar; this means that the load of wheels moving in the furrow is reduced. This is quite logi-cal because the increasing tracking force in the up-per drawbar always causes a deloading of plough’s supporting wheel. The centre of gravity of a four-furrow mounted plough used in these experiments was situated on the left side of the tractor’s longi-tudinal axis. In case that the supporting wheel is deloaded, the mass of the tractor influences more the opposite driving wheels, which moves on the field surface (i.e. the left one when ploughing on the right side of the tractor and vice versa).
diScuSSion
Renius (1987) mentioned that (under conditions of 20% slippage) the ploughing aggregate consisting of a tractor and a four-furrow reversible mounted plough showed 45% and 25% of load on the wheel moving in the furrow and on the field surface, re-spectively.
Results presented in this paper were obtained also in experiments with attached four-furrow re-versible plough. The average slippage was 15%. Results of regression analysis of measured and cal-culated data are presented in Figs 4–7. The linear dependence of the course of MTx moment on the force working in the upper drawbar Fh of the three-point linkage is illustrated in Figs 4 and 6. It can be concluded that the greater the force working in the upper bar, the lower the load of the rear sup-porting wheel and the higher the moment MTx. This means that when ploughing on the left side of the tractor the negative moment MTx increased with the increasing value of the force Fh. As shown in Fig. 2, the x-axis is oriented against the direction of tractor’s movement and for that reason the nega-tive moments operating along the x axis deload the wheel moving in the furrow.
[image:7.595.62.292.120.356.2]This is quite logical because when ploughing with the deloaded supporting wheel of the plough the moment MTx must be absorbed in lifting drawbars
Table 3. Average force values measured for different lengths of upper drawbar
Measurement
series Fh (kN) MTx (kNm) FPz – FLz (kN)
A
10.708 1.418 5.459 11.068 1.140 5.451 11.417 1.298 5.265 11.694 1.262 5.307 Average 11.222 1.279 5.370
B
6.330 0.098 4.469 8.555 0.174 3.822 7.047 0.100 4.117 6.774 0.073 4.341 1.317 –0.179 4.403 3.093 –0.042 4.249 1.684 –0.280 4.629 Average 4.971 –0.008 4.290
of the three-point linkage. The moment MTx then influences the rear wheels and reduces the response of soil to the wheel moving in the furrow. This is documented in Figs 4 and 6, which illustrate the dependence of differences in this reaction of soil to moving wheels on the negative moment MTx.
It results from Tables 2 and 3 as well as from Figs 5 and 7 that with the increasing forces working in the upper drawbar Fh the difference between the load of wheel driving in the furrow and that mov-ing on the field surface decreases. This fact shows a positive effect on tractive characteristics of the rear axle. On the other side, however, it is also possible that with the increasing force occurring in the up-per drawbar the front axle of the tractor might be undesirably deloaded. To prevent this, it is always necessary to add a sufficient weight to the front axle of a tractor with an attached reversible plough.
references
Bauer F., Mišun V., Loprais A., 1989. Transformace měřených silových účinků v táhlech tříbodového závěsu do těžiště traktoru agregovaného s neseným pluhem (Transformation of measured power effects in drawbars of three-point linkage to tractor aggregated with mounted plough). Zemědělská technika, 35: 205–214.
Chalupa M., Kratochvíl C., Kotek V., Heriban P., 2006. Kombinovaná metoda analýzy dynamických vlastností hnací soustavy (Combined method of analysis of driving systems dynamic properties). In: Proceedings of Special Technology 2006. Bratislava, STUB: 165–196.
Chalupa M., Veverka J., Vlach R., 2009. Influence of design parameters on vehicle track dynamic loading. In: Proceedings of the 2nd International Multi-Conference on Engineering and Technological Innovation. Orlando, IIIS: 365–369.
MTx(kNm) FPc
–
FLc
(kN
)
Fh(kN) M Tx
[image:8.595.63.543.86.507.2](kNm)
Fig. 6. Dependence of differences in forces influencing the rear wheels FPc – FLc on MTx
momentum
Ploughing on right
Fig. 7. Dependence of MTx momentum on force Fh in the upper drawbar
Kazzaz A., Grečenko A., 1968. Rozdíly mezi výkonností kolového traktoru s pluhy a mezi údaji tahové zkoušky (Difference between the power of wheel tractor with ploughs and the haul test data). Zemědělská technika, 14: 131–152.
Mišun V., Bauer F., 1992. Zatížení hnacích kol traktoru při orbě s nesenám pluhem (Load of powered wheels at plough-ing with mounted plough). Zemědělská technika, 38: 1–9. Mouazen A.M., Maleki M.R., Cockx L., Van Meirvenne
M., Van Holm L.H.J., Mercksx R., De Baerdemaker J., Ramon H., 2009. Optimum three-point linkage set up for improving the quality of soil spectra and the accuracy of soil phosphorus measured using an on-line visible and near infrared sensor. Soil & Tillage Research, 103: 144–152. Novák, P., Šmerda, T., Čupera, J., 2009. Impact of
semi-trailer tyre pressure upon passive resistance and tractor
unit operation economy. Research in Agricultural Engi-neering, 55: 129–135.
Renius T., 1987. Traktoren Technik und ihre Anwendung. München, BLV Verlagsgeselschaft: 191.
Sloboda A., Salanci J., Bugár T., 1997. Measuring and evaluating of axial forces magnitudes in the lower drawbars at the ploughing. Transactions of the Technical University of Košice, 3: 1–12.
Šmerda T., Čupera J., 2010. Tire inflation and its influence on drawbar characteristics and performance-energetic indicators of a tractor set. Journal of Terramechanics, 47: 395–400.
Upadhyaya S.K., Kemble L.J., 1985. Accuracy of mounted implement draft prediction using strain gages mounted directly on three-point linkage system. Transactions of the ASABE, 28: 40–60.
Received for publication June 11, 2010 Accepted after corrections January 19, 2011
Corresponding author:
Doc. Ing. Libor Severa, Ph.D., Mendel University in Brno, Faculty of Agronomy, Zemědělská 1, 603 00 Brno, Czech Republic