Allometric growth of calcium, phosphorus, magnesium,
sodium, and potassium in slow- and fast-growing young
chickens
J. Zelenka
Department of Animal Nutrition and Forage Production, Faculty of Agronomy, Mendel University in Brno, Brno, Czech Republic
ABSTRACT: Allometric growth of body macrominerals was examined in slow-growing laying-type cock-erels (SG) and in fast-growing male broiler hybrids (FG) during the growing period from hatch to day 22. Allometric coefficients for dry matter, calcium, phosphorus, magnesium, sodium, and potassium in relation to body weight were 1.091, 1.427, 1.383, 1.284, 0.843, and 1.097 for SG chickens and 1.075, 1.276, 1.233, 1.216, 0.943, and 1.144 for FG chickens, respectively. Allometric coefficients describing the relationships of Ca, P, Mg, Na, and K with dry matter weight were 1.302, 1.260, 1.172, 0.772, and 0.998 for SG chickens and 1.185, 1.143, 1.127, 0.878, and 1.059 for FG chickens, respectively. High allometric coefficients for Ca, P, and Mg in both genotypes likely indicate a rapid growth of skeletal tissues which requires an adequate mineral nutrition during this period of growth. The deposition of Ca and P relative to dry matter was higher (P < 0.05) and that of Na lower (P < 0.01) in SG chickens thus suggesting that the relative growth of these minerals may be affected by genotype.
Keywords: age; growth rate; chemical allometry; Ca, Mg, P, Na, and K retention
Requirement for concentration of an available mineral in the diet for growing poultry depends on the inevitable mineral losses, growth rate, mineral concentration in gained body weight, and feed conversion ratio. Mineral concentration in body weight is quantitatively the most important (Rodehutscord, 2006), but it can be studied with reasonable effort by a whole body analysis.
McDowell (1992) found that light breeds had higher requirement for P than the broiler chickens. In our previous experiment (Zelenka, 1988) from the 12th day of age to the end of fattening, chickens
showing a lower growth rate accumulated signifi-cantly more P per unit of body gain than those with a higher growth rate. In an experiment where daily changes of macromineral retention were studied (Zelenka and Fajmonová, 2001) the differences in Ca, Mg, and P retention per unit of weight gain in
laying type hybrids and in broiler chicks were not significant (P > 0.05) in the first three weeks of age.
It is generally accepted that from the prediction of body weight growth the growth of body con-stituents can be calculated by allometric equations (Emmans, 1981).
The aim of the present experiment was to study relative growth rates of body macrominerals in broilers and laying type chickens during the first 22 days of postembryonal life.
MATERIAL AND METHODS
Animals and procedures
The animal procedures were reviewed and ap-proved by the Animal Care Committee of the Mendel University in Brno. Chickens of two con-trasting genotypes were used: slow-growing male chicks of hybrid combination Isa Brown (SG; 95 birds) and fast-growing Ross 308 cockerels (FG; 52 birds). The diet contained (g/kg diet) calcium 9.53, phosphorus 7.43, magnesium 1.74, sodium 1.48, and potassium 7.75. For details about the en-vironment including the composition of the diet see our paper about the retention of protein, amino acids, fat, and minerals (Zelenka et al., 2011). The chickens used in the present study originated from the same experiment. During the whole experi-ment, all chickens were fed ad libitum.
Body weight of the chickens was recorded in two-day intervals from hatch until the age of 22 two-days and samples of chickens were selected from each group so that their body weight was approximately the same as the mean body weight of the group. The selected chickens were euthanized and the content of the digestive tract was removed. The chickens were then autoclaved for 6 h at 130°C and 270 kPa pressure, freeze-dried, finely ground, and stored for subsequent analyses.
Chemical analyses
The diet and the whole chickens’ bodies were analyzed for moisture, calcium, magnesium, phos-phorus, sodium, and potassium. Macrominerals were estimated after wet mineralization by sul-phuric acid and hydrogen peroxide, Ca and Mg by flame atomic absorption spectrometry using AAS1 Atomic Absorption Spectrometer (Carl Zeiss, Jena, Germany) at wavelengths of 422.7 nm (Ca) and 285.2 nm (Mg) and P spectrophotometrically as vanadate yellow using Unicam 8625 UV/VIS Spectrophotometer (LabX, Midland, Canada) at wavelength of 442 nm. Sodium and potassium were determined by flame emission spectrometry using
AAS30 Spectrometer (Carl Zeiss, Jena, Germany) at wavelengths of 589.2 nm (Na) and 766.5 nm (K).
Calculations and statistical analyses
For the expression of the accelerating growth phase of the chickens or their body components the expo-nential function suggested by Brody (1945) was used:
Y = Aekt where:
Y = body or analyte weight in g at time t A = extrapolation of the weight for t = 0
e = base of natural logarithms
k = rate of growth
t = time from hatching (in days)
Weights of macrominerals were calculated by multiplying their concentrations in the whole body by live weights of the chickens. Allometric relation-ships were calculated using the power function of Brody (1945):
Y = aXb where:
Y = content of the body component in g
X = live body weight or dry matter weight of chicken in g
a = extrapolation of Y for X = 1
b = allometric coefficient, ratio of percentage change in Y
to the corresponding percentage change in X
The significance of differences between the data for the two genotypes was evaluated by a paired
t-test. The statistical analyses were performed us-ing Statgraphic Plus package (Statistical Graphic Corp., Version 3.1, 1994).
RESULTS AND DISCUSSION
Both types of chicken hybrids were raised under identical environmental and dietary conditions. At the end of the experiment, body weights of FG chickens were about three times higher than those of SG chickens, 782 and 258 g, respectively.
Romanoff (1967). The concentrations of Na and K were similar.
Parameters of exponential growth function (Brody, 1945) of chicken body weight and dry mat-ter, calcium, magnesium, phosphorus, sodium, and potassium growth are shown in Table 2.
Parameter estimates for the allometric relation-ships of dry matter and macrominerals weight with live body weight are summarized in Table 3. As indicated by the allometric coefficients, the pro-portion of dry matter weight in the chicken bodies increased with the increasing age of birds. Similar
results were reported by Kwakkel et al. (1997) and Gous et al. (1999). The deposition of Ca, P, Mg, and K was higher and that of Na lower than the rate of body weight growth. Except for K, these differences were more pronounced in SG than in FG chickens, for P highly significantly (P < 0.01) and for Ca, Mg, and Na significantly (P < 0.05). All allometric coefficients were significantly different from the unity (P < 0.05).
The bones of slow-growing chickens are obvious-ly more robust than those of fast-growing broilers (Stojcic and Bessei, 2009). Eits et al. (2002) pre-sumed that, due to a lower proportion of bones, the relative growth of ash in broilers is slower than that in laying-type chickens. The results of the present experiment support this hypothesis as the allomet-ric coefficient for skeleton-forming elements (Ca, P, and Mg) in FG chickens was significantly lower than in SG chickens.
With the exception of K in SG chickens, allometric coefficients describing the relationships of mineral weights to dry matter weight (Table 3) were signifi-cantly (P < 0.05) different from the unity. The depo-sition of Ca, P, and Mg in SG chickens was faster than that of dry matter by 30.20, 25.97, and 17.24%, and in FG cockerels by 18.45, 14.27, and 12.71%, respectively. In the case of Ca and P, the differences between genotypes were significant (P < 0.05).
[image:3.595.62.291.113.294.2]The remarkably high allometric coefficients for Ca, P, and Mg relative to body weight in both geno-types likely indicate the rapid growth of skeletal tis-sues, since the concentration of minerals in bones is higher than that in non-skeletal body components.
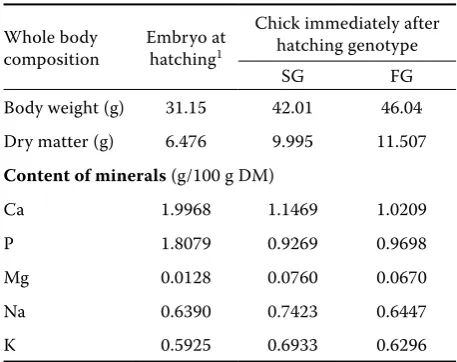
Table 1. Determined content of minerals immediately after hatching
Whole body
composition Embryo at hatching1
Chick immediately after hatching genotype
SG FG
Body weight (g) 31.15 42.01 46.04 Dry matter (g) 6.476 9.995 11.507
Content of minerals (g/100 g DM)
Ca 1.9968 1.1469 1.0209
P 1.8079 0.9269 0.9698
Mg 0.0128 0.0760 0.0670
Na 0.6390 0.7423 0.6447
K 0.5925 0.6933 0.6296
SG = slow-growing chick, FG = fast-growing chick, DM = dry matter
1Romanoff (1967)
Table 2. Growth functions Y = Aekt in two chicken genotypes
Y SG FG
A k IYX A k IYX
Body weight 35.14 0.0975 0.979* 47.27 0.1365 0.963*
Dry matter 7.688 0.1060 0.978* 10.529 0.1464 0.950*
Ca 0.0966 0.1401 0.973* 0.1269 0.1740 0.931*
P 0.0868 0.1349 0.954* 0.1191 0.1678 0.928*
Mg 0.0063 0.1247 0.960* 0.0084 0.1652 0.927*
Na 0.0552 0.0819 0.990* 0.0675 0.1287 0.974*
K 0.0668 0.1064 0.959* 0.0867 0.1551 0.919*
[image:3.595.64.536.559.713.2]Consequently, adequate mineral nutrition during this period of growth is of particular importance. Deposition of Na in dry matter was highly sig-nificantly (P < 0.01) slower in SG than in FG geno-type, the allometric coefficients being 0.7715 and 0.8779, respectively. When the relative growth of body constituents was expressed as a function of dry matter weight, the results showed that K in SG chickens deposited proportionally to body dry matter (b value close to 1.0), while the deposition of this element in FG chickens was faster.
REFERENCES
Angel R. (2007): Metabolic disorders: limitations to growth of and mineral deposition into the broiler skel-eton after hatch and potential implications for leg prob-lems. Journal of Applied Poultry Research, 16, 138–149. Brody S. (1945): Bioenergetics and Growth. 1st Ed.
Rein-hold Publishing Corporation, New York, USA. Eits R.M., Kwakkel R.P., Verstegen W.A. (2002): Nutrition
affects fat-free body composition in broiler chickens. Journal of Nutrition, 132, 2222–2228.
Emmans G.C. (1981): A model of the growth and feed intake in ad libitum fed animals, particularly poultry. In: Hillyer G.M., Whittemore C.T., Gunn R.G. (eds): Computers in Animal Production. Occasional Publica-tion No. 5., British Society of Animal ProducPublica-tion, Cambridge, UK, 103–110.
Gous R.M., Moran E.T., Stilborn H.R., Bradford G.D., Emmans G. (1999): Evaluation of the parameters needed to describe the overall growth, the chemical growth, and the growth of feathers and breast muscles of broilers. Poultry Science, 78, 812–821.
Kwakkel R.P., Verstegen M.W.A., Cucro B.J. (1997): Diphasic allometric growth of body components in White Leghorn pullets fed ad libitum and restricted diets. Poultry Science, 76, 1020–1028.
McDowell L.R. (1992): Minerals in Animal and Human Nutrition. 1st Ed. Academic Press, Inc., San Diego, USA.
Rodehutscord M. (2006): Optimising the use of phos-phorus sources in growing meat ducks. World´s Poul-try Science Journal, 62, 513–523.
Romanoff A.L. (1967): Biochemistry of the Avian Em-bryo. 1st Ed. John Willey & Sons Inc., New York, USA.
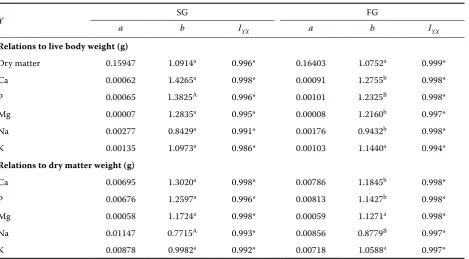
[image:4.595.66.536.112.371.2]Stojcic M.D., Bessei W. (2009): The effect of locomotor activity and weight load on bone problems in fast and Table 3. Allometric functions Y = aXb for relations between macrominerals and live body weight or dry matter weight in two chicken genotypes
Y SG FG
a b IYX a b IYX
Relations to live body weight (g)
Dry matter 0.15947 1.0914a 0.996* 0.16403 1.0752a 0.999*
Ca 0.00062 1.4265a 0.998* 0.00091 1.2755b 0.998*
P 0.00065 1.3825A 0.996* 0.00101 1.2325B 0.998*
Mg 0.00007 1.2835a 0.995* 0.00008 1.2160b 0.997*
Na 0.00277 0.8429a 0.991* 0.00176 0.9432b 0.998*
K 0.00135 1.0973a 0.986* 0.00103 1.1440a 0.994*
Relations to dry matter weight (g)
Ca 0.00695 1.3020a 0.998* 0.00786 1.1845b 0.998*
P 0.00676 1.2597a 0.996* 0.00813 1.1427b 0.998*
Mg 0.00058 1.1724a 0.998* 0.00059 1.1271a 0.998*
Na 0.01147 0.7715A 0.993* 0.00856 0.8779B 0.997*
K 0.00878 0.9982a 0.992* 0.00718 1.0588a 0.997*
SG = slow-growing chickens, FG = fast-growing chickens, X = live body weight or dry matter weight (g), Y = analyte weight (g),
a = extrapolation of Y for X = 1, b = allometric coefficient, IYX = index of correlation
a,bsignificant (P < 0.05) and A,Bhighly significant (P < 0.01) difference between genotypes
Corresponding Author
Prof. Ing. Jiří Zelenka, CSc., Mendel University in Brno, Faculty of Agronomy, Department of Animal Nutrition and Forage Production, Zemědělská 1, 613 00 Brno, Czech Republic
Tel. +420 545 133 159, fax +420 545 133 199, e-mail: zelenka@mendelu.cz slow growing chickens. Archiv für Geflügelkunde, 73,
242–249.
Suttle N.F. (2010): Mineral Nutrition of Livestock. 4th Ed.
CABI, Wallingford, UK.
Zelenka J. (1988): Retention of phosphorus in the organ-ism of fattened chicks. In: Proc. 21st International
Con-ference on Poultry Physiology. University of Agriculture. Prague, Czech Republic, 184–185.
Zelenka J., Fajmonová E. (2001): Calcium, magnesium and phosphorus retention in young chicks. Czech Jour-nal of Animal Science, 46, 22–26.
Zelenka J., Heger J., Kráčmar S., Mrkvicová E. (2011): Allometric growth of protein, amino acids, fat and minerals in slow- and fast-growing young chickens. Czech Journal of Animal Science, 56, 127–135.