Field-induced phase transitions in an antiferroelectric liquid crystal using the pyroelectric effect
N. M. Shtykov,1,2J. K. Vij,1,*R. A. Lewis,3M. Hird,3and J. W. Goodby3
1Department of Electronic and Electrical Engineering, Trinity College, University of Dublin, Dublin 2, Ireland 2Institute of Crystallography, Russian Academy of Sciences, Leninskii Prospekt 59, 117333 Moscow, Russia
3Department of Chemistry, University of Hull, Cottingham Road, Hull HU6 7RX, United Kingdom 共Received 23 July 1999兲
The antiferroelectric liquid crystal 共AFLC兲 under investigation possesses different helical polar phases. Measurements of pyroelectric response of these phases as a function of temperature and bias field have elucidated the ability of this method for investigating the nature of antiferroelectric phases and phase transi-tions under the bias field. The pyroelectric signal as a function of the bias field at fixed temperatures and as a function of temperature for fixed bias fields was measured for different phases of the investigated AFLC material. A theoretical model describing the pyroelectric response in different phases of AFLC is given, and the experimental results are interpreted. The threshold fields for field induced phase transitions are determined. The type of field induced phase transition from the AF phase in particular is found to be dependent on the temperature within its range. The properties of an unusual ferrielectric phase existing between ferrielectric chiral smectic-C (SmC*) and antiferroelectric AF phases are studied in a great detail. The results confirm that this phase is one of the incommensurate phases, predicted by the axial next-nearest neighbor Ising model and Landau model for this temperature region.
PACS number共s兲: 42.70.Df, 61.30.⫺v, 64.70.Md
I. INTRODUCTION
Antiferroelectric liquid crystals 共AFLC’s兲exhibit several chiral phases between paraelectric smectic A (SmA*) and antiferroelectric smectic CA (SmCA*). These phases were tentatively designated as SmC␣*, SmC*, and SmC␥* in or-der of decreasing temperature 关1兴. Among these phases SmC␣* seems to be more complicated than the other phases. Finally, this series of phases was added by the discovery of a number of additional ferrielectric and antiferroelectric phases. The existence of some of the ferrielectric phases is very sensitive to the optical purity of the AFLC’s. It was reported that phases SmC␣* and SmC␥*, which have ferri-electric properties, disappear with decreasing optical purity 关2兴. The SmC*phase is usually considered to be the same as the ferroelectric chiral smectic C (SmC*). But some re-searchers believe that the SmC* phase in optically pure samples should be considered as ferrielectric and not ferro-electric. It was also confirmed that a decrease in the optical purity causes the phase transition SmC*to SmC*phase关3兴. X-ray resonant technique employed on a thiobenzoate liquid-crystal compound has recently shown 关4兴 the existence of four phases with different superlattice periodicities. These phases are SmCA*, SmCFI1* , and SmCFI2* , with two-, three-, and four-layer superlattices, respectively, and SmC␣*, with a periodicity incommensurate with the layer spacing. In the SmC␣* phase an incommensurate periodicity was shown to lie roughly between from eight and five layers with decreas-ing temperature.
The appearance of antiferroelectric and ferrielectric phases in the tilted chiral smectic liquid crystals can be un-derstood to be a result of the competition between the
anti-ferroelectric and anti-ferroelectric interactions in adjacent smectic layers. This competition produces different periodic (A ⫹F) sequences of antiferroelectric共A兲and ferroelectric 共F兲 orderings among the smectic layers. Several different theo-retical approaches have been advanced for explaining a va-riety of the ferrielectric phases, and these postulates are based mostly at the expanded Landau model关5–7兴or on the one-dimensional Ising model关8兴and the axial next-nearest-neighbor Ising 共ANNNI兲model 关9–12兴. Recently, the short pitch modes model关13兴was presented, which describes an-tiferroelectric and ferrielectric phases as structures with cer-tain ‘families’ of modulation modes.
We take the ANNNI model, advanced for the antiferro-electric and ferriantiferro-electric phases in an antiferro-electric field 关12兴, as the basis for explaining a variety of different phase transi-tions observed in our pyroelectric experiments. The Hamil-tonian of the system with the third-nearest-neighbor interac-tion in the electric field E is given by
H⫽⫺J
兺
共i, j兲 sisj⫺J1
兺
i Asisi⫹1⫺J2
兺
i Asisi⫹2
⫺J3
兺
i Asisi⫹3⫺E
兺
isi, 共1兲
where the molecular state is expressed in terms of the Ising spin (si⫽⫾1), designating the direction of the molecular tilt, J, J1, J2, and J3 the interaction parameters, the first summation is taken over the nearest-neighbor pairs of mol-ecules in the same smectic layer and the second, third, and fourth ones are over those between the first-, second-, and third-nearest-neighbor layers, respectively. The superscript A denotes the axial direction. An essential and characteristic point of this model is the negative value for the energy parameter J2.
*Corresponding author. Email address: jvij@tcd.ie
PRE 62
In mean field theory, the thermodynamical potential is obtained as
⌽p⫽ 1 pi
兺
⫽1p
冉
⫺Jz2 i 2⫺J1ii⫹1⫺J2ii⫹2⫺J3ii⫹3
⫺Ei⫹ T
2兵共1⫹i兲ln共1⫹i兲⫹共1⫺i兲ln共1⫺i兲其
冊
, 共2兲where the order parameteriis the thermal average of si, p denotes the period of the ordered structure (i⫾p⫽i), T the absolute temperature 共a unit system was chosen with the Boltzmann constant equal to unity兲, and z the coordination number in the layer. The equilibrium conditions
⫺Jzi⫺J1共i⫺1⫹i⫹1兲⫺J2共i⫺2⫹i⫹2兲
⫺J3共i⫺3⫹i⫹3兲⫺E⫹ T
2ln 1⫹i 1⫺i
⫽0
共i⫽1,2,...,p兲, 共3兲
derived by minimizing Eq.共2兲with respect toi, are solved numerically to obtain the phase diagram of the system in the electric field 共Fig. 1 from Ref. 关12兴兲. In some cases, the jumps of the order parameters at the transition points from the modulated phases to the uniform one are small. In order to study the instability of the uniform phase, the order pa-rameteri isi⫽0⫹ui, where0, the value ofiat the uniform phase, is determined from the equilibrium condition
共⫺Jz⫺2J1⫺2J2⫺2J3兲0⫺E⫹ T
2ln 1⫹0 1⫺0
⫽0. 共4兲
Then the thermodynamical potential is expressed as
⌽⫽⌽共0兲⫹ 1 2
兺
qFq兩u共q兲兩2⫹O共u3兲, 共5兲
in which u(q) denotes the Fourier transforms of the devia-tion ui, and Fq is given by
Fq⫽⫺Jz⫹ T
1⫺02
⫺2共J1cos 2q⫹J2cos 4q⫹J3cos 6q兲. 共6兲
Instability of the uniform phase with respect to periodic per-turbation occurs when the minimum eigenvalue vanishes, that is, Fq⫽0, where the corresponding wave number q is determined from
J1sin 2q⫹2J2sin 4q⫹3J3sin 6q⫽0. 共7兲
This model predicts all the main phases observed in AFLC’s, SmC*(q⫽0), SmCA*(q⫽1
2), SmC␥*(q⫽ 1
3), and AF (q ⫽1
4). q is the reciprocal of the layer period共number of layers in a periodic structure兲. In addition to the existence of main phases, it also predicts a series of incommensurate subphases designated by the wave numbers 25,
3 8,
4 11,
2 7,
3 10, and
4 13; two of them, 2
5 and 2
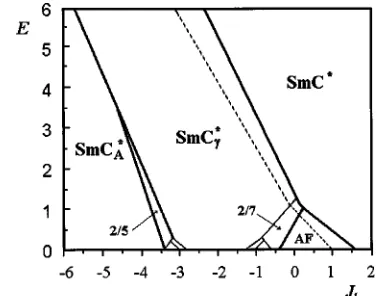
7, with the largest regions of existence, are shown in Fig. 1. The phase diagram was calculated for a normalized temperature T⫽6.0; the energy parameters are scaled in the unit 兩J2兩, and values Jz⫽6 and J3⫽0.3 are utilized. The broken curve shows the instability line of the uniform phase SmC*.
We use a method developed earlier 关14兴for pyroelectric measurements of FLC’s and AFLC’s under the action of external electric field. The pyroelectric signal as a function of bias field at fixed temperatures and as a function of tempera-ture at fixed bias fields was obtained for different phases of the AFLC material. Dielectric measurements and macro-scopic polarization observations were also carried out to complement the pyroelectric results. We also present a the-oretical model for the origin of the pyroelectric effect in different phases of AFLC’s for explaining the experimental results.
II. EXPERIMENT
The AFLC material used in our experiments was synthesized in Hull is 共R兲-共-兲-1-methylheptyl 4-共4
⬘
-dode-cyloxybiphenyl-4-ylcarbonyloxy兲-3-fluorobenzoate, with ac-ronym 12OF1M7. The molecular structure is given as [image:2.612.340.529.57.205.2]The following phase transition sequence for this material has been found under cooling, using conoscopy and the sponta-neous polarization measurements关15,16兴
FIG. 1. Phase diagram on E vs J1 plane for normalized T
SmCA* 共78 °C兲 SmC␥* 共81 °C兲 AF 共83 °C兲 FiLC 共90 °C兲 SmC* 共93 °C兲 SmA*共106 °C兲 Isotropic.
Here AF denotes the antiferroelectric phase, with a structure different than the SmCA* phase. This phase corresponds to the layer structure of SmCFI2* given by Mach et al.关4兴. The ferrielectric liquid crystal 共FiLC兲 phase exists over a wide range of temperatures with characteristics different from those of the SmC* phase. In our previous paper 关17兴, we reported that in the optically pure samples of this material, the SmC␣* phase can exist in the temperature range from 94.4 °C to 93 °C.
A cell of 15-m sample thickness, used for dielectric and pyroelectric measurements, consisted of two glass plates with a indium tin oxide 共ITO兲 layers as electrodes and the Mylar thin-film stripes as spacers. The dimensions of the working area of the electrodes was 4.5⫻4.5 mm2. Polyimide films 共Nissan Chemical Industry, RN-1266兲 were coated on the ITO electrodes, cured for a duration of 1 h at a tempera-ture of 250 °C, and then rubbed in one direction using a velvet track to achieve the alignment. The cell was heated and filled with the antiferroelectric compound in the isotro-pic phase, and cooled slowly to the SmA* phase.
For investigating the macroscopic polarization in different phases of the AFLC material, we used the pyroelectric method given in Ref. 关14兴. The temperature measurements were carried out during continuous cooling at a rate of 0.1 °C/min. The dependencies of the pyroelectric response on the bias field were measured at stabilized temperatures at the rate of voltage increase of 0.3 V/min. Dielectric measure-ments at a frequency of 1 kHz with application of bias field were made using an HP-4192A impedance analyzer.
III. THEORETICAL MODEL OF PYROELECTRICS IN AFLC PHASES
Pyroelectricity is a fundamental property of materials which have a spontaneous polarization, such as ferroelec-trics, ferrielecferroelec-trics, and antiferroelecferroelec-trics, and is due to a change in the spontaneous polarization with temperature. Glass et al. 关18兴 were the first to use the Chynoweth tech-nique 关19兴 for investigating the pyroelectric properties of ferroelectric liquid crystals. This technique involves the dy-namic heating of a sample with a chopped laser beam, and the detection of the pyroelectric signal using a lock-in am-plifier. Beresnev and Blinov 关20兴 used a pulsed Nd-glass laser for measuring the temperature dependence of the spon-taneous polarization, for the electric field dependence of the pyroelectric coefficient, and for observing the phase transi-tions.
In our pyroelectric experiments, the AFLC cell is irradi-ated by white light from a halogen lamp whose intensity is modulated at a frequency of 125 Hz with a chopper. Light absorption by the ITO electrodes and in turn by the AFLC’s, leads to the modulation of the sample temperature at the same frequency.
The pyroelectric signal generation may be described in terms of the time-dependent electric displacement D(r,t) which arises from the modulation of the temperature T(r,t)
of the sample. Here r is a spatial coordinate vector, and t is time. The electric displacement, along the bias electric field direction, i.e., the X axis, is given by D(r,t)⫽0(r,t)Edc ⫹P(r,t); 0⫽8.85⫻10⫺12F/m is the permittivity of free space,(r,t) is the relative permittivity of the liquid crystal, Edcis the bias electric field, and P(r,t) is a projection of the spontaneous polarization of the liquid crystal on the X axis. We assume that all quantities vary only in the direction of the helix axis共i.e., the Z axis兲and are constant in both X and Y axes. The current density j(z,t), at location z and time t, is given by the derivative of the electric displacement D(z,t) on t. The total pyroelectric current J(t) is proportional to the value of the current density j(z,t), averaged over the helical pitch Z, and the area of the sample electrode A,
J共t兲⫽A Z
冕
0zD共z,t兲
t dz⫽A
冉
0 d¯dt Edc⫹ d P¯
dt
冊
, 共8兲 where¯ and P ¯ denote averaged values of permittivity and polarization over the z coordinate. The time dependence of the relative permittivity and polarization is caused by the time dependence of the temperature. Therefore, we can re-write Eq. 共8兲in another form:J共t兲⫽A
冉
0 d¯dTEdc⫹ d P¯
dT
冊
dTdt
⫽A
冉
0 d¯dTEdc⫹␥
冊
dTdt ⫽A␥T dT
dt . 共9兲
␥T denotes the sum of the intrinsic pyroelectric coefficient
␥⫽d P/dT due to the spontaneous polarization and the con-tribution induced by the external electric field. The pyroelec-tric voltage Vpyrmeasured by a lock-in amplifier at the fre-quency of light modulation 共125 Hz兲 is proportional to the pyroelectric current, and hence to the pyroelectric coefficient
␥T.
We represent the spontaneous polarization of the ith phase with an external field Edcas Pi⫽ri(Edc) PS, where the phenomenological coefficient ri(Edc) describes a phase with an external field Edc. The macroscopic polarization in the sample is evaluated by summing the projections of dipole moments from all smectic layers over a period of the helix:
P
¯共T,Edc兲⫽1 Z
冕
0Z
Picos共z兲dz⫽ri共Edc兲PScos, 共10兲
where the azimuthal angleis the angle between the polar-ization of the smectic layer and the X axis. Now the intrinsic pyroelectric coefficient can be expressed as follows:
␥共T,Edc兲⫽
d P¯共T,Edc兲
dT ⫽ri共Edc兲
冉
d PSdT cos⫹PS d cos
dT
冊
. 共11兲The total pyroelectric coefficient ␥T is represented as
␥T共T,Edc兲⫽0 d¯
dTEdc⫹ri共Edc兲
冉
d PSdT cos⫹PS d cos
dT
冊
. 共12兲The pyroelectric coefficient increases with the bias field until a critical electric field is reached when the pitch of the helix goes to infinity and the structure of the phase is un-wound. For bias fields greater than the threshold for a com-plete helical unwinding, cosis constant and is equal to its maximal value of 1; the temperature derivative of cos is equal to zero. The first term in Eq. 共12兲also has a minimal value for such fields, if the temperature is not too close to the SmA*→SmC* phase transition, and can be neglected in comparison to the second term. In this case Eq. 共12兲can be simplified to the form
␥T共T,Edc兲⫽ri共Edc兲␥S共T兲, 共13兲
where ␥S(T) is the pyroelectric coefficient of ferroelectric SmC* phase. Since we are not interested in the absolute values of the pyroelectric coefficients, but only in their de-pendence on temperature or bias field in different phases, the coefficient ri(Edc) is calculated directly from the experimen-tal results as the normalized pyroelectric response
ri共Edc兲⫽
Vpyr共T,Edc兲
VS共T兲
, 共14兲
FIG. 2. Temperature dependencies of pyro-electric response Vpyr and dielectric permittivity
⬘ for bias electric fields 0.15 and 1.1 V/m, respectively.
FIG. 3. Dependencies of pyroelectric re-sponse on a bias field in SmCA*and SmC␥*phases
[image:4.612.51.352.57.244.2]where VS(T) is the pyroelectric response for the field-induced SmC* phase at temperature T. This is possible be-cause a pyroelectric voltage measured by lock-in amplifier is proportional to the pyroelectric coefficient: Vpyr ⫽RLA(dT/dt)␥T; here RL is the input resistance of the measuring scheme. Coefficient ri(Edc) calculated using Eq. 共14兲 coincides with that defined by Eq. 共13兲 for structures with unwound helices.
As was mentioned before, ri(Edc) corresponds to the ratio 1/n 共characterizing the spontaneous polarization of the AFLC phase in the one dimensional Ising model关8兴兲for bias fields when the helical structure is unwound and ri(Edc) be-comes approximately constant. In this case it can be used to characterising the field-induced AFLC phases. An increase in the coefficient ri(Edc) to a new stable level with an in-crease in the bias field indicates a field-induced phase tran-sition from one phase to the next.
[image:5.612.55.296.58.222.2]IV. RESULTS AND DISCUSSION
Figure 2 presents the dependence of the pyroelectric re-sponse on temperature when the bias field is lower than the critical field for helical unwinding in the SmC* phase. Ac-cording to this plot the pyroelectric signal is present in the
SmC␣*phase, the ferroelectric SmC*phase, the ferrielectric SmC␥*phase and the FiLC phase. The pyroelectric signal in these phases appears to be due to a distortion of the helical structures arising from the interaction of the spontaneous po-larization with the bias electric field. In the antiferroelectric AF and SmCA* phase, the pyroelectric response is absent because the spontaneous polarization in both these phases is equal to zero.
The effect of bias field on the pyroelectric signal in the SmCA*and SmC␥*phases is given in Fig. 3. At temperatures of 75 and 76 °C, which correspond to the antiferroelectric SmCA*phase, the pyroelectric response is low, and indepen-dent of bias field until 1.0 and 0.85 V/m, respectively, where the field-induced phase transition to the ferrielectric SmC␥* phase is reached. The field-induced transition to the unwound SmC* structure starts for these temperatures at fields of 2.0 and 1.85 V/m, respectively. It is important to note that the SmC␥* phase is unwound just after the phase transition from the SmCA* phase; otherwise the pyro-electric response would be almost zero. This finding is simi-lar to that of Hiraoka et al. 关21兴 from conoscopy measure-ments.
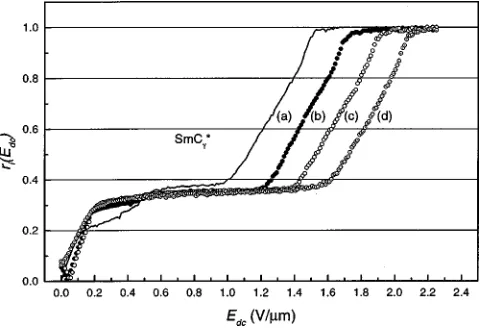
The field dependencies of the pyroelectric response corre-sponding to several temperatures in the SmC␥*phase共Fig. 3兲 show a typical ferrielectric dependence on bias field both for the spontaneous polarization 关15兴 and for the apparent tilt angle 关22兴. In the ferrielectric SmC␥* phase the pyro-electric response increases considerably with the bias field, due to a helical unwinding process which starts from a very low value of the bias field. A linear increase of the signal with the bias field is observed during the field-induced transition SmC␥*→SmC*. This is valid for all temperatures in the SmC␥*phase. The threshold field of the field-induced phase transition from SmC␥*to SmC*phases decreases with an increase in temperature. Figure 4 shows the field depen-dence of the normalized pyroelectric response in terms of the phenomenological coefficient ri(Edc) for the same temperatures as in the SmC␥* phase. As expected, for bias fields greater than the critical field of the ferrielectric helix unwinding, ri(Edc) is equal to the ratio 1/n of the one-FIG. 4. Dependencies of coefficient ri(Edc) on a bias field in
SmC␥* phase for several temperatures: 80.5 °C 共a兲, 79.5 °C 共b兲, 78.5 °C共c兲, and 77.5 °C共d兲.
[image:5.612.50.355.562.756.2]dimensional Ising model 关8兴 for the SmC␥* phase, and is ⬃1
3 for all temperatures.
The dependence of the pyroelectric signal and the coeffi-cient ri(Edc) on the bias field in the low temperature region 共Figs. 5 and 6, curves 81.0 °C and 81.5 °C兲looks similar to that in the SmCA*phase. The phase in this temperature range is designated as AF. One observes a low signal until the field-induced phase transition to the ferrielectric SmC␥* phase is reached; then the signal reaches a plateau corre-sponding to the unwound SmC␥* phase, after which a field-induced transition to the ferroelectric SmC*phase occurs. In this high temperature region, the field-induced transition from the antiferroelectric AF phase goes directly to the ferro-electric SmC* phase, without going through the SmC␥* phase. This experimental result, i.e., a kind of dependence of the field-induced phase transitions on the temperature region of the AF phase, partly confirms the theoretical prediction of Yamashita and Tanaka关12兴 共Fig. 1兲. However, a divergence exists between theory and our experimental results, namely, experimental data do not confirm the existence of the ferri-electric phase with qT⫽3/7(q⫽2/7), which should precede the SmC␥*phase, with the field increasing in low temperature
region. Instead of the three field-induced phase transitions predicted by theory, namely, qT⫽1/2(AF)→qT⫽
3 7, qT⫽
3 7
→qT⫽1
3(SmC␥*), and qT⫽ 1
3(SmC␥*)→qT⫽1(SmC*), ex-perimentally only two transitions are observed: qT⫽12(AF)
→qT⫽ 1
3(SmC␥*) and qT⫽ 1
3(SmC␥*)→qT⫽1(SmC*). It is worth noting that ri(Edc) for the field-induced ferrielectric phase in the low temperature region of the AF phase is some-what higher than 13 for the SmC␥* phase.
The dependence of the pyroelectric signal on the bias field for the SmC* phase is shown in Fig. 7 共93.0 and 92.5 °C兲. An initial linear response of the signal with the bias field, corresponding to the helix distortion, is followed by a depen-dence with a lower slope when the bias field approaches the critical field for the helix unwinding. From these curves we find that the critical field for a helical unwinding in the ferro-electric SmC*phase is⬃0.5 V/m. A decrease in the pyro-electric response with a further increase in field can be ex-plained by the first term of Eq. 共12兲. This term has sign opposite to that of the intrinsic pyroelectric coefficient for temperatures below the SmA*→SmC*phase transition, be-cause for these temperatures the soft mode contribution to the dielectric permittivity decreases with temperature. In Fig. 7 the pyroelectric signal for the FiLC phase at 92.0 °C is also presented. Two slopes for an increase in signal separated by a saturation region are observed in this case. The slope at higher fields is connected with an unwinding of the ferro-electric helical structure. This assignment follows from a comparison with the field dependence of the pyroelectric sig-nal for the SmC* phase. In addition to the process of the ferroelectric structure unwinding another process appears in this phase for bias fields less than 0.2 V/m, and leads to a stable structure which is different from the unwound SmC* phase.
[image:6.612.55.296.55.241.2]Figure 8 demonstrates the dependence of the pyroelectric response on the bias field for several temperatures in the FiLC phase. The common feature of the dependence of the signal on the field for all temperatures is that two regions of steep signal increases are separated by a region of a slow change in the signal. The high field increase corresponds to an unwinding of the ferroelectric structure. This shifts to higher fields with a decrease in temperature. The low field slope starts from the bias fields almost greater than zero field; ri(Edc) depends on the bias field 共Fig. 9兲 and on the FIG. 6. Coefficient ri(Edc) as a function of bias field in the
antiferroelectric AF phase at various temperatures: 83.0 °C 共a兲, 82.5 °C共b兲, 81.5 °C共c兲, 81.0 °C共d兲.
temperature within the FiLC phase. A stable value of ri(Edc)⬇0.6 is observed only in the high temperature region of the FiLC phase. For lower temperatures it depends on the bias field, and changes from 0.4 to 0.6 approximately lin-early with the field.
In order to explain the unusual behavior of the pyroelec-tric response observed in this phase, dielecpyroelec-tric measurements and the texture with a polarising microscopy were also ob-served. In Fig. 7 the results of the dependence of the dielec-tric permittivity
⬘
on the bias field at a temperature of 92 °C are also presented. The latter shows that, in addition to the ferroelectric Goldstone mode being suppressed at a bias field of 0.5 V/m, another process is suppressed at even lower fields 共⬍0.2 V/m兲. The mechanism of this process of sup-pression is not clear yet. It was reported关15兴that the dielec-tric spectrum of the 12OF1M7 共previously called AS-573兲 possesses two relaxation processes in this temperature re-gion: one is the ferroelectric Goldstone mode; and another can be assigned to the ferrielectric Goldstone mode because it also exists in the ferrielectric SmC␥*phase.Textures of the FiLC phase under the bias field were ob-served using a polarizing microscope. At temperatures of 89 and 86 °C an increase of the bias field up to 0.15 V/m leads to the appearance of the first domain texture. The sharp black-white stripes with a period of several microns are ori-ented perpendicularly to the rubbing direction, and thus par-allel to the smectic layers. A further increase in the bias field results in a disappearance of the domain texture. But when the field reaches values of 0.5 V/m at 89 °C and 0.65 V/m at 86 °C共see Fig. 8兲, the second domain texture is observed. The orientation of the second domain system is similar to the first one, but the stripes are more smooth, and their period is longer than that of the first system. The appearance of the domain textures in this phase seems to be a result of an unwinding of a helical structure in the two stages. One notes that the bias fields, for which the domain textures appear, coincide with the regions of an increase in the pyroelectric signal共Fig. 8兲.
The pyroelectric results are found to agree with the di-electric and polarization measurements 关15兴. The dependen-cies of the pyroelectric signal on the bias field show interest-ing behavior for SmCA*, SmC␥*, AF, and SmC*phases. For the FiLC phase, both the pyroelectric response and the
di-electric permittivity under the bias field exhibit interesting and unusual features. The ANNNI model with third-nearest-neighbor interaction 关23兴in this temperature region predicts the existence of one commensurate phase and two incom-mensurate phases with wave numbers q, correspondingly, of
1 5(qT⫽
3 5),
3 14(qT⫽
4 7), and
2 9(qT⫽
5 9).
[image:7.612.330.546.56.212.2]The Landau model 关6兴, involving an expansion of free energy in terms of ferroelectric and antiferroelectric order parameters, predicts that transitions from the SmC*phase to other phases go through incommensurate or soliton-lattice type phases in some cases. These phases represent a structure of the domain walls on a helix. Hence one can expect that two dielectric relaxation processes coexist for these phases: a Goldstone mode of a helix, and a mode involving a soliton-lattice motion. The soliton in this model is a domain wall that lies essentially in between two commensurate regions. The soliton-lattice state is formed by including a domain wall every few periods of a helix. As a consequence, the period of the soliton lattice is probably longer than the pitch of a helix in the commensurate regions. In general, the mac-roscopic polarization of the deformed helical structure of the domain wall is compensated for by the polarization of the other domain walls. When an electric field is applied across the cell in this incommensurate phase, an unwinding of the soliton-lattice occurs first, accompanied by the alignment of the macroscopic polarization of the domain wall along the direction of the field. The threshold field of this process is much lower than for helical unwinding in commensurate re-gions, for the reason that the threshold field is inversely pro-portional to the period of the helix. This corresponds to a first stepwise increase in the pyroelectric response with field. The second stepwise increase corresponds to the helical un-winding in the commensurate regions and a transition to an unwound SmC* phase. The observation of the phase transi-tion from FiLC to AF phases, depending on the temperature within the FiLC phase, is also due the existence of an incom-mensurate type phase. In Fig. 2 the temperature dependence of the dielectric permittivity
⬘
is presented, with the bias field of 1.1 V/m applied across the sample. One can seethat the Goldstone mode in FiLC phase is suppressed by this field, and the peak in the relative permittivity that is observed is due to the soliton-lattice mode, coinciding with the FiLC→AF phase transition. Thus the FiLC phase seems to FIG. 8. Pyroelectric response as a function of bias field in theferroelectric FiLC phase at various temperatures.
FIG. 9. Coefficient ri(Edc) as a function of the bias field in the
[image:7.612.55.295.57.224.2]be one of the incommensurate phases, predicted by the ANNNI and Landau models 关23,6兴, for the temperature re-gion between the ferroelectric SmC* phase and the antifer-roelectric AF phase, and that many of the unusual features of this phase find their explanations in terms of these models.
V. CONCLUSIONS
Pyroelectric measurements confirm the existence of sev-eral antiferroelectric and ferrielectric phases in an antiferro-electric liquid crystal, with a phase sequence of SmCA*-SmC␥*-AF-FiLC-SmC*-SmC␣*, in the absence of an external field.
In the antiferroelectric SmCA*phase, the threshold field of the field-induced transition from SmCA*to SmC␥*phases de-pends on a temperature: the higher the temperature, the lower the threshold field. The field-induced transition from SmCA* to SmC␥* phases is sharp; that is, the range from a threshold field to a saturation field is less than 0.2 V/m. It is found that the SmC␥* phase is unwound just after a phase transition from SmCA* to SmC␥*phases.
The threshold field of the field-induced transition from SmC␥* to SmC* phases, observed in SmCA*, SmC␥*, and AF phases, decreases monotonically with an increase in tem-perature. The field-induced transition from SmC␥* to SmC* phases is more than two times wider than the field-induced transition from SmCA* to SmC␥* phases and has a range, from the beginning of the transition to the end, of approxi-mately 0.5 V/m. In the SmC␥* phase a helical structure is
unwound with a weak field of⬃0.2 V/m.
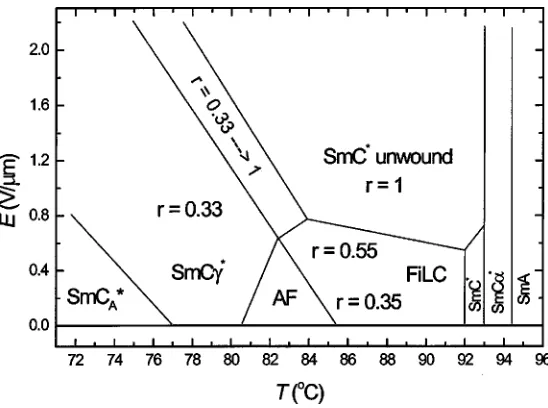
In the low-temperature region, the AF phase shows a field-induced transition to the SmC␥* phase, with a field of almost 0.5 V/m, and the SmC␥*phase is unwound just after the phase transition from the AF phase. The wideness of this field-induced transition is the same as for transition from SmCA* to SmC␥* phases. In the high temperature region of the AF phase, our results show a field-induced transition di-rectly from AF to SmC* phases without going through an intermediate SmC␥* phase. The field-induced phase transi-tions determined from these experiments are summarized in Fig. 10.
The pyroelectric data confirm the main theoretical predic-tions of the ANNNI model共Yamashita and Tanaka关12兴兲for the basic phases of SmCA*, SmC␥*, AF, and SmC* phases. In particular, it was found that the type of field induced phase transition from the AF phase differs for low and high temperatures for a range of temperatures of the AF phase.
The pyroelectric and dielectric results of the FiLC phase show the difference between FiLC phase and a typical SmC*phase. The FiLC phase seems to be one of the incom-mensurate phases, predicted for the temperature region between SmC* and AF phases, both by the ANNNI and Landau models.
ACKNOWLEDGMENTS
This work was supported by European ORCHIS network, and partly by RFBR Grant No. 98-02-17071.
关1兴A. Fukuda, Y. Takanishi, T. Isozaki, K. Ishikawa, and H. Tak-ezoe, J. Mater. Chem. 4, 997共1994兲.
关2兴M. Fukui, H. Orihara, Y. Yamada, N. Yamamoto, and Y. Ish-ibashi, Jpn. J. Appl. Phys. 28, L849共1989兲.
关3兴T. Sako, Y. Kimura, R. Hayakawa, N. Okabe, and Y. Suzuki, Jpn. J. Appl. Phys. 35, L114共1996兲.
关4兴P. Mach, R. Pindak, A.-M. Levelut, P. Barois, H. T. Nguyen, C. C. Huang, and L. Furenlid, Phys. Rev. Lett. 81, 1015
共1998兲.
关5兴H. Orihara and Y. Ishibashi, Jpn. J. Appl. Phys. 29, L115
共1990兲.
关6兴B. Zeks and M. Cepic, Liq. Cryst. 14, 445共1993兲.
关7兴V. L. Lorman, A. A. Bulbitch, and P. Toledano, Phys. Rev. E 49, 1367共1994兲.
关8兴T. Isozaki, K. Hiraoka, Y. Takanishi, H. Takezoe, A. Fukuda, Y. Suzuki, and I. Kawamura, Liq. Cryst. 12, 59共1992兲.
关9兴P. Bak and R. Bruinsma, Phys. Rev. Lett. 49, 249共1982兲.
[image:8.612.52.326.55.259.2]关10兴Y. Yamada and N. Hamaya, J. Phys. Soc. Jpn. 52, 3466
共1983兲.
关11兴M. Yamashita and S. Miyazima, Ferroelectrics 148, 1共1993兲.
关12兴M. Yamashita and S. Tanaka, Jpn. J. Appl. Phys. 37, L528
共1998兲.
关13兴S. Pikin, M. Gorkunov, D. Kilian, and W. Haase, Liq. Cryst. 26, 1107共1999兲.
关14兴A. Kocot, R. Wrzalik, J. K. Vij, and R. Zentel, J. Appl. Phys. 75, 728共1994兲; J. W. O’Sullivan, Yu. P. Panarin, and J. K. Vij,
ibid. 77, 1201共1995兲.
关15兴Yu. P. Panarin, O. Kalinovskaya, J. K. Vij, and J. W. Goodby, Phys. Rev. E 55, 4345共1997兲.
关16兴J. W. O’Sullivan, Yu. P. Panarin, J. K. Vij, A. J. Seed, M. Hird, and J. W. Goodby, J. Phys.: Condens. Matter 8, L551
共1996兲.
关17兴N. M. Shtykov, J. K. Vij, V. P. Panov, R. A. Lewis, M. Hird, and J. W. Goodby, J. Mater. Chem. 9, 1383共1999兲.
关18兴A. M. Glass, J. S. Patel, J. W. Goodby, and D. H. Olson, J. Appl. Phys. 60, 2778共1986兲.
关19兴A. G. Chynoweth, J. Appl. Phys. 27, 78共1956兲.
关20兴L. A. Beresnev and L. M. Blinov, Ferroelectrics 33, 129
共1981兲.
关21兴K. Hiraoka, A. D. Chandani, E. Gorecka, Y. Ouchi, H. Tak-ezoe, and A. Fukuda, Jpn. J. Appl. Phys. 29, L1473共1990兲.
关22兴K. Hiraoka, Y. Takanishi, K. Skarp, H. Takezoe, and A. Fukuda, Jpn. J. Appl. Phys. 30, L1819共1991兲.