Journal of the Statistical and Social Inquiry Society of Ireland Vol. XXXVIII
EXPLORING POPULATION PROJECTIONS: SOURCES OF UNCERTAINTY AND THE USER PERSPECTIVE
Dr Tony Dignan
Economic Research and Evaluation, Northern Ireland Statistics and Research Agency
(read before the Society April 22nd, 2009)
__________________________________________________________
Abstract: Government population projections are typically underpinned by a set of assumptions based on what has happened in the past, informed by expert opinion on what the future holds. The assumptions made are inevitably subject to uncertainty e.g. trends may change unexpectedly. This seminar considers sources of uncertainty in recent population projections for Northern Ireland and the Republic of Ireland, both national and sub-national. Past experience with population projections is examined to illustrate the effects of changing trends and economic circumstances. The seminar then looks at sources of uncertainty in the most recent 2006-based projections. The concluding remarks discuss the management of uncertainty.
Keywords: population growth, population projection, data collection JEL Classifications: C80, Q56, R11
1. INTRODUCTION
The future is inherently uncertain. That is why users of statistics look to official population projections to help in planning for the future across a range of government functions. In framing policies and making decisions on the future allocation of resources, projections help to answer questions such as:
Education – what is the number of school places likely to be needed over the next 5, 10 or more years? Infrastructure – what level of provision will be required for roads, water, sewage and other services? Health and social care – how are the needs of the population likely to evolve in coming years? Are we adequately prepared for an ageing population?
Housing – how many additional dwellings will be required in future years?
Dealing with uncertainty is also the major challenge in producing population projections. Government population projections are typically underpinned by a set of assumptions based on what has happened in the (recent) past, informed by expert opinion on what the future holds. The assumptions made are inevitably subject to uncertainty: trends can change direction; cyclical events and longer-term trends can be more or less difficult to disentangle; external and/or unanticipated ‗shocks‘ may occur; and, the economic climate may change.
This paper considers the sources of uncertainty in recent population projections for Northern Ireland and the Republic of Ireland, both national and sub-national. Past experience with population projections is examined to illustrate the effects of changing trends and economic circumstances. The paper then looks at sources of uncertainty in the most recent 2006-based projections. The concluding remarks discuss the management of uncertainty, primarily from the user perspective.
2. PROCESS
While the methodology for making population projections is the same in both countries, there are some differences which are worth noting at this juncture. Mainly, the differences relate to the frequency with which projections are produced and the presentation of the results.
Within the United Kingdom (UK), responsibility for producing national population projections, both for the UK as a whole and the four home countries, lies with the Office for National Statistics (ONS).1 The projections are undertaken at the request of the National Statistician and the Registrars General of Scotland and Northern Ireland and they are produced by ONS to ensure UK consistency. The Northern Ireland projections are jointly published by both ONS and the Northern Ireland Statistics and Research Agency (NISRA).
Presently, projections are made every second year, following a review of trends affecting fertility, mortality and migration. The assumptions on which projections are based are agreed in liaison with the devolved administrations. Consultations are also undertaken with key users of the projections in each country and with advice from an expert panel.
Any set of assumptions adopted will clearly be subject to uncertainty. For that reason, ONS produces what is called the principal projection and an accompanying set of variant projections, both for Northern Ireland and the other constituent countries of the UK. The use of variant projections is one means of handling uncertainty. The ONS variants for Northern Ireland are discussed later in this paper when considering the most recent 2006-based projections.
The principal and variant projections for Northern Ireland are available from the Government Actuary Department‘s (GAD) projections database.2 The most recent principal projections for Northern Ireland, from
2006 onwards, were published by NISRA in October 2007.3
NISRA also produces sub-national population projections, for each of 26 Local Government Districts (LGDs). Only one set of LGD projections is produced, from the principal projection. The most recent LGD projections, from a 2006 population base, were released in February 2008.4 The LGD projections are prepared on a ‗top-down‘ basis to ensure consistency with the Northern Ireland projections. Thus, in each year for which projections are made, the sum across the 26 LGDs of, say, the projected number of males aged 0-4 years will be the same as the overall Northern Ireland projections prepared by the ONS. Similarly, the components of change at LGD level will each sum to the respective Northern Ireland figures for births, deaths and net migration.
Though they are not discussed in this paper, NISRA also uses the population projections as a basis for projecting household numbers, by type and location. The 2006-based household projections were released in March 2008.5
In the Republic of Ireland, population projections are produced by the Central Statistics Office (CSO). The CSO also produces labour force projections which are derived from the age and sex population projections. The projections for Ireland are prepared on a five-year cycle, following each Census of Population. Thus, for the most recent projections, covering the period 2011 to 2041,6 the base population by age and sex is derived from the 2006 Census.
Ireland therefore differs from the UK in the frequency with which projections are prepared, as the latter follows a two-year cycle. This also highlights a second difference in the approach. In Ireland, the projections are based on Census of Population results. In the UK mid-year population estimates are used for the base population, as the UK only conducts a Census on a decennial basis. This means, however, that the estimated base population figures in UK projections are subject to revision following the completion of a Census.
Similar to the UK, the projections for Ireland are based on assumptions regarding future trends in fertility, mortality and migration, with input from an Expert Group. In contrast to the UK, Ireland does not produce a principal or central projection. Rather, a set of projections is prepared based on alternative combinations of
1 Previously, the projections had been prepared by the Government‘s Actuary Department (GAD), going back to
1954. Responsibility was transferred to ONS in 2006.
2
At http://www.gad.gov.uk/Demography_Data/Population/Index.asp.
3 See NISRA, 2007. For a review and commentary, see Dignan, 2008. 4 See NISRA, 2008a.
5
See NISRA, 2008b.
assumptions. Typically, the variant projections include high, low and/or medium assumptions for fertility and migration and a single mortality assumption. For example, in the most recent projections produced by the CSO, four variant projections were prepared, based on two migration assumptions combined with two fertility rate assumptions. In addition, two special case variants were produced, based on a zero net migration assumption for each fertility rate assumption.
The CSO also produces sub-national projections, for each of eight Regional Authority areas. In contrast to Northern Ireland, where only the principal projection is disaggregated, regional projections are made for the main national variants produced by the CSO.
As in Northern Ireland, the CSO‘s regional projections are prepared on a ‗top-down‘ basis to ensure consistency with the national projections. Reflecting the greater uncertainty that attaches to sub-national projections, the time period over which regional projections are made is shorter than for the national projections. Whereas the national projections extend for 35 years from the base year, a 20-year horizon is adopted for the regional projections. The most recent projections are for the period 2011-2026 and were published in December 2008.7
3. THE COHORT COMPONENT METHOD
The standard approach to making population projections, employed both in the UK and Ireland, is the cohort component method. The method is best understood as an accounting framework based around the following formula (see also Figure 1):
Projected population equals
Base population plus births minus deaths plus net migration
The difference between births and deaths is referred to as the natural increase in the population. Net migration is the difference between population gains due to in-migration from other areas compared with losses due to out-migration to other areas. As shown in Figure 1, the net change in the population from one period of time to another is determined by adding together natural increase and net migration. The net change can be positive or negative, depending on the balance between those components that result in additions to the base population (births, in-migration) and the components that bring reductions in the base population (deaths, out-migration).
Figure 1: Components of Population Change
Births
Deaths
In-migration Out-migration
Component of change
By single year of age
and sex
By single year of age and
sex
Base Population
Projected Population
Net Migration
Other areas
Minus
Plus Plus
Minus
Natural increase
Net change Population
effect
In practice, population projections using the cohort component method are prepared by single year of age and sex, i.e. age-sex cohorts.8 Starting from the base population, each age-sex cohort is successively aged through each of the years for which projections are to be made. For each cohort in each year for which projections are to be made, the projected number of deaths occurring in that year is calculated, based on an extrapolation of mortality trends, and then subtracted to give the surviving population in that cohort, which is aged on one year to the next period. Similarly, the assumed level of net migration is added (or subtracted if there are more out-migrants than in-out-migrants) to each age-sex cohort in each time period. Births are calculated in each projection period by applying assumed age-specific fertility rates to the female population of child-bearing age (generally 15-44).
The components of change framework depicted in Figure 1 highlights the main challenges involved in preparing a population projection. Thus, the accuracy or otherwise of the projected population will depend on:
The base population estimate.
The assumptions adopted for calculating the net change components.
As the base population estimate provides the starting point for the projections, any errors in the base population figures will be transmitted to all later years for which projections are made.
The key requirement in projecting deaths is to make assumptions regarding the mortality of the population. This is done by single year of age and sex, albeit deaths are strongly concentrated in the older age groups. The projected number of births in each period is obtained by applying age-specific fertility rates (the number of births per 1,000 women) to the number of women within each child-bearing age cohort.
At the national level, migration can be projected on a net basis, as in the UK, or by making separate assumptions for immigration and emigration and then deriving the net migration figure, as in the CSO model for Ireland. In either event, it is necessary to make assumptions about the age distribution of migration.
As noted by Shaw (2007), ―due to the inherent uncertainty of demographic behaviour, any set of projections will inevitably be proved wrong, to a greater or lesser extent, as a projection of future demographic events or population structure‖. This is a fundamental point to be appreciated in the use and interpretation of population projections. As noted above, the cohort component method is an accounting framework: if the assumptions for fertility, mortality and migration proved to be exactly ‗correct‘, the resulting population projections would provide perfectly accurate predictions of the future course of population growth.
Of course, the future can never be predicted with certainty. The actual out-turn for fertility, mortality, and net migration will inevitably diverge from the assumptions. Hence, the projected population will differ from what actually transpires in future years.
In general terms, the greatest uncertainty surrounds the assumptions for net migration. Partly, this is because, due to official registration systems, historical data on births and deaths are more reliable as a basis for extrapolating trends into the future. Historical migration data, on the other hand, will generally entail a degree of estimation and hence will be subject to a higher degree of error.
There are, however, other reasons why the components of change vary in terms of the uncertainty that attaches to the assumptions made for the cohort component method. In particular, the components vary in respect of the extent to which they are influenced by the choices that people make at different stages in their lives and the social and economic circumstances that shape those choices.
In that regard, there is perhaps less uncertainty around the projected number of deaths, because the population for whom assumptions need to be made have (mostly) already been born. Greater uncertainty surrounds fertility rate assumptions for projecting the number of births in future years. This is because people make choices about the number of children that they might wish to have and the stage in their lives at which to have children. Such choices are clearly subject to social and economic influences, which can be difficult to predict. Indeed, for longer-term projections (over 20-25 years), some of those who will be making those choices in future years have not yet been born themselves.
Net migration presents the greatest difficulty in making population projections. Partly, this reflects the fact that, unlike births and deaths, net migration is a derived figure, resulting from the balance between inflows and outflows. Mainly, however, the uncertainty stems from the array of influences, many of them external, to which migration flows are subject. In particular, migration flows are sensitive both to economic conditions and prospects in the host or receiving nation and to the relative attractiveness of the host nation to countries from which in-migrants originate. Consequently, net migration can fluctuate in tandem with the economic cycle, making it more difficult to discern trends likely to be sustained over any period of time. In general, migration is the most volatile component of population change and hence presents the greatest difficulty when seeking to make plausible assumptions regarding the future.
Depending on the forecast horizon, the foregoing uncertainties will vary in terms of their impact on different age cohorts and hence on the projected population age structure. For example, over a 15-20 year time period:
Mortality assumptions will have their largest effect on the projected number of older persons (i.e. those aged 65+).
The fertility assumptions will affect the projected number of young persons (less than 15-20).
The migration assumptions will mainly affect the projections for the working age population, especially those in the 15-44 age bands, albeit there will also be an effect as in-migrants in one period will subsequently have children.
4. PAST EXPERIENCE
This section seeks to demonstrate the effects of two important sources of uncertainty in the use (and production) of population projections:
Changing trends, especially the turning point problem. Changing economic circumstances.
the uncertainties associated with each component of change, not to provide an evaluation of the ‗accuracy‘ or otherwise of the projections.9
The influence of changing trends is demonstrated by focusing on the projections made for Northern Ireland in selected years from 1971 onwards, drawing on the GAD projections database. The impact of changing economic circumstances is illustrated with reference to the more recent experience in the Republic of Ireland.
Northern Ireland
[image:6.595.84.512.273.492.2]Figure 2 compares the mid-year population estimates for Northern Ireland with various projections made since 1971. Most strikingly, perhaps, the 1971-based projection10 was in excess of the actual out-turn in each year of the projection period. If the Northern Ireland population had followed the trajectory indicated by the 1971-based projection, the population would have risen from 1.5m to almost 2m by 2006, compared to the estimated out-turn of 1.74m. By contrast, the 1977-based projection under-predicted the actual population change in each projection year. The more recent projections shown in Figure 2, made in 1985, 1994 and 2004, have also under-predicted the actual population, albeit by much reduced margins compared to 1977.
Figure 2 Actual and projected population, Northern Ireland,1971-2031
1,300 1,400 1,500 1,600 1,700 1,800 1,900 2,000 2,100
1951 1961 1971 1981 1991 2001 2011 2021 2031
'0
0
0
s
Actual 1971-based 1977-based 1985-based 1994-based 2004-based 2006-based
The main reason that the 1971 projection over-predicted the growth in population is that it did not anticipate the sharp fall in fertility rates that brought an end to the 1960s baby-boom.11 Throughout the 1960s, the number of births in Northern Ireland was in excess of 30,000 per annum. The 1971-based projection assumed that fertility rates would remain high in subsequent years, with the number of births continuing to exceed 30,000 per annum. This assumption did not materialise.
A useful summary measure for illustrating the fertility assumption is the Total Period Fertility Rate (TPFR). The TPFR gives the average number of children that a woman would be expected to have over the course of her child-bearing years, given the age-specific fertility rates prevailing in a particular period of time. For example, the TPFR for Northern Ireland in 2006 was 1.94; based on the 2006 age-specific fertility rates, 1.94 is the number of children that a woman would be expected to have during her lifetime.
As can be seen from Figure 3, Northern Ireland entered the 1970s with a TPFR in excess of three. The 1971 projection assumed that the rate would taper off only slightly. As events transpired, the TPFR declined much more quickly than anticipated, tumbling from 3.12 in 1971 to 1.75 in 2000. Consequently, the number of births per annum dropped from over 30,000 in 1971 to 22,000 in 2000.
9
See, for example, Shaw (2007) and Keilman (2007) for evaluations of the accuracy of past projections.
Figure 3 Total fertility rate, N. Ireland, Actual and assumed,
1971-2031
1.5 1.7 1.9 2.1 2.3 2.5 2.7 2.9 3.1 3.3
1971 1981 1991 2001 2011 2021 2031
T
o
ta
l
fe
rti
li
ty
r
a
te
Actual 1971-based 1977-based 1985-based 1994-based 2004-based 2006-based Replacement
In each of the years 1977, 1986 and 1994, the assumed long-term fertility rates continued to be lowered in tandem with the falling trend in actual rates. However, as can be seen from Figure 3, fertility rates in subsequent years continued to decline more quickly than had been assumed. That is, over the period from 1971 to around the mid-1990s, fertility rate assumptions have been behind the actual trend. It is only since the actual fertility rate bottomed out and started to increase again in the early-2000s that the projection assumptions appear to have become more aligned with the actual out-turn. Whether the up-turn in fertility rates from 2003 onwards continues is an important issue for the 2006 projections, which are discussed later in this paper.
A broadly similar pattern can be seen from the comparison between mortality rate assumptions and the actual out-turn. Again, a summary indicator is useful for illustrating the relevant historical trends and the assumptions used for extrapolating into the future. The expectation of life at birth (EOLB) gives the number of years that a person would be expected to live, if that person experienced the age-specific mortality rates pertaining in the year of their birth.12 A rising EOLB signifies falling mortality rates, that is, people living longer.
Figure 4(a) Expectation of life at birth, Males, Northern Ireland
68 70 72 74 76 78 80 82 84
1981 1986 1991 1996 2001 2006 2011 2016 2021 2026 2031
Ye
a
rs
Actual 1985-based 1994-based 1991-based 2004-based 2006-based
Figure 4(b) Expectation of life at birth, Females, Northern Ireland
74 76 78 80 82 84 86 88
1981 1986 1991 1996 2001 2006 2011 2016 2021 2026 2031
Ye
a
rs
Actual 1985-based 1994-based 1991-based 2004-based 2006-based
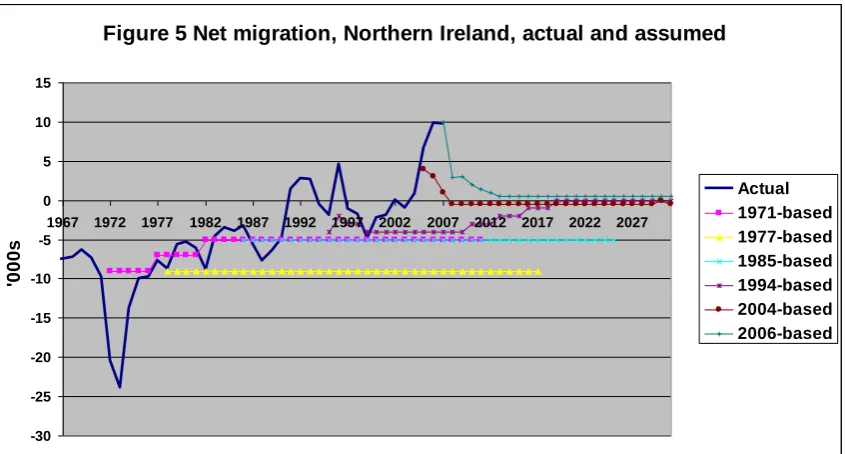
[image:8.595.75.502.73.296.2] [image:8.595.76.504.189.549.2]Figure 5 Net migration, Northern Ireland, actual and assumed
-30 -25 -20 -15 -10 -5 0 5 10 15
1967 1972 1977 1982 1987 1992 1997 2002 2007 2012 2017 2022 2027
'0
0
0
s
Actual 1971-based 1977-based 1985-based 1994-based 2004-based 2006-based
[image:9.595.80.503.72.299.2]The effects of the disparities between the assumptions made for each component and the actual out-turn from the population base year through to 2006 are summarised in Table 1. Thus, comparing the 1971-based projection for the 35-year period period from 1971 to 2006 with the actual out-turn over the same period, total population was over-predicted by an annual average of 7,000. Mainly, this was because the projected numbers of births exceeded the actual out-turn, on average, by 10,000 per annum. The excess in the number of projected births was partly offset by an over-prediction of the number of deaths, by 1,000 per annum, and a net out-migration assumption that was in excess of the out-turn by 2,000 per annum.
Table 1 Northern Ireland population projections: Difference between 2006 projected and actual, annual averages, ‘000s
Projection base year:
Total population
Births Deaths Net migration
Base year to 2006
„000s „000s „000s „000s Yrs
1971 7 10 1 -2 35
1977 -5 4 2 -7 29
1985 -1 3 0 -4 21
1994 -4 0 1 -4 12
2004 -4 0 0 -5 2
Note: Sum of components may not add to total change due to rounding error
In both the 1977 and 1985-based projections, births were also over-predicted when compared with the out-turn through to 2006, albeit by much diminished margins compared to 1971, as the fertility rate assumptions were successively adjusted downward in line with more recent data. As the fertility trend flattened out in the 1990s, the projections for births were more closely aligned with the out-turn.
A second interesting aspect of the Northern Ireland experience has been the effect of the net migration assumptions. From 1977 onwards, the projections have assumed a higher level of out-migration – and hence population losses - than actually occurred. At least through to 2004, the effect on the disparity between the relevant population projections and the 2006 out-turn has not varied greatly, ranging from an under-estimate of 4-7,000 per annum. Indeed, apart from 1971, this has been the main source of ‗error‘ when the population projections are compared to the 2006 out-turn. This might suggest that, based on past experience, migration assumptions for Northern Ireland should be less ‗pessimistic‘ on future occasions. However, as noted earlier, net migration is subject to an array of influences and can vary sharply from one year to the next. In that context, the (recent) past may not necessarily be a reliable guide to the future. Thus, the lesson to be drawn is perhaps that greater attention needs to be paid to the migration component. This conclusion is reinforced by considering the recent experience with population projections in the Republic of Ireland.
Ireland
As noted above, the CSO does not produce a principal projection for Ireland. Instead, it presents a range of projections based on alternative combinations of fertility and migration assumptions. The projections made following the population censuses of 1991, 1996 and 2002 are shown in, respectively, Figures 6a, 6b and 6c below.
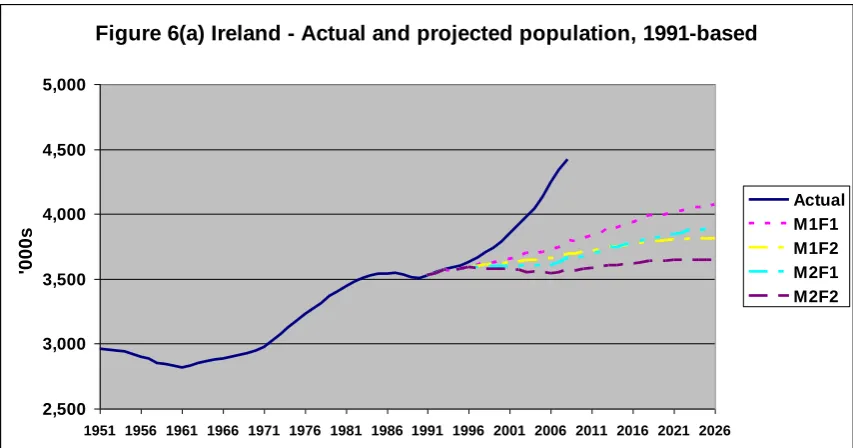
The 1991-based projection, made for the period 1996 to 2026, comprises four variants, based on two migration assumption (referred to as M1 and M2) and two fertility assumptions (termed F1 and F2) (CSO, 1995). Each variant is referred to according to the combination of assumptions on which the projection is based, hence M1F1, M1F2, etc. M1F1 gives the highest projected population while the lowest is associated with M2F2. As can be seen from Figure 6(a), each of the variant projections, including the high population growth projection (M1F1), under-predicted the actual population growth in the period from 1991 to 2008. For the 1996-based projections, six variants were prepared, based on three fertility and two migration assumptions (CSO, 1999). Again, the actual population growth was in excess of the projected growth for the period through to 2008. Notwithstanding the shorter time period, each of the variants in the 2002-based projection13 also under-predicted the population growth to 2008.
Figure 6(a) Ireland - Actual and projected population, 1991-based
2,500 3,000 3,500 4,000 4,500 5,000
1951 1956 1961 1966 1971 1976 1981 1986 1991 1996 2001 2006 2011 2016 2021 2026
'0
0
0
s
Actual M1F1 M1F2 M2F1 M2F2
[image:10.595.74.501.417.641.2]
Figure 6(b) Ireland - Actual and projected population, 1996-based
2,500 3,000 3,500 4,000 4,500 5,000
1951 1956 1961 1966 1971 1976 1981 1986 1991 1996 2001 2006 2011 2016 2021 2026 2031
'0
0
0
s
Actual M1F1 M1F2 M1F3 M2F1 M2F2 M2F3
Figure 6(c) Ireland - Actual and projected population, 2002-based
2,500 3,000 3,500 4,000 4,500 5,000 5,500 6,000
1951 1961 1971 1981 1991 2001 2011 2021 2031
'0
0
0
s
Actual M1F1 M1F2 M1F3 M2F1 M2F2 M2F3
[image:11.595.83.512.71.283.2] [image:11.595.81.516.202.549.2]Figure 7 Net migration, actual and assumed, M1 variant, Ireland
-60 -40 -20 0 20 40 60 80
1951 1961 1971 1981 1991 2001 2011 2021 2031
'0
0
0
s
Actual 1991-based 1996-based 2002-based
Historically, and apart from the 1970s, Ireland experienced net outflows of population due to the excess of emigration over immigration. The migration turnaround that commenced in the early-1990s was clearly due to the change in Ireland‘s economic circumstances and the relatively fast pace of growth that was maintained until recently. Since 2004, there have also been large inflows from Eastern Europe in the wake of the accession of the A8 countries. Thus, from the mid1990s through to 2008, Ireland has experienced sustained net inward migration at levels that were both unprecedented and unexpectedly large. Consequently, the migration assumptions have essentially been following in the wake of the upward movement in the net inflows.
In the period from 1991 to 2002, the fertility rate assumptions have exerted less influence than migration on the disparity between the population projections and the actual out-turn. As can be seen from Figure 8, Ireland also experienced a sharp decline in fertility rates throughout the 1970s and 1980s. However, the trend was broadly flat during the 1990s and the assumptions made in successive projections were largely in line with the actual out-turn.
Figure 8 Total fertility rate, actual and projected - F1 (High)
1.50 2.00 2.50 3.00 3.50 4.00 4.50
1960 1970 1980 1990 2000 2010 2020 2030 2040
T
o
ta
l
fe
rti
li
ty
r
a
te Actual
1991-based 1996-based 2002-based 2006-based
[image:12.595.75.499.476.699.2]out-turn (Figure 9). There were, however, large differences by age group, ranging from an under-projection of 10 per cent for the 25-44 age group to zero per cent for the 0-14 age group. The disparities are even more pronounced for the low population growth scenario (M2F3).
Figure 9 Ireland: 1996-based projections for 2006 compared with
actual, by age group
-14.0 -12.0 -10.0 -8.0 -6.0 -4.0 -2.0 0.0 2.0
0-14 15-24 25-44 45-64 65+ All
A
g
e
g
ro
u
p
Per cent
M2F3 M1F1
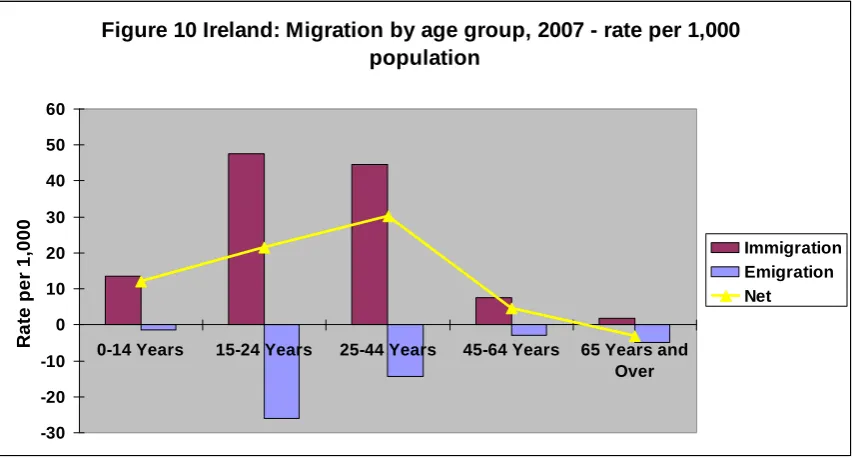
The reason for the large differences by age group is that migration is highly age-selective (Figure 10). Thus, if the net in-migration assumptions are too low, the resultant under-projection will be greatest for those aged 15-44, and vice versa.14 This serves to illustrate how uncertainties in one component (migration in this instance) have implications also for the projected age structure of the population.
Figure 10 Ireland: Migration by age group, 2007 - rate per 1,000
population
-30 -20 -10 0 10 20 30 40 50 60
0-14 Years 15-24 Years 25-44 Years 45-64 Years 65 Years and Over
R
a
te
p
e
r
1
,0
0
0
Immigration Emigration Net
[image:13.595.75.503.419.657.2]5. NATIONAL PROJECTIONS, 2006-BASED
Northern Ireland
The 2006-based principal projection for Northern Ireland is shown in Figure 2 above. Overall, the population is projected to increase from 1.7m in 2006 to almost 2m by 2031. The main assumptions underlying this projection are as follows (NISRA, 2007):
The TPFR will stabilise at around 1.95, representing a slight increase on the 2006 rate of 1.94.
Mortality rates by age group will converge to a common rate of improvement of one per cent per annum by 2031. The one per cent per annum decline in mortality rates is then held constant from 2031 onwards. For males, the EOLB will rise from 76 years in 2006 to 82 years by 2031. Females will see a rise from 81 years to 86 years.
Net migration is slated to remain high in 2006-07, falling to +1,500 by 2010-11 and remaining constant thereafter at +500.
Each of the foregoing assumptions is subject to a degree of uncertainty. Regarding the fertility assumptions, fertility rates have been steadily increasing since the early-2000s. The upturn in fertility rates can partially be explained by delayed fertility, with older women having more babies than previously. However given that all the reasons for the increase are not fully understood makes for a degree of uncertainty in framing assumptions for the projection period. Indeed, the most recent data for Northern Ireland show an increase in the TPFR to 2.016, which is equivalent to replacement level fertility i.e. the level of fertility required for the population to replace itself in the long term (see Figure 3 above). This raises the possibility that the recent upturn in fertility rates may continue, leading to an under-projection of births in the projection period. Alternatively, the fertility rate may revert back to below-replacement level, as has been the case since 1992. As can be seen in Figure 3 above, fertility rates also increased for a period in the mid-1970s before resuming a downward path.
The migration assumptions underlying the principal NI projection would appear to be based on the premise that inflows, mainly from Eastern Europe, will continue to boost net migration for the first five years of the projection period. Beyond 2011, the assumption essentially is based on a return to the situation prior to the EU Accession, with inflows more or less aligned with outflows.
One way of addressing the uncertainties surrounding the principal population projection is to make use of the accompanying variant projections. Two types of variants are produced, standard and special case projections. The standard variant projections are designed to represent plausible alternatives to the principal assumptions. For example, what would happen to population growth if net migration was assumed to be higher (or lower) compared to the assumption used in the principal projection? The special case variants are intended to ―illustrate the consequences of a particular, but not necessarily realistic, set of assumptions‖. For example, how would the population evolve if net migration was zero in all time periods i.e. where change was due entirely to the balance between births and deaths (natural increase)?
The special case variants are particularly useful in providing an understanding of the sources of population change in the principal projection so as to distinguish the separate effects of the fertility, mortality and migration assumption. Following the methodology outlined in Bray, 2008, it is possible to use the special case variants to identify the sources of change for the 25-year period 2006-2031, as follows:
Population momentum from the current age structure, assuming replacement level fertility, no mortality improvement and zero net migration.
The effect of below replacement level fertility. The effect of the assumed mortality improvement. The net migration effect.
The analysis of previous Northern Ireland projections presented above, which found a persistent under-estimation for net migration when assumptions were compared to actual out-turns, would seem to signal a concern that the central migration assumption in the 2006-based projections is on the low side. However, in the current economic circumstances, it is not unreasonable to assume a diminution in the net migration inflow, especially as the 2004-2007 period has seen unusually high volumes of net inflows (see Figure 4 above).
Table 2 Projected population change by source, 2006-2031, Northern Ireland
Source: Northern Ireland United
Kingdom
„000s % %
Population momentum from current age structure*
173 67.1 25.7
Assumed below replacement fertility -35 -13.7 -20.0
Assumed mortality improvement 77 30.0 24.8
Assumed inward net migration 43 16.6 69.5
All 257 100.0 100.0
*Replacement level fertility, constant mortality, zero net migration
Furthermore, while net migration has been an important source of growth in more recent years, it has relied heavily on the large inflows in the wake of the accession of the EU8. The EU accession impact can be expected to diminish over time, for a variety of reasons. Other EU member states will open their labour markets to the accession countries, thereby presenting intervening opportunities for potential migrants. Further, the relative attractiveness of NI as a destination may well diminish, particularly if there is a protracted recession in the wake of the ‗credit crunch‘. Albeit the timescale is uncertain, the accession countries can also be expected to exhibit a degree of catch-up or convergence in economic terms on the rest of the EU, over the medium to long-term. Nonetheless, it is still useful to consider high and low migration variants on the principal projection, as set out in Figure 11.
Figure 11 Actual and projected net migration, NI, 1966-2031
-30 -25 -20 -15 -10 -5 0 5 10 15
1966 1971 1976 1981 1986 1991 1996 2001 2006 2011 2016 2021 2026 2031
'0
0
0
s Principal
High Low
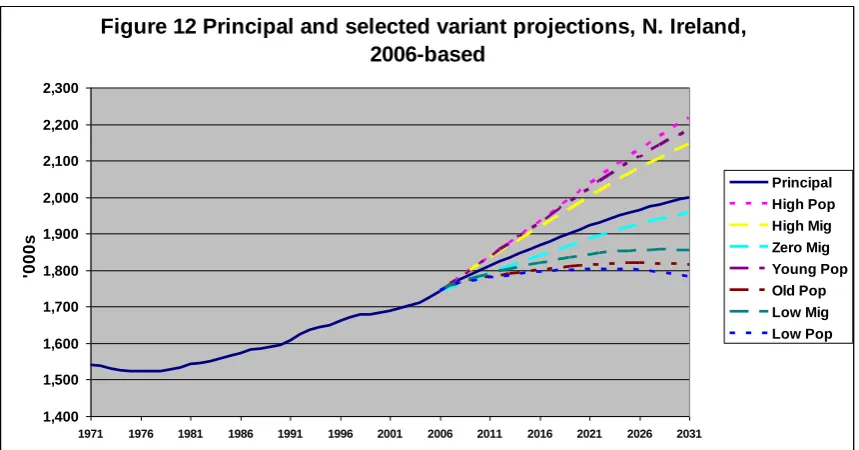
[image:15.595.79.502.489.707.2]persistent net outflow of -4,000 per annum would see the population rising to 1.854m by 2031, seven per cent below the principal projection.
Figure 12 Principal and selected variant projections, N. Ireland,
2006-based
1,400 1,500 1,600 1,700 1,800 1,900 2,000 2,100 2,200 2,300
1971 1976 1981 1986 1991 1996 2001 2006 2011 2016 2021 2026 2031
'0
0
0
s
Principal High Pop High Mig Zero Mig Young Pop Old Pop Low Mig Low Pop
In addition to the high and low migration scenarios, Figure 12 also shows some of the other population variants produced by ONS to illustrate the effect of varying assumptions regarding the components of population change.15 These illustrative variants are of two main types:
Single component variants, in which only one set of assumptions are varied e.g. the migration scenarios discussed above.16
Combination variants, in which the assumptions for two or more of the components of change are varied. In Figure 12, the high population and low population projections are both combination variants.
The variants serve to reflect the uncertainty that necessarily attaches to any population projection. However, to quote GAD, they ―are intended as plausible alternatives to the principal assumptions and not to represent upper or lower limits for future demographic behaviour‖.17
In that context, the ONS variants provide a means by which the user can test the sensitivity of their findings to variations in the principal population assumptions. For example, in assessing future needs for education facilities, the ONS scenarios could be used to examine the effects of faster or lower population growth on the needs assessment, compared to the principal projection. Nonetheless, care is required in selecting out the most appropriate variants for constructing alternative scenarios. In the education sphere, scenarios which illustrate uncertainties around the growth in the child population are likely to be of most relevance i.e. alternative fertility and migration assumptions.18 Alternatively, if the planner or policy-maker is concerned with the needs of older people, variants that highlight uncertainties around the ageing of the population will be of most interest.
Ireland
15
For an explanation of the variants, see
http://www.gad.gov.uk/Demography_Data/Population/Index.asp?v=Variant&y=2006&subYear=Continue.
16 In Figure 12, the single component variants are HF, HM, HL, LL, LM and LF.
17 The methodology currently used by ONS does not permit the specification of upper and lower limits. See
Shaw, 2007, and Keilman, 2007.
18 Migration is highly age-selective and tends to be disproportionately concentrated in the age range 18-34.
The 2006-based population projections for Ireland are based on two sets of fertility assumptions, as follows (CSO, 2008):
F1: The TPFR to remain at its 2006 level of 1.9 for the lifetime of the projections. F2: The TPFR to decrease to 1.65 by 2016 and to remain constant thereafter.
Similar to Northern Ireland, the projections for Ireland do not anticipate an increase in fertility over the projection period.
Mortality rates are assumed to decline to a long-term rate of 1.5 per cent per annum from 2031 onwards. For each year between 2005 and 2031, the mortality rates were calculated by linear interpolation.19 For males, the expected decline in mortality will see an increase in life expectancy at birth from 76.7 years in 2005 to 86.5 years in 2041. Females will see a rise from 81.5 years in 2005 to 88.2 years by 2041.
Compared to Northern Ireland, the mortality assumptions envisage a larger increase in male life expectancy in the period from 2005 to 2041 (+9.8 years compared to +7.4 years). Similarly, for females, albeit the projected improvement is not as pronounced (+6.7 years compared to +6.0 years for Northern Ireland).
[image:17.595.75.503.387.612.2]As stated by the CSO, and perhaps also reflecting the experience with previous projections as outlined above, the migration assumptions are based on the premise that ―the high economic and labour force growth experienced by Ireland in the past decade has radically changed the outlook in regard to migration. In short, the country has moved from a long-standing pattern of emigration to a new pattern of relatively strong immigration and it is unlikely that that this will be reversed to any sustained degree over the projection period‖. It was decided therefore to adopt assumptions based on ―immigration continuing at close to the current high rate and at more moderate levels‖. The resulting assumptions are shown in Figure 13.
Figure 13 Net migration, Ireland, actual and assumptions -
2006-based
-60 -40 -20 0 20 40 60 80
1951 1961 1971 1981 1991 2001 2011 2021 2031 2041
'0
0
0
s
Actual M1 M2 M0
In addition, the CSO prepared zero net migration variants for the two fertility assumptions. This was to permit a fuller assessment of the impact of migration.
Figure 14 Population projections, Ireland, 2006-based
2,500 3,000 3,500 4,000 4,500 5,000 5,500 6,000 6,500 7,000
1971 1981 1991 2001 2011 2021 2031
'0
0
0
s
Actual M1F1 M1F2 M2F1 M2F2 M0F1 M0F2
In both the high and low population variants, the migration assumptions exert the dominant influence. This is evident in Figure 14 from the size of the gap between the M1 and M2 variants and the zero net migration variant (M0), for a given fertility assumption, compared with the distance between alternative fertility rate variants for a given migration assumption. For example, in the M1F1 variant, the migration assumption accounts for two-thirds of the population growth projected for 2006 to 2031.20
Considerable uncertainty must, however, be attached to the migration assumptions in the 2006-based projections. The key issue is whether Ireland has in fact moved to a period of sustained high immigration, especially along the lines suggested by the M1 variant? Alternatively, will more modest levels of net migration be observed in future years, compared to the variants in the 2006-based projections? That is, should the recent surge in net migration, especially in the period from 2004 to 2007, be viewed more as an artifact of a cyclical boom in the economy, allied to the unusually large increase in potential labour supply following the A8 accession, as compared to a permanent upward movement in net migration inflows to Ireland?
Recent developments would suggest the latter. For example, the latest population and migration estimates, for 2008, show a sharp fall-off in net migration, from 67,000 in 2007 to 38,500 in 2008 (CSO, 2008c). The comments made earlier regarding future immigration inflows to Northern Ireland from the A8 countries can equally be applied to Ireland. At the very least, the high population growth variant (M1) would seem to be untenable at this juncture.
6. AGE COMPOSITION
While there are acknowledged uncertainties in both sets of projections discussed above, there is little doubt but that both countries will witness an ageing of their respective populations in the coming years. The population in the older age groups (60+) will expand much more rapidly than other age groups. The underlying effect can be illustrated using the zero migration variants. For the Republic of Ireland, the population aged 75+ is projected to increase by over 140 per cent between 2006 and 2031, compared to overall growth of 20 per cent (Figure 15). In Northern Ireland, the same age group is projected to almost double.
Figure 15 Projected percentage population change by age
group, 2006 to 2031: zero migration scenarios
-40 -20 0 20 40 60 80 100 120 140 160
0-15 16-29 30-44 45-59 60-74 75+ All
Pe
r
c
e
n
t
RoI NI
Consequently, in Ireland, the population aged 75+ is projected to increase its share of the total population from five per cent to 10 per cent (Figure 16). The number of people aged 60-74 is also expected to rise sharply, by 90 per cent in Ireland and 58 per cent in Northern Ireland, assuming zero net migration. By 2031, it is projected that people aged 60-74 will account for 17 per cent of the total population in Ireland, compared to 10 per cent in 2006 (Figure 15). In Northern Ireland, those aged 65 and over are expected to exceed the number aged 0-15 sometime before 2031 (Figure 17).
Figure 16 Age composition of the population, Ireland, actual and
projected (M0F1)
0 5 10 15 20 25
0-15 16-29 30-44 45-59 60-74 75+
Age group
Pe
r
c
e
n
t
[image:19.595.76.504.401.620.2]Figure 17 Population shares, Northern Ireland, actual and
projected,1961-2031
5 10 15 20 25 30 35
1961 1966 1971 1976 1981 1986 1991 1996 2001 2006 2011 2016 2021 2026 2031
R
a
ti
o 0-15
65+
The ageing of the population in the 2006-based projections is not a new phenomenon and has been signalled in previous population projections for both countries. The consistency in the patterns shown for the growth of the older age groups also helps to reduce uncertainty regarding the projections for population age structures. Interestingly, when the two countries are compared, even under the zero net migration variants, the projected growth in the older population is more rapid in Ireland than in Northern Ireland. As only one mortality assumption is used in Ireland, it is not possible to assess from the published data the extent to which the contrast reflects differences in the assumptions adopted for improvements in mortality.
7. SUB-NATIONAL PROJECTIONS
As noted previously, both Northern Ireland and Ireland produce sub-national projections on a top-down basis i.e. all components by area must sum to their respective national totals. This is a major strength of the sub-national projections, as it results in a consistent framework within which projections are prepared.
Nonetheless, uncertainty will be greater for the sub-national projections by comparison with the national figures from which they are derived. Partly, this is because the assumptions adopted for the national projections must be stepped down to the sub-national level. For example, birth and death rates may vary from one area to another for reasons other than differences in population age structure.
At the sub-national level, however, migration presents the greatest difficulties. Migration flows at national level, both immigration and emigration, must be allocated on a geographic basis. At the sub-national level it is also necessary to take account of flows from one area to another i.e. internal migration. By definition, internal flows sum to zero at the national level. But they are there also an additional component of change that must be managed. This adds a layer of uncertainty to sub-national projections that does not exist at the national level. Partly, this is because the two migration streams are often subject to different influences. For example, the movement of population from the cities is a well-established trend across the UK21 and the experience of Belfast shows Northern Ireland does not differ in that regard. External migration is subject to an array of influences, some of which can give rise to cyclical or short-term variations in flows to or from an area.
In addition, the smaller the area the more onerous will be the task of making population projections. Principally, this is because, the smaller the area, the more important is migration as a component of change.
As at national level, the cohort component method applied to sub-national areas relies in the first instance on the extrapolation of past trends, subject to modifications from other sources such as expert opinion. In that situation, it is useful for the user of such forecasts to first review the projected trends in light of the historical patterns. In a top-down framework it is particularly useful to look at area differences in population growth rates and/or shares. If the trends show an obvious break with the past the next step is to establish why that is the case and whether the ‗story‘ behind the break in trend is credible.
Northern Ireland
[image:21.595.79.500.132.361.2]For presentational purposes, this paper groups the 26 LGDs for which NISRA makes projections into the five main regional areas for which the principal population growth projections are shown in Figure 18.22
Figure 18 Northern Ireland: Population growth by region, actual
and projected
70 80 90 100 110 120 130
1981 1983 1985 1987 1989 1991 1993 1995 1997 1999 2001 2003 2005 2007 2009 2011 2013 2015 2017 2019 2021
Pe
r
c
e
n
t
o
f
2
0
0
6
Belfast
Rest of Greater Belfast East of NI
North of NI
West & South of NI
The historical pattern indicates a steady decline in Belfast‘s share of the total population of Northern Ireland. From 1981 to 2006, the regions outside Belfast have tended to grow at broadly comparable rates. However, the regional projections suggest that future years will see a degree of divergence in population growth rates that has not been apparent in previous years. In particular, both the West and South and North regions are projected to grow much more rapidly than their counterparts in the North and LGDs surrounding Belfast.
The shifts in projected regional growth rate differences shown in Figure 18 reflect the geographical patterns in the assumptions made for the components of population change i.e. natural increase and, at sub-national level, both internal migration and external migration.
Figure 19 Components of population change - Regions, 2006-2021
-20 -15 -10 -5 0 5 10 15 20 25
Belfast Rest of Greater
Belfast East of NI North of NI West & South of NI
Per cent of 2006 base
Natural increase Internal migration External migration
Nor is the divergence due to the projected pattern of internal migration, as the effect of this component is entirely consistent with the historical pattern i.e. a movement out of Belfast (-14 per cent) and into the LGDs immediately adjacent to Belfast as well as those in the East of Northern Ireland.
The main contrast between the regions lies in the assumptions for the effect of external migration. Thus, the external migration effect assumed for the West and South adds +13 per cent to the region‘s 2006 base population by 2021. More modest effects are projected for the East of Northern Ireland (three per cent) and Belfast (one per cent). The North of Northern Ireland and the Rest of Greater Belfast are both projected to lose population as a consequence of external migration, by four and six per cent respectively.
As discussed above (see Figure 11), the external migration assumption for Northern Ireland as a whole anticipates a reduction from the historically high levels that prevailed from 2003-04 to 2005-06 to a figure on net migration of 500 in the long-term. At the regional level, this has essentially taken the form of a scaling back, in absolute terms, of the most recent net inflows within their constituent LGDs (Figure 20).
Figure 20 Net external migration: Annual average flows 2004-07
and assumed effects 2006-21
-2,000 -1,000 0 1,000 2,000 3,000 4,000 5,000
Belfast Rest of Greater Belfast
East of NI North of NI West & South of NI
2004-2007 2006-2021
[image:22.595.73.500.474.699.2]region and the resulting more rapid pace of growth in that region, when compared with the rest of Northern Ireland.
Within that context, the main source of uncertainty in the sub-national projections for Northern Ireland lies in the external migration assumptions. The risk identified from the simple trend analysis is that the assumptions provide too strong a boost to the projected population growth in the West and South of Northern Ireland. That risk is further illustrated when the population projections are shown for Northern Ireland‘s spatial development strategy regions, i.e.
Belfast Metropolitan Area (BMA) and its hinterland, comprising Greater Belfast and parts of the East of Northern Ireland region.
The rest of Northern Ireland, comprising all of the North, the West and South and part of the East region.
[image:23.595.76.502.307.536.2]As can be seen from Figure 21, the regional projections suggest a sharp increase in the population share accounted for by the rest of Northern Ireland as compared with the BMA and its hinterland. From the preceding analysis of the external migration effect and its geographical distribution, it would appear that the sub-national projections may be overly reliant on the most recent trends. In that context, it would be useful to have an alternative projection variant to help in managing the uncertainty. This is not presently available in Northern Ireland.
Figure 21 Spatial Development Strategy regions: Population
shares, actual and projected
45 46 47 48 49 50 51 52 53 54 55
198119831985198719891991199319951997199920012003200520072009201120132015201720192021
Pe
r
c
e
n
t
BMA & Hinterland Rest of NI
Ireland
The most recent projections produced by the CSO for the eight Regional Authority areas in Ireland provide a contrast to Northern Ireland in two respects. First, they provide an instance of uncertainty around the future pattern of internal migration. Second, variant projections are provided for the regions and this helps to manage the uncertainty from the user‘s perspective.
Figure 22 Ireland - Regional population shares, 1951-2006
5 10 15 20 25 30
1951 1961 1971 1981 1991 2001
Year
P
e
r
c
e
n
t
Border Dublin Mid-East Midland Mid-West South-East South-West West
From 1971 through to the mid-1990s, Dublin‘s population share was roughly constant. However, since then, the share has dipped, albeit only by a percentage point, from 29 per cent to 28 per cent. This has, however, been a source of considerable uncertainty in framing the regional population projections for Ireland. The source of that uncertainty lies in the shift in the regional pattern of internal migration that occurred in the mid-1990s.
The traditional pattern of internal migration was one in which Dublin and the mid-east gained population from other regions with the remaining regions losing more people than they gained due to flows between the regions. This traditional pattern is shown by the internal migration flows from the 1996 Census of Population. By the time of the 2002 Census, the traditional pattern had reversed, with Dublin losing more people than it gained from internal migration. Apart from the mid-west, each of the other regions made net gains from internal migration. A similar pattern occurred in 2006.
Figure 23 Internal migration flows - rates per 1,000
-12.5 -10.5 -8.5 -6.5 -4.5 -2.5 -0.5 1.5 3.5 5.5 7.5 9.5 11.5
Border Dublin Mid-East Midland Mid-West South-East South-West West
Per 1,000 population
2006 2002 1996
The uncertainty arising from the shift in regional internal migration patterns has been addressed by the CSO through the production of two variant projections for internal migration (CSO, 2008), i.e.:
Recent: The pattern of inter-regional flows observed in the year to April 2006 (see Figure 23) is applied up to 2026.
[image:24.595.76.503.446.669.2]As in Northern Ireland, the regional projections for Ireland also require a geographical allocation of external migration flows (immigration and emigration). The assumptions adopted for external migration are shown in Figure 24.23 Thus, Dublin is projected to gain from external migration at a higher level than any other region.
Figure 24 Net migration by region: 2002-2006 (estimated)
-15 -10 -5 0 5 10 15 20 25
Border Dublin Mid-East Midland Mid-West South-East
South-West
West State
Pe
r
1
,0
0
0
p
o
p
u
la
ti
o
n
Internal External Net
Finally, only the moderate (M2) and zero net migration (M0) assumptions for national migration were used in the regional projections produced by the CSO. The high migration variant (M1) was not used.
The uncertainty surrounding the regional population projections is primarily centred on the Dublin region. This is clearly evident from Figure 25(a), showing Dublin‘s projected population share under each alternative assumption (the projections for the remaining regions are also shown for completeness).
Clearly, the user faces a choice between two very different scenarios for the future evolution of Dublin‘s population share. In the cohort component method, both scenarios are driven by trends, albeit the ‗traditional‘ scenario dates from the period prior to 1996. To that extent, the method itself provides no additional information on which to base a decision.
The choice between the two scenarios will essentially hinge on which of the two scenarios seems most plausible, given the user‘s understanding of, or access to, additional evidence on the reasons for Dublin‘s recent decline in population share and whether or not these reasons will extend into the future. For example, the fall in share may have reflected cyclical factors, such rapidly appreciating house prices during the economic boom period. Insofar as the user believes that Dublin‘s decline was largely a cyclical phenomenon, this would favour reliance on the traditional scenario, which projects a recovery in share under the M2 migration assumption and a stable share under M0.
Figure 25(a) Dublin's population share: Actual and projected
20 21 22 23 24 25 26 27 28 29 30
1951 1956 1961 1966 1971 1976 1981 1986 1991 1996 2001 2006 2011 2016 2021 2026
Pe
r
c
e
n
t
o
f
Sta
te Actual
M0F1 Recent M0F1 Traditional M2F1 Recent M2F1 Traditional
Conversely, the user may believe that the recent pattern of internal migration will in fact be sustained indefinitely. This would, however, see Dublin‘s share plummet to 22-24 percentage points. One would have to go back to 1951 to see Dublin with a lower population share. It is difficult to envisage such a dramatic weakening of Dublin‘s position.
Notwithstanding the choice facing the user, the Dublin case serves to illustrate the use of the cohort component method to produce alternative scenarios for the future evolution of the population by manipulating the assumptions required for the outputs. This is an important strength. However, the method does not provide any basis for choosing between alternative scenarios, other than the strength of the rationale on which those scenarios are based.
Figure 25(b) Rest of GDA's population share: Actual and
projected
6 7 8 9 10 11 12 13 14 15
1951 1961 1971 1981 1991 2001 2011 2021
Pe
r
c
e
n
t ActualM0F1 Recent
[image:26.595.77.480.74.286.2] [image:26.595.75.501.431.655.2]Figure 25(c) Rest of South & East's population share: Actual and
projected
31 32 33 34 35 36 37 38
1951 1961 1971 1981 1991 2001 2011 2021
Pe
r
c
e
n
t ActualM0F1 Recent
M0F1 Traditional M2F1 Recent M2F1 Traditional
Figure 25(d) BMW's population share: Actual and projected
25 26 27 28 29 30 31 32 33 34 35
1951 1961 1971 1981 1991 2001 2011 2021
Pe
r
c
e
n
t
Actual M0F1 Recent M0F1 Traditional M2F1 Recent M2F1 Traditional
8. CONCLUDING REMARKS
From a user perspective, the main differences between the approaches adopted in Ireland and Northern Ireland are as follows:
The frequency with which projections are prepared. There is a good reason for the five-year cycle in Ireland, as the Census of population provides a benchmark population base. In the UK approach, mid-year estimates are inevitably subject to a degree of measurement error. However, much can change in a five year period. There is therefore, a trade-off between the accuracy of the base year and the ‗currency‘ of the most recent projection.
The CSO eschews the nomination of a ‗principal‘ or central projection. While this serves to illustrate the uncertainty that surrounds population projections, the user may ultimately need to select one or other of the variants. But what criteria should the user employ in making such a selection?
[image:27.595.77.503.72.527.2]