Original Article
High CHD9 expression is associated with
poor prognosis in clear cell renal cell carcinoma
Bo Guan1,2*, Xian-Gui Ran3*, Yong-Qiang Du2*, Feng Ren4*, Ye Tian1*, Ying Wang5, Ming-Min Chen5
1Department of Urology, Capital Medical University, Beijing Friendship Hospital, Beijing, P. R. China; Departments of 2Urology, 3Respiratory and Critical Care Medicine, Fuyang People’s Hospital, Yingzhou District, Fuyang, Anhui Province, P. R. China; 4Youan Hospital, Capital Medical University, Beijing, P. R. China; 5Shanghai Outdo Biotech Co., Ltd., Shanghai, P. R. China. *Equal contributors.
Received April 18, 2018; Accepted May 22, 2018; Epub July 1, 2018; Published July 15, 2018
Abstract: Clear cell renal cell carcinoma (ccRCC) is the most common subtype of renal cell carcinoma. The chromo-helicase-DNA binding proteins (CHDs), containing nine members named CHD1-9, act as regulators of the chroma-tin remodeling process and gene expression. To determine the correlation between CHD9 expression and ccRCC, we performed an immunohistochemical staining in a tissue microarray (TMAs) containing tissue samples from 88 ccRCC patients. The results showed that cytoplasm CHD9 expression was statistically decreased in tumor tis-sues compared to adjacent tistis-sues (8.54±2.90 vs 12.61±2.05, P=0.000), while nuclear CHD9 expression was upregulated in the tumor tissues (1.47±2.93 vs 0.29±1.24, P=0.000). A univariate analysis found that cytoplasm CHD9 expression in cancer tissues was correlated with the patients’ pathological grading (P=0.002, r=0.330), the clinical stages (P=0.02, r=0.250) and the T grading (P=0.024, r=0.241) significantly. In addition, cytoplasm CHD9 expression in non-tumor tissues was correlated with the ccRCC patients’ pathological grading (P=0.031, r=-0.231) significantly. Patients with high cytoplasm CHD9 expression had a significantly worse prognosis than those with low cytoplasm CHD9 expression levels (59.7% vs 85.7%, P=0. 042). In conclusion, our study indicated the important role of CHD9 in ccRCC and suggested CHD9 may be a potential biomarker for prognostic prediction and a new target for therapy.
Keywords: CHD9, clear cell renal cell carcinoma (ccRCC), tissue microarray, immunohistochemistry, survival time, chemotherapy
Introduction
Renal cell carcinoma (RCC), which comprises a heterogeneous group of four epithelial neo-plasms with diverse biologic behaviors and variable clinical outcomes, is the most lethal of the common urological cancers. The most com-mon subtype is the clear cell renal cell carcino-ma, which makes up 75-80% of all RCC cases. The other three subtypes include papillary cinoma (PRCC, 10% of RCC), chromophobic car-cinoma (ChRCC, 5% of RCC), and collecting duct carcinoma (2% of RCC) makes up the other 20%-25% of RCC cases [1, 2]. Although a num-ber of targeted drugs have emerged in recent years, the overall survival times of patients with metastatic kidney cancer remain short [3]. The chromo-helicase-DNA binding proteins (CHDs) act as regulators of the chromatin
remodeling process and gene expression. The CHD proteins contain two basal tandem chro-mo domains and different additional domains, according to which the CHDs are divided into three sub-groups: CHD1-2, CHD3-5 and CHD6-9 [4, 5]. Chromatin remodeling plays a critical role in regulating gene expression throughout ontogenesis, and the CHDs associated with many human diseases and cancers include lymphoma, liver cancer, renal cancer, colorectal cancer, and stomach cancer [6-8]. For example,
CHD1 deficiency may contribute to prostate
cancer metastasis [9]. CHD4 and CHD3 bind
ZGPAT (zinc finger, CCCH-type with G patch
of the drosophila kismet enzyme and are char-acterized by the brahma and kismet domains at C termini. The mutant of CHD7, 8 could lead to the distinct disease states of CHARGE syn-drome and Kallman Synsyn-drome [12, 13]. There few studies on the relationship of CHD9 and human disease, especially on renal disease [14, 15].
Materials and methods
Clinical material
Tumor samples from 88 clear cell renal cell cinoma patients and their paired adjacent car-cinoma tissues were assembled in a tissue microarray (HKidE180Su03, Shanghai Outdo Biotech Co., Ltd). All the typical pathological sites on the HE slices were labeled by two pathologists, and then drilled on the blank
recipient paraffin (diameter was 1.5 mm) using
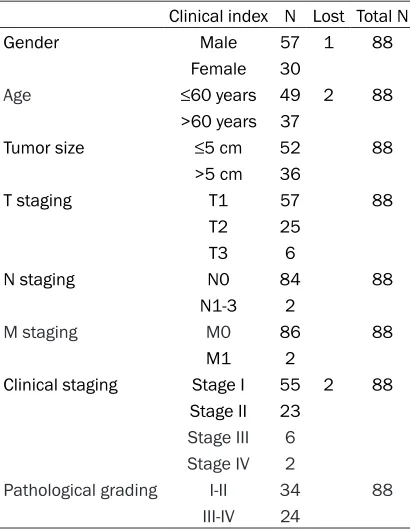
a tissue microarray instrument. The patients’ clinical information, including pathological information, such as their age, gender, tumor size, tumor differentiation, stage, TNM stage, distant metastasis and clinical stage, was detailed in Table 1.
The patients’ operations took place from Oc-
tober 2006 to February 2008. The final
follow-up date was in August 2015, so follow-follow-up times ranged from 90 to 106 months. During this fol-low-up time, 30 of the 88 ccRCC patients died of ccRCC (the overall survival time ranged from 2 to 79 months), and the other 58 survived. All patients were clinicopathologically diagnosed as having ccRCC and received no additional treatment before surgery.
Immunohistochemistry
As previously described, two-step Immunohist- ochemical staining was performed on a tissue microarray in this study [16, 17]. Firstly, after they were treated with an EDTA buffer to retrieve the antigen, the tissue sections were blocked with goat serum. Then the tissue sections were incubated with a primary antibody (Proteintech, 13402-1-AP, 1:1500) at 4°C overnight.
Next, the tissue sections were incubated with a secondary antibody, washed with PBS, and then, examined using a diaminobenzidine (DAB) system and hematoxylin re-dying, observed and analyzed under microscope. The CHD9 expression was scored and the tissues grouped according to their “positive staining rate score” multiplied by their “staining intensity score”.
The positive staining rate was defined accord -ing to the proportion of positively stained can-cer cells: “Negative” is 0, “1%-20%” for 1, “21%-40%” for 2, “41-60%” for 3, “61-80%” for 4. The
staining intensity score was defined as follows:
“Negative” is 0, “1+” for 1, “2+” for 2, “3+” for 3. Thus, patients were placed into the low
expres-sion group when the score was ≤6, while the
patients with a score >6 were placed into the high expression group.
Statistical analysis
Firstly, we statistically analyzed the positive staining rate and the intensity of immunohisto-chemical staining. The different expression of CHD9 in cancer and in the adjacent tissues was evaluated by NPar tests. Spearman’s cor-relation analysis was used to calculate the CHD9 expression in cancer and adjacent tis-sues. The relationships between the clinical indicators of the ccRCC patients and CHD9 expression were also analyzed by Spearman’s correlation analysis. In this study, the Kaplan-Meier survival analysis and a log-rank statisti-cal test were used to analyze the survival
fac-tors. Finally, statistically significant variables in
univariate analysis were also included in a COX
Table 1. Details of the ccRCC patients’ clinical information
Clinical index N Lost Total N
Gender Male 57 1 88
Female 30
Age ≤60 years 49 2 88
>60 years 37
Tumor size ≤5 cm 52 88
>5 cm 36
T staging T1 57 88
T2 25
T3 6
N staging N0 84 88
N1-3 2
M staging M0 86 88
M1 2
Clinical staging Stage I 55 2 88 Stage II 23
Stage III 6 Stage IV 2
Pathological grading I-II 34 88
multivariate regression survival analysis. Con- sider P<0.05 as statistically significant. Results
The expression of CHD9 in the cancer tissues and their adjacent cancer
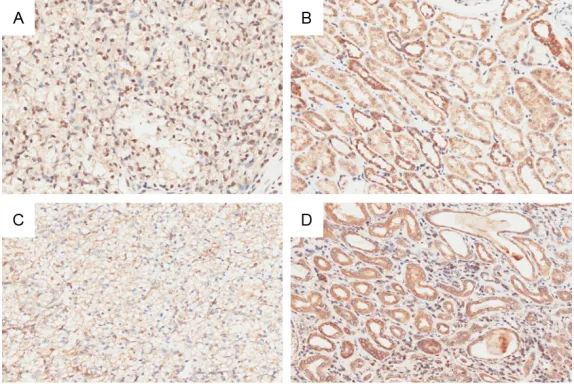
The NPar Tests showed that the cytoplasm CHD9 expression was statistically decreased in the cancer tissues compared to their adjacent tissues (8.54±2.90 vs 12.61±2.05, P=0.000) while nuclear CHD9 expression in cancer tis-sues was upregulated (1.47±2.93 vs 0.29± 1.24, P=0.000). The detailed images are sh- own in Figure 1.
The correlation of CHD9 expression between cancer tissues and their adjacent tissues
The Spearman’s correlation analysis showed that the relationships between cytoplasm CH- D9 expression and the nuclear CHD9 expres-sion in cancers or in non-tumors positively cor-related with the nuclear CHD9 expression in adjacent tissues (P=0.002; r=0.330).
The relationship between the CHD9 expression and ccRCC patients’ clinical index
The Spearman’s correlation analysis was us- ed to analyze the relationship between CHD9
ccRCC patients and the CHD9 expression
The relationship between CHD9 expression
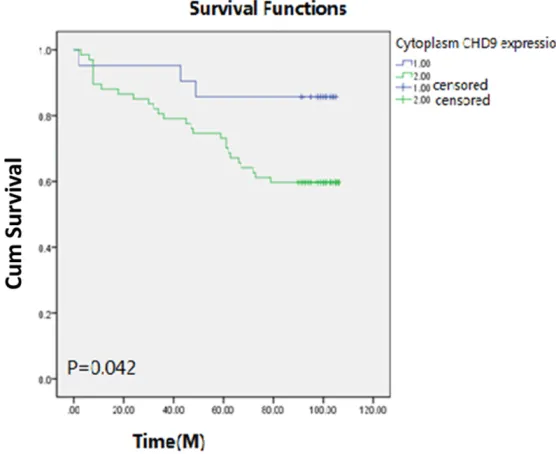
and the prognosis of ccRCC was defined accord -ing to the Kaplan-Meier method and the log-rank test. The results showed that patients with high cytoplasm CHD9 expression had a worse prognosis than those with a low cytoplasm CHD9 expression (59.7% vs 85.7%, P=0.042). The results are shown in Figure 2.
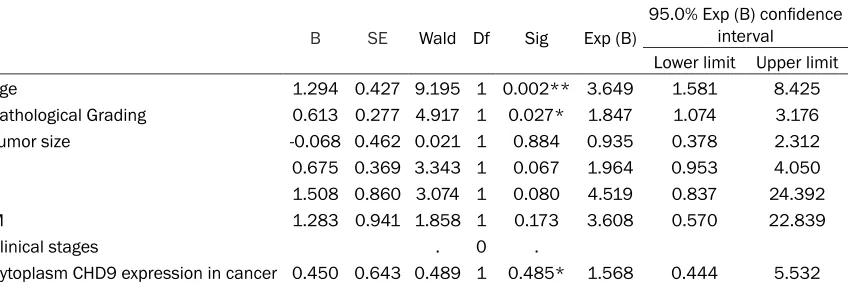
Subsequently, the COX multi-factor survival analysis showed that cytoplasm CHD9 expres-sion was not an independent predictive factor for ccRCC. The analysis results in detailed are shown in Table 3.
Discussion
[image:3.612.89.376.72.264.2]The Chromo Helicase DNA-binding proteins (CHDs) act as regulators of the chromatin remodeling process and gene expression in humans. It has been found that the CHD family contains nine members divided into three sub-groups according to the structural domains and features: CHD1-2, CHD3-5 and CHD6-9. The CHDs are associated with many human diseas-es and cancers including lymphoma, liver can-cer, colorectal cancan-cer, and stomach cancer [11]. Few studies have reported on the relation-ship between CHD9 and human renal disease or cancer.
Figure 1. Representative immunohistochemistry images of CHD9 expres-sion in ccRCC tissues and their para-carcinoma tissues: A. Nucleus CHD9 expression in tumor tissues; B. Nucleus CHD9 expression in adjacent tis-sues; C. Cytoplasm CHD9 expression in cancer tistis-sues; D. Cytoplasm CHD9 expression in adjacent tissues (Magnification times: ×200).
expression and ccRCC patien- ts’ clinical index including ge- nder, age, tumor size, patho-logical grading, TNM stage. and clinical stages. The results showed that the cytoplasm CHD9 expression in cancer
tissues correlated
significan-tly with patients’ pathological grading (P=0.002, r=0.330), the clinical stages (P=0.02, r=0.250), and T grading (P= 0.024, r=0.241). In addition, the cytoplasm expression of CHD9 in non-tumor tissues
correlated significantly with
ccRCC patients’ pathological grading (P=0.031, r=-231). The results are shown in Table 2.
We showed CHD9 expression in clear cell renal cell carcinoma through immunohistochemistry. The results show that the cytoplasm CHD9
expression was statistically significantly
de-creased, while nucleus CHD9 expression was upregulated in cancer tissues compared to their adjacent tissues. The nucleus CHD9 ex- pression in cancer tissues were positively cor-related with nucleus CHD9 expression in adja-cent tissues. These alterations of the CHD9 expression in ccRCC indicate that CHD9 expres-sion may be closely related to tumorigenesis
It is reported that the loss of CHD8 expression may serve as a novel indicator in gastric cancer [20], and CHD7 may be a novel biomarker in pancreatic cancer patients [21]. Thus, as the other member of CHD6-9, the CHD9 expres-sion must have some predictive value with the prognosis of ccRCC, even though the COX multi-factor survival analysis showed that CHD9 expression was not an independent predictive factor. The statistical results showed that patients with high cytoplasm CHD9 expression in cancer tissues had an obviously worse
prog-Table 2. The relationship between CHD9 expression and the ccRCC patients’ clinical index
Gender Age Pathological grading Tumor size T N M Clinical staging
Spearman’s rho Cytoplasm CHD9 expression
Tumor Correlation
Coefficient
-0.084 0.027 0.330** 0.057 0.241* 0.029 0.026 0.250*
Sig. (2-tailed) 0.437 0.805 0.002 0.596 0.024 0.792 0.808 0.020 Adjacent Correlation
Coefficient
0.024 -0.138 -0.231* -0.188 0.017 -0.028 -0.119 0.008
Sig. (2-tailed) 0.826 0.207 0.031 0.081 0.879 0.802 0.274 0.945 Nucleus CHD9
expression
Tumor Correlation
Coefficient
-0.004 0.027 -0.108 -0.056 -0.046 0.111 -0.092 -.012
Sig. (2-tailed) 0.969 0.804 0.318 0.606 00.672 0.307 0.395 0.913 Adjacent Correlation
Coefficient
-0.045 -0.069 -0.005 0.021 -0.081 -0.039 -0.038 -0.091
Sig. (2-tailed) 0.682 0.530 0.961 0.850 0.455 0.723 0.728 0.412
[image:4.612.95.522.84.236.2]**. Correlation is significant at the 0.01 level (2-tailed). *. Correlation is significant at the 0.05 level (2-tailed).
Figure 2. The relationships between the overall survival time of ccRCC pa-tients and CHD9 expression: 1.00 represents the papa-tients with low cyto-plasm CHD9 expression; 2.00 represents the patients with high cytocyto-plasm CHD9 expression.
[18]. Additionally, the cytopl- asm CHD9 expression in tu-
mor tissues was significantly
correlated with ccRCC pati- ents’ clinical index, including pathological grading, clinical grading and T stage. In line with previous studies, these
findings indicate that
cytopla-sm CHD9 expression has a
significant correlation with
tu-mor cell progression, develop-ment, and invasiveness in cc- RCC [19]. However, the cyto-plasm expression of CHD9 in non-tumor tissue was
corre-lated significantly negatively
[image:4.612.90.368.272.499.2]nosis than those with low cytoplasm CHD9 expression.
In summary, we found abnormal, upregulated expression of CHD9 to be associated with clini-cal index and overall survival in clear cell renal
cell carcinoma. The findings are in line with
CHD9 differential expression in the cytoplasm and nucleus, indicating that CHD9 expression correlates with survival and metastatic propen-sity in cancer. Though CHD9 expression could not serve as an independent prognostic mark-er, it still provides a reference for prognostic diagnosis. Our study indicated the important role of CHD9 in ccRCC and suggests that CHD9 is a potential biomarker for prognostic predic-tion and a new therapy target.
Disclosure of conflict of interest
None.
Address correspondence to: Ye Tian, Department of Urology, Capital Medical University, Beijing Friend- ship Hospital, Beijing 100050, P. R. China. Tel: +86-18611509977; E-mail: [email protected]
References
[1] Wang Y, Wan F, Chang K, Lu X, Dai B, Ye D. NUDT expression is predictive of prognosis in patients with clear cell renal cell carcinoma. Oncol Lett 2017; 14: 6121-6128.
[2] Rabjerg M, Bjerregaard H, Halekoh U, Jensen BL, Walter S, Marcussen N. Molecular charac-terization of clear cell renal cell carcinoma id- entifies CSNK2A1, SPP1 and DEFB1 as prom
-ising novel prognostic markers. APMIS 2016; 124: 372-383.
[3] Wang L, Yang G, Zhu X, Wang Z, Wang H, Bai Y, Sun P, Peng L, Wei W, Chen G, Li G, Zamyatnin AA Jr, Glybochko PV, Xu W. miR-93-3p inhibi-tion suppresses clear cell renal cell carcinoma proliferation, metastasis and invasion. Onco-target 2017; 8: 82824-82834.
[4] Seldon CS, Colbert LE, Hall WA, Fisher SB, Yu DS, Landry JC. Chromodomain-helicase-DNA binding protein 5, 7 and pronecrotic mixed lin-eage kinase domain-like protein serve as po-tential prognostic biomarkers in patients with resected pancreatic adenocarcinomas. World J Gastrointest Oncol 2016; 8: 358-365. [5] Shur I, Benayahu D. Characterization and fun-
ctional analysis of CReMM, a novel chromodo-main helicase DNA-binding protein. J Mol Biol 2005; 352: 646-655.
[6] Potts RC, Zhang P, Wurster AL, Precht P, Mu-ghal MR, Wood WH 3rd, Zhang Y, Becker KG, Mattson MP, Pazin MJ. CHD5, a brain-specific paralog of Mi2 chromatin remodeling enzy-mes, regulates expression of neuronal genes. PLoS One 2011; 6: e24515.
[7] Lin YW, Yan MD, Shih YL, Hsieh CB. The basal body gene, RPGRIP1L, is a candidate tumour suppressor gene in human hepatocellular car-cinoma. Eur J Cancer 2009; 45: 2041-2049. [8] Kim MS, Chung NG, Kang MR, Yoo NJ, Lee SH.
Genetic and expressional alterations of CHD genes in gastric and colorectal cancers. Histo-pathology 2011; 58: 660-668.
[image:5.612.98.522.97.239.2][9] Kari V, Mansour WY, Raul SK, Baumgart SJ, Mund A, Grade M, Sirma H, Simon R, Will H, Dobbelstein M, Dikomey E, Johnsen SA. Loss of CHD1 causes DNA repair defects and en-hances prostate cancer therapeutic respon-siveness. EMBO Rep 2016; 17: 1609-1623. Table 3. COX multivariate regression analysis of the independent predictors of CHD9 in ccRCC pa-tients
B SE Wald Df Sig Exp (B)
95.0% Exp (B) confidence interval
Lower limit Upper limit
Age 1.294 0.427 9.195 1 0.002** 3.649 1.581 8.425
Pathological Grading 0.613 0.277 4.917 1 0.027* 1.847 1.074 3.176
Tumor size -0.068 0.462 0.021 1 0.884 0.935 0.378 2.312
T 0.675 0.369 3.343 1 0.067 1.964 0.953 4.050
N 1.508 0.860 3.074 1 0.080 4.519 0.837 24.392
M 1.283 0.941 1.858 1 0.173 3.608 0.570 22.839
Clinical stages . 0 .
Cytoplasm CHD9 expression in cancer 0.450 0.643 0.489 1 0.485* 1.568 0.444 5.532 A. The degrees of freedom were reduced because of the constant or linear variation. B. Constant or linear covariance.
Clini-cal stages = T + N + M. **. Correlation is significant at the 0.01 level (2-tailed). *. Correlation is significant at the 0.05 level
[10] D’Alesio C, Punzi S, Cicalese A, Fornasari L, Fu-ria L, Riva L, Carugo A, Curigliano G, Criscitiello C, Pruneri G, Pelicci PG, Faretta M, Bossi D, Lanfrancone L. RNAi screens identify CHD4 as an essential gene in breast cancer growth. On-cotarget 2016; 7: 80901-80915.
[11] Li W, Mills AA. Architects of the genome: CHD dysfunction in cancer, developmental disor-ders and neurological syndromes. Epigenom-ics 2014; 6: 381-395.
[12] Batsukh T, Pieper L, Koszucka AM, von Velsen N, Hoyer-Fender S, Elbracht M, Bergman JE, Hoefsloot LH, Pauli S. CHD8 interacts with CHD7, a protein which is mutated in CHARGE syndrome. Hum Mol Genet 2010; 19: 2858-2866.
[13] Xu C, Cassatella D, van der Sloot AM, Quinton R, Hauschild M, De Geyter C, Flück C, Feller K, Bartholdi D, Nemeth A, Halperin I, Pekic Djurd-jevic S, Maeder P, Papadakis G, Dwyer AA, Ma-rino L, Favre L, Pignatelli D, Niederländer NJ, Acierno J Jr, Pitteloud N. Evaluating CHARGE syndrome in congenital hypogonadotropic hy-pogonadism patients harboring CHD7 varian- ts. Genet Med 2017; [Epub ahead of print]. [14] Shur I, Socher R, Benayahu D. In vivo
associa-tion of CReMM/CHD9 with promoters in osteo-genic cells. J Cell Physiol 2006; 207: 374-378. [15] Salomon-Kent R, Marom R, John S, Dundr M,
Schiltz LR, Gutierrez J, Workman J, Benayahu D, Hager GL. New face for chromatin-related mesenchymal modulator: n-CHD9 localizes to nucleoli and interacts with ribosomal genes. J Cell Physiol 2015; 230: 2270-2280.
[16] Yamada H, Sano Y. The biotinylation of the rab-bit serotonin antibody and its application to im-munohistochemical studies using the two-step ABC method. Histochemistry 1985; 83: 285-289.
[17] Mazzoni A, Carrilho M, Papa V, Tjaderhane L, Gobbi P, Nucci C, Di Lenarda R, Mazzotti G, Tay FR, Pashley DH, Breschi L. MMP-2 assay within the hybrid layer created by a two-step etch-and-rinse adhesive: biochemical and immuno-histochemical analysis. J Dent 2011; 39: 470-477.
[18] Wang G, Zeng Y, Chen S, Li D, Li W, Zhou Y, Singer RH, Gu W. Localization of TFPI-2 in the nucleus modulates MMP-2 gene expression in breast cancer cells. Sci Rep 2017; 7: 13575. [19] Helminen O, Huhta H, Leppanen J, Kauppila
JH, Takala H, Lehenkari PP, Saarnio J, Kart-tunen TJ. Nuclear localization of Toll-like recep-tor 5 in Barrett’s esophagus and esophageal adenocarcinoma is associated with metastatic behavior. Virchows Arch 2016; 469: 465-470. [20] Sawada G, Ueo H, Matsumura T, Uchi R,
Ishi-bashi M, Mima K, Kurashige J, Takahashi Y, Akiyoshi S, Sudo T, Sugimachi K, Doki Y, Mori M, Mimori K. CHD8 is an independent prog-nostic indicator that regulates Wnt/beta-catenin signaling and the cell cycle in gastric cancer. Oncol Rep 2013; 30: 1137-1142. [21] Colbert LE, Petrova AV, Fisher SB, Pantazides