Munich Personal RePEc Archive
Capital Flows to Least Developed
Countries: What Matters?
Hossain, Monzur
2013
Online at
https://mpra.ub.uni-muenchen.de/51229/
Capital Flows to Least Developed Countries: What Matters?
Monzur Hossain
*Bangladesh Institute of Development Studies (BIDS) E-17 Sher-e-Bangla Nagar, Agargaon, Dhaka 1207 E-mail: monzur@bids.org.bd; monzur_h@yahoo.com
Abstract
This study analyzes capital flows to least developed countries (LDCs) to understand their determinants and persistence. The study finds that macroeconomic stability, trade openness and financial sector development are the key determinants of capital flows (both official and private) to LDCs. Regional variation and economic size also matter for capital flows. While economic size is positively associated with official capital flows (external loans and grants), it is negatively associated with FDIs. The study does not find any link between capital inflows and institutional quality or political environment in LDCs, as opposed to the findings of some recent studies on emerging and developed countries. The results suggest for appropriate policies aimed at improving macroeconomic and financial environment with further liberalization of trade policies in order to ensure more capital flows to LDCs.
Key Words: Capital flows, LDCs, GMM estimator, Financing for development
JEL Classification: E44; F20; F34
* The paper was written while the author was a Visiting Scholar at the Graduate School of International
1. Introduction
The Brussels Program of Action (BPoA) underscored the need and ways to enhance least developed countries (LDCs)1 share in global trade, FDI and financial flows during 2001-2010 in order to foster economic growth and development in these countries (Commitment no. 5; May 2001). A review of performance of these countries in the external front has highlighted that LDCs commitments in the BPoA largely remains unfulfilled (BIDS, 2010; UNESCAP, 2000). Recent global financial crisis makes the LDCs vulnerable to external shocks because of their higher reliance on exports and dependence on aid and external debt. Even though developed countries committed to disburse more than 0.2 percent of their GNP as official development assistance (ODA) to developing countries during the decade, it was also not fulfilled (UNCTAD Report, 2006). Moreover, there is a fear that aid flows would shrink further in the face of recent recession in developed countries. It is therefore desirable for less developed countries to formulate proper policies and take actions to attract more capital flows (both private and official), which depends on understanding of the underlying factors influencing capital flows in these countries.
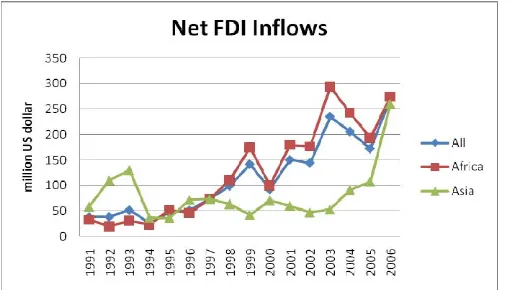
An important feature is that net and gross capital flows to LDCs is on a rising trend in the first half of 2000s as compared to the 1990s (Figure 1). How this rise of capital flows to LDCs can be explained? The rising trend of capital flows is supposed to be related to a country’s underlying capital and financial structure. The objective of this article is therefore to identify the factors that influence capital flows to this group of developing countries, and examine how persistent they are.
A widespread view holds that foreign direct investment, portfolio equity, and external debt in a country’s external finance are important determinants of economic performance, and to some extent, propensity to crises. Then, what are the determinants of capital flows? Recipient countries receive funds for investment which are not normally available from domestic sources, while investing countries receive a higher return than that of the developed world. In this context, interest rate differentials could explain capital flows. On the other hand, official funds from donor agencies or countries are available only when receiving
1Least Developed Countries (LDCs) are defined based on the following 3 criteria: (i) Low-income criterion
based on a three-year average estimate of the gross national income (GNI) per capita (under $750 for inclusion, above $900 for graduation), (ii) Human resource weakness criterioninvolving a composite Human Assets Index (HAI) based on indicators of: (a) nutrition; (b) health; (c) education; and (d) adult literacy, and (iii)Economic
vulnerability criterionbased on indicators of the instability of agricultural production; the instability of exports
countries could fulfil certain conditions, such as improvement and liberalization of their financial sector, privatization, good governance and macroeconomic stability.
It is apparent in the empirical literature that while a set of studies focus on the determinants of capital flows, other sets of studies focus on the persistence of capital flows. From analytical perspective, these two issues imply dynamic characteristics of capital flows. Moreover, proper care is necessary to encounter endogeneity bias in explaining capital flows. If the dynamic capital flows are analyzed in a static model, it will not provide an unbiased assessment of the factors associated with capital flows. This study thus takes into account of these problems in estimation by applying the Arellano-Bond GMM dynamic panel regression model to capital flows to a panel of 48 LDCs (the list are given in the Appendix-II) for the period 1991-2006. The GMM estimator considers the explanatory variables and the difference of the lagged dependent variables as instrument in the level equation. The lagged dependent variable is the instrument in the first-difference equation. Hence, the Arellano-Bond GMM estimator provides unbiased estimates of coefficients by encountering both persistency and endogeneity issues in the model.
There are two important qualifications of this paper. One, it estimates the persistency effect of capital flows—whether capitals are temporary or irreversible as well as its determinants. Second, this study considers capital flows to a particular group of countries (LDCs), which need greater capital flows for enhancing their economic development. It is important to assess the determinants of capital flows to these countries as the group is diverse (e.g., natural-resource endowed, land-locked, island etc.) as well as level of economic development varies substantially among these countries. While some of the LDCs receive greater capitals, but others do not. Why? This study attempts to provide some answers to this question.
persistent (persistent effect is 0.14), implying limited capital flows for financing development activities in LDCs.
The rest of the paper is organized as follows. Section 2 reviews literature on capital flows. Section 3 describes the data, presents the empirical strategy, and reports the main results and the robustness tests. Section 4 concludes the paper.
2. Review of literature on capital flows
Capital flows to developing countries can be classified into four broad categories: (i) portfolio equity flows consisting of bond and equity (i.e. developing country company share purchase); (ii) commercial bank lending from developed to developing countries; (iii) FDI, physical investment by non-residents to developing countries; and (iv) Official flows consisting aid, grants, concessional and non-concessional credits given to developing countries by donor agencies and countries. Among these four types of capital flows, first two are less relevant to LDCs because of their underdeveloped financial sector and capital market. In the cases of most LDCs, there are restrictions in place on foreign commercial bank borrowing as well as portfolio investment, particularly from the fear of crisis due to sudden reversals. However, FDIs and official flows are two major sources of capital flows to developing countries.
countries, Wei (2001) finds that weaker institutions are associated with less FDI and more bank loans.
In a recent cross-section study, Faria and Mauro (2009) find that equity-like liabilities as a share of countries’ total external liabilities are positively and significantly associated with indicators of educational attainment, openness, natural resource abundance, and institutional quality. Regarding the nature of capital flows, Sarno and Taylor (1999) show that equity, bond, official flows are relatively less persistent than bank credit and FDI flows. This finding is important from the perspective of sudden stops and reversals of capital flows.
Empirical investigation of the relationship between economic and institutional indicators and countries’ capital flows has reached a variety of results. In a cross-section of countries (including advanced economies), Hausmann and Ferna´ndez-Arias (2000) document no relationship or a negative relationship between the ratio of FDI inflows to total private capital inflows and institutional quality. In contrast, Wei (2000a,b; 2001) and Wei and Wu (2002) find that weak institutions tilt capital inflows toward bank loans and away from FDI, consistent with their hypothesis that foreign direct investors are less likely to be bailed out than are foreign banks in the event of a crisis.
Other studies have identified a number of additional factors that may influence FDI. Such factors include human capital, natural resources, economic size, and openness. Human capital may act as a stronger ‘‘pull’’ factor for FDI (Borensztein et al.,1998) than other forms of capital such as portfolio equity or debt. Natural resources may also attract FDI to a greater extent (Hausmann and Fernandez-Arias, 2000; Lane and Milesi-Ferretti, 2001b). Larger economic size (proxied by measures such as total GDP) also attracts FDI, which provides an opportunity to better serve the local market (possibly circumventing trade barriers). Finally, openness may reduce the need for ‘‘tariff hopping’’ FDI, though countries having quota-free market access of products may be an attractive destination for FDI, which may be called ‘efficiency-seeking’ FDI.
3. Empirical analysis
This section briefly describes the data, presents the empirical strategy, and reports the results. Appendix-I describes the data sources and variables in greater detail.
3.1 Data sources and variables used
capital (credit) flows (also termed as official flows), (ii) net FDI inflows, and (iii) total external debt. Net financial flows are disbursements of loans and credits less repayments of principal. It included concessional, non-concessional and other types of financial flows.
Foreign direct investment (FDI) is the sum of equity capital, reinvestment of earnings, other
long-term capital, and short-term capital as shown in the balance of payments. Total external debt is debt owed to nonresidents repayable in foreign currency, goods, or services. Total external debt is the sum of public, publicly guaranteed, and private nonguaranteed long-term debt, IMF credit, and short-term debt. Short-term debt includes all debt having an original maturity of one year or less and interest in arrears on long-term debt. Data are in current U.S. dollars. The data covers the period 1991-2006. Therefore, external debt includes bank borrowing also. We could not analyze private equity flows due to lack of sufficient data.
This study considers the explanatory variables following Faria and Mauro (2009). The explanatory variables include the size of the economy (total GDP in U.S. dollars at constant 2000 prices), the level of economic development (GDP per capita in U.S. dollars at constant 2000 prices), openness (sum of imports and exports over GDP), the relative importance of natural resources (share of exports of fuels, metals, and ores as a ratio of merchandise exports), human capital (percentage of population over 25 that has attended some secondary schooling), financial development (private credit to GDP or M2 to GDP),an index of institutional quality and indices of political system and legislative electoral competitiveness (LIEC).
The institutional quality is the simple average of six institutional indicators drawn from the World Bank governance indicators developed by Kaufmann et al. (2006): voice and accountability, political stability and absence of violence, government effectiveness, regulatory quality, rule of law, and control of corruption. In the full country sample of Kaufmann et al. (2006), each index ranges between -2 and 2 for the vast majority of countries, with a mean of 0 and a standard deviation of 1. Instead of simple averaging of the six subcomponents, one could consider extracting a common component (for example, the first principal component obtained by applying principal components analysis to the six series). This yields essentially the same results in other studies.
Except institutional data, the source of data, in most cases, is the World Development Indicators of the World Bank. The sources and definitions are discussed in the Appendix-I in greater detail. Table 1 reports the descriptive statistics for the variables used in this study.
sample consists of 48 countries (out of 49) defined as LDCs by the United Nations2. In addition, two groups of countries, namely African and Asian LDCs are analyzed separately. The reason for looking at both samples separately is twofold. First, LDCs in two regions are characterized by diverse geo-political and economic conditions. Some Asia-Pacific LDCs are land-locked and island countries, which are highly vulnerable to external shocks because of their dependence on highly concentrated exports and tourism. On the other hand, some African LDCs have been suffering from civil war, which are vulnerable to domestic real shocks. Second, the bulk of FDIs in Africa is of the resource-seeking type, while FDI directed towards Asian LDCs is mostly efficiency and quota-seeking. Hence, such grouping of countries will help control heterogeneity within developing countries of the same region in the analysis.
3.2 Estimation techniques
For estimating capital flows to LDCs, a dynamic panel GMM estimator has been applied. The reason is that a generalized method of moments (GMM, or difference GMM) estimator can encounter endogeneity problem as well as short-panel bias. Arellano and Bond (1991) make a first-difference to the panel data and then use the endogenous (or predetermined) lagged variables’ levels to instrument for the transformed lagged dependent variable. The lagged levels provide little information about the first differences when the underlying series are relatively stationary and, therefore, are weak instruments (Arellano and Bover, 1995; Blundell and Bond, 1998). To overcome the problem, Arellano-Bover and Blundell-Bond GMM employs additional moment conditions based on the lagged variables’ first differences (in addition to their levels) to increase the efficiency of the estimation. Therefore, to increase the efficiency of the estimates as well as to capture dynamics of capital flows, the Arellano-Bover/Blundell-Bond GMM model has been applied in the analysis.
3.3 The results
The determinants of capital flows—net FDI flows, external debt (gross capital flows) and net capital flows are reported in Tables 3, 4 and 5 respectively. The Arellano-Bond GMM estimates show a clear sign of persistence in capital flows to LDCs. Based on the Sargan (1958) test statistic, the optimal lag is found to be two years in most cases. The
explanatory variables and the difference of the lagged dependent variable are used as instruments in the level equation—the lagged dependent variable appears as instrument in the first-differenced equation. Thus, each explanatory variable appears in the instrument matrix. Arellano-Bond GMM estimator tests for AR(1) and AR(2) in first differences. The model introduces first order serial correlation. The test for no second-order serial correlation of the disturbances of the first-differenced equation is important for the consistency of the GMM estimator. In addition, the Sargan (1958) test for the joint validity of the moment conditions (the presence of over-identification) is crucial to the validity of GMM estimates. As the results show, there is first order serial correlation, but no second order serial correlation. Further, the Sargan (1958) test implies that the instruments used are orthogonal to the error term, that is, over-identification is rejected.
We begin by focusing on the determinants of the net FDI flows to LDCs in the whole sample for the whole period, and sub-periods: 1991-2000 and 2001-2006 (Table 3). The results show that net FDI flows are moderately persistent—the effect is 0.45 indicating that last year’s net FDI inflows will amplify current FDI inflows by 45 percent. For the whole sample, financial development, proxied by domestic credit to GDP ratio, and trade openness (total export and import to GDP ratio) are positively and significantly associated with FDI inflows to LDCs. Inflation rate and per capita GDP are negatively and significantly associated with FDI inflows. Thus, FDI inflows are associated with macroeconomic stability and lower level of development. The results are consistent with Faria and Mauro (2009) and Hausmann and Ferna´ndez-Arias (2000).
association was found with FDI inflows and institutional quality and human capital, which is also consistent with Hausmann and Ferna´ndez-Arias (2000).
As expected, external debt or gross official capital flows are found to be highly persistent in all model specifications—the persistent effect is about 0.60 (Table 4) implying their effect is strong. While total gross capital flows is positively and significantly associated with economic size (GDP), it is negative and significant for Africa but positive and significant for Asia. Financial development is positively, significantly and fairly robustly associated with the total gross capital flows in all model specifications. Openness, inflation rate and real exchange rate volatility are significant, indicating that macroeconomic stability and trade liberalization policies may be crucial for receiving more external debts. Natural resource abundance is negative and significant to total external debt, indicating that countries having natural resources are relatively less reliant on external loans or grants. Official flows are pertinent to LDCs having no or less natural resources in contrast to FDI flows. Again, human capital, institutional quality and political institutions are not found to be significant to gross official capital flows.
Finally, persistence and determinants of net capital flows are examined (Table 5). While net capital inflows are significantly less persistent for the whole sample period (0.14), it is not found to be significantly persistent for the sub-periods. Thus, in net terms, the flows of capitals to LDCs are restrained implying limited scopes of external financing for development activities in these countries. It is therefore important for LDCs to understand the determinants of net total capital flows. Net capital flows are found to be significant to economic size (GDP), financial development, low RER volatility, and natural resource abundance. Trade openness, human capital and institutions are not significant to net capital flows. Comparing results between net FDI flows and net capital (official credit) flows, it is clear that net official flows, in contrast to FDI flows, are associated with sound macroeconomic environment and the relatively higher level of economic development of LDCs.
To summarize the findings, although there is an evidence of sharp expansion of capitals to LDCs (more than 60% annually) in gross terms, it is only 14 percent in terms of net figures. The result indicates that LDCs are constrained by external financing for development, although official capital flows appear to have been more useful for the development of LDCs. The determinants of both gross and net capital flows are found to be the same—macroeconomic stability, financial sector development, and to a lesser extent, trade openness and natural resource abundance. Since all LDCs do not have the same level of natural resources, maintaining macroeconomic stability and continuous efforts for developing the financial sector could be an important policy options for LDCs in order to receive more capitals in a sustainable manner.
4. Conclusion
This study provides some explanations to the question of why some LDCs receive more capitals than the others. Although there is an evidence of sharp expansion of capitals (Official capitals such as external loans and grants plus FDIs) to LDCs (more than 60% annually) in gross terms, it is only 14 percent in terms of net figures. The results indicate that LDCs are constrained by external financing for development. Relatively bigger LDCs receive more official capitals than the smaller LDCs. On the other hand, smaller LDCs receive relatively more FDIs than the bigger LDCs. It is also observed that FDIs to LDCs has turned to efficiency-seeking in the 2000s from its nature of natural resource seeking in the 1990s.
The determinants of both gross and net capital flows are found to be the same— macroeconomic stability, financial sector development, and to a lesser extent, trade openness and natural resource abundance. The study, however, could not find any relationship between capital flows and institutional quality in LDCs. Since all LDCs do not have the same level of natural resources, policies aimed at maintaining macroeconomic stability including viable balance of payment situation, and financial sector development with further liberalization of trade regime could be an important strategy for LDCs to receive more capitals for financing development.
Table 1: Descriptive Statistics: averages 1991-2006
Maximum Minimum Mean Median Std. Deviation
Coeff. of Variation N Net Capital inflows
(million US dollar) 678.00 -58.50 63.10 22.30 101.00 1.60 816 External Debt (million
US dollar) 20500.00 29.10 3240.00 1750.00 4000.00 1.23 718 Net FDI inflows 3530.00 -1300.00 117.00 18.30 327.00 2.79 702 GDP (const., 2000,
US$) 65400.00 32.00 3720.00 1660.00 7240.00 1.95 689 GDP per capita
growth 90.07 -47.08 1.63 1.78 8.27 5.07 705 Institutional Quality 0.66 -2.20 -0.59 -0.55 0.54 -0.92 816
Openness 275.23 1.53 69.27 59.89 38.05 0.55 665 Natural resource 99.69 0.00 24.12 8.02 30.61 1.27 251
Political System 2.00 0.00 0.42 0.00 0.76 1.81 782
LIEC 7.00 0.00 5.27 6.00 2.08 0.40 782
Financial Development
(M2/GDP)(1) 753.98 2.07 33.78 23.99 51.15 1.51 672 Financial
Development
(Credit/GDP) (2) 1255.16 -27.34 33.21 15.94 95.50 2.88 669 Inflation rate 98.2 -9.62 11.9 7.32 15.5 1.30 549
13 Table 2: Pairwise correlations of variables: averages 1991-2006
Net capital inflows
External
debt FDI GDP
GDP per capita
Institutional
quality Openness Natural Resource
Political
System LIEC
Financial Development (M2/GDP)(1)
Financial Development (Credit/GDP)(2)
External Debt 0.49*** 1.00
FDI 0.07** 0.36*** 1.00
GDP 0.67*** 0.74*** 0.25*** 1.00 GDP per
capita
-0.19*** -0.17*** 0.30*** -0.06 1.00 Institutional
Quality 0.02 -0.27***
-0.21*** -0.12*** 0.05 1.00
Openness
-0.29*** -0.28*** 0.18*** -0.22*** 0.50*** 0.08** 1.00 Natural
resource -0.04 0.15*** 0.22*** -0.02 0.16*** -0.45*** 0.10 1.00 Political
System 0.07** -0.02 0.04 -0.04 0.03 0.03 0.01 -0.42*** 1.00 LIEC 0.08*** -0.05 0.03 -0.07* 0.01 0.00 -0.05 -0.49*** 0.81*** 1.00 Financial
Development (1)
-0.09*** --0.09*** -0.08** -0.04 0.00 -0.07* 0.20*** -0.14*** 0.01 -0.02 1.00 Financial
Development
Table 3: Determinants of net FDI inflows
1991-2006 1991-2000 2001-2006
All Africa (1) Africa (2) Asia All All
Lagged FDI flows 0.45 (0.05)*** 0.45 (0.06)*** 0.45 (0.06)*** 0.28 (0.12)*** -1.05 (0.08)*** 0.37 (0.07)***
GDP 13.64 (10.16) 17.22 (21.5) 20.54 (21.53) 14.16 (5.76)*** 51.31 (15.6)*** 9.41 (21.98)
Per capita GDP -3.78 (2.25)* -4.27 (2.58)* -4.62 (2.6)* -2.24 (4.6) -4.40 (1.79)*** -6.95 (5.06)
Inflation -0.18 (0.06)*** -0.17 (0.07)*** -0.17 (0.07)*** 1.85 (1.47) -0.26 (0.04)*** 0.42 (0.99)
RER volatility -0.002 (0.06) -0.01 (0.07) -0.01 (0.07) -0.15 (0.12) -0.06 (0.10) 0.02 (0.09)
Financial Development 8.40 (3.96)** 10.94 (4.84)*** 11.63 (4.84)*** 2.01 (3.45) -0.84 (3.7) 0.92 (5.7)
Openness 4.16 (1.18)*** 4.52 (1.48)*** 4.52 (1.48)*** 5.08 (1.09)*** 6.72 (2.7)***
Natural resource 0.68 (1.26) 0.96 (1.41) 2.20 (0.95)*** -8.35 (3.6)***
Human capital 4763.32 (4558) 8107 (7758) 9146 (7785) 2051 (2321) -579.65 (5732) -2091 (9372)
Fuel export -1.62 (2.19)
Ore and metal export 2.95 (1.8)*
Institutional Quality -22.41 (77.27) -4.89 (99.37) -4.89 (99.37) 14.62 (85.91) 53.97 (47.57) -141.03 (214.8)
Political System 4.19 (66.1) -11.54 (79.40) -11.54 (79.40) -10.84 (54.97) 114.47 (237.9)
LIEC -6.75 (12.19) -9.88 (13.99) -9.88 (13.99) -3.83 (9.76) -26.88 (34.48)
Constant -0.67 (5.8) 1.88 (7.67) 1.88 (7.67) -0.26 (4.32) 13.53 (6.30) 20.54 (18.87)
Sargan Test [χ2] 397.25*** 319.35*** 317.11*** 134.46*** 118.24*** 181.36***
15 Table 4: Determinants of external debt (Gross capital inflows), 1991-2006
1991-2006 1991-2000 2001-2006
All Africa (1) Africa (2) Asia All All
Lagged external debt 0.67 (0.05)*** 0.62 (0.06)*** 0.64 (0.06)*** 0.25 (0.08)*** 0.55 (0.08)*** 0.69 (0.11)***
GDP 52.32 (19.03) -72.50 (42.2)* -85.09 (42.6)** 113.0 (16.26)*** -23.72 (40.45) 124.0 (51.65)***
Per capita GDP growth -3.78 (2.25)* 4.28 (5.12) 6.77 (5.12) 1.83 (11.74) -2.51 (5.41) 2.58 (9.94)
Inflation -0.03 (0.14) -0.15 (0.15) -0.15 (0.15) 7.53 (3.8)** -0.03 (0.12) 1.58 (2.14)
RER volatility -0.31 (0.14) -0.34 (0.12)*** -0.32 (0.12)*** -0.58 (0.32)* -0.18 (0.35) -0.22 (0.16)
Financial Development 13.68 (4.8)*** 8.32 (5.16)* 8.40 (5.16)* 17.24 (4.4)*** -1.32 (5.15) 29.85 (11.58)***
Openness 4.16 (1.18)*** -1.82 (3.10) -2.32 (3.05) 0.36 (2.82) -7.50 (5.37)
Human capital 4763.32 (4558) 10989 (15213) 6507 (15103) -421 (16536) 20745 (19414)
Natural resource -5.24 (2.56)** -3.99 (2.76) -0.96 (2.77) -17.61 (7.01)***
Fuel export 3.18 (4.29)
Ore and metal export -6.57 (3.5)**
Institutional Quality 137.73 (164.02) 261.75 (199.5) 231.09 (200.58) 86.19 (22.34) 106.76 (149.92) -48.65 (420)
Political System -88.35 (135.7) 14.76 (153.7) 2.69 (154.02) -81.65 (121.86) -338.06 (409.6)
LIEC 18.48 (26.07) 24.18 (26.74) 20.44 (27.31) -17.67 (28.79) 45.92 (65.91)
Constant -31.6 (12.13)*** -22.26 (16.12) -18.17 (16.30) 15.75 (11.13) -8.54 (17.63) -98.98 (36.71)***
Sargan Test [χ2] 420.30*** 358.12*** 352.7*** 118.02* 120.33 193***
Table 5: Determinants of net capital inflows, 1991-2006
1991-2006 1991-2000 2001-2006
All Africa (1) Asia All All
Lagged net capital flows 0.14 (0.05)*** 0.11 (0.06)*** 0.15 (0.09)* 0.08 (0.08) 0.13 (0.08) GDP 3.41 (1.95)* 14.93 (5.84)*** 5.20 (1.8)*** -4.44(4.57) 14.89 (4.04) Per capita GDP growth 0.53 (0.58) 0.41 (0.58) 0.86 (1.75) 0.51 (0.67) 0.26 (0.94) Inflation 0.009 (0.02) 0.01 (0.02) 0.13 (0.56) 0.002 (0.02) 0.02 (0.33)
RER volatility -0.02 (0.01)* -0.02 (0.01)** -0.04 (0.04) -0.04 (0.04) -0.04 (0.02)** Financial Development 1.19 (0.54)*** 1.64 (0.55)*** 0.005 (0.63) 1.12 (0.64)* 0.74 (0.99)
Openness 0.06 (0.29) 0.25 (0.31) -0.20 (0.33) 0.66 (0.53)
Human capital -742.43 (1119) 680 (1534) -1465 (1957) -724 (1689)
Natural resource 0.86 (0.32)*** 0.92 (0.33)*** 1.04 (0.35)*** 0.50 (0.64)
Institutional Quality -21.72 (18.51) -19.38 (21.3) -11.6 (32.6) -0.24 (18.59) -55.08 (38.92)
Political System -7.73 (13.7) -5.01 (14.81) -15.4 (13.7) -24.55 (33.92) Constant 1.31 (1.26) -0.24 (0.32) -1.90 (1.63) -2.38 (2.03) -1.29 (3.52)
Sargan Test [χ2] 233.98*** 176.03*** 112.85* 65.25*** 138.23*** Autocorr. (1)
Autocorr. (2) N
-13.48*** 0.66
400
-11.40*** 0.63
308
-8.44*** 1.02
115
-7.00*** 0.08
218
-7.56*** 0.25
182
Appendix I:
A. Dependent variables:
Net FDI inflows, external debt and net capital inflows are used as dependent variables. Data are taken from World Development Indicators (WDI), the World Bank. The values of the variables are expressed in million dollars.
B. Independent variables:
Institutional quality index
Simple average of six institutional indicators (voice and accountability, political stability and absence of violence, government effectiveness, regulatory quality, rule of law, control of corruption), drawn from Kaufmann et al. (2006), for all available years between1991 and 2007. The institutional quality index in a given year is formed only for countries that have information for all governance indicators in that year. Each institutional indicator is modeled by the authors as a standard normal distribution (zero mean, and standard deviation one);
http://info.worldbank.org/governance/wgi2007/resources.htm.
Gross domestic product
Constant 2000 U.S. dollars for all available years between 1991 and 2007. Rescaled to millions in the regressions to make results more legible. Source: World Development Indicators, World Bank.
GDP per capita
Constant U.S. dollars in 2000 for all available years between1991 and 2007. Source: World Development Indicators, World Bank.
Financial development
Private credit divided by total GDP for all available years between 1991 and 2007. Source: World Development Indicators, World Bank.
Natural resources
Percentage of ore, metals and fuels in total exports for all available years between 1991 and 2007. Source: World Development Indicators, World Bank.
Openness
Sum of imports and exports divided by total GDP for all available years between1991 and 2007. Source: World Development Indicators, World Bank.
Human capital
C. Political Institutional Variables:
The following political institutional variables are taken from the data on political indices (DPI) of the World Bank (see Beck et al. 2001).
System
Codes:
Presidential 0 Assembly-elected President 1
Parliamentary 2
Systems with unelected executives get a 0. Systems with presidents who are elected directly or by an electoral college (whose only function is to elect the president), in cases where there is no prime minister, also receive a 0. In systems with both a prime minister (PM) and a president, the following factors are considered in order to categorize the system:
a) Veto power: president can veto legislation and the parliament needs a supermajority to override the veto.
b) Appoint prime minister: president can appoint and dismiss prime minister and/or other ministers.
c) Dissolve parliament: president can dissolve parliament and call for new elections.
d) Mentioning in sources: If the sources mention the president more often than the PM then this serves as an additional indicator to call the system presidential (Romania, Kyrgyzstan, Estonia, Yugoslavia).
The system is presidential if (a) is true, or if (b) and (c) are true. If no information or ambiguous information on (a), (b), (c), then (d). Countries in which the legislature elects the chief executive are parliamentary (2), with the following exception: if that assembly or group cannot easily recall him (if they need a 2/3 vote to impeach, or must dissolve themselves while forcing him out) then the system gets a 1.
Legislative Indices of Electoral Competitiveness (LIEC):
Codes:
No legislature 1
Unelected legislature 2
Elected, 1 candidate 3
1 party, multiple candidates 4 Multiple parties are legal but only one party won seats 5
Multiple parties DID win seats but the largest party received more than 75% of the seats
6
Appendix-II: List of sampled 48 LDCs across regions
Africa (33) Asia (14)* Latin American and
Caribbean (1)
Angola Benin Burkina Faso Burundi
Central African Republic Chad
Comoros
Congo, Dem. Rep. Djibouti Equatorial Guinea Eritrea Ethiopia Gambia, The Guinea Guinea-Bissau Lesotho Liberia Madagascar Malawi Mali Mauritania Mozambique Niger Rwanda Samoa Senegal Sierra Leone Somalia Sudan Tanzania Togo Uganda Zambia Afghanistan Bangladesh Bhutan Cambodia Kiribati Lao PDR Maldives Myanmar Nepal
Sao Tome and Principe Solomon Islands Timor-Leste Vanuatu Yemen, Rep.
Haiti
*Tuvalu has not been considered due to lack of sufficient data.
References:
Albuquerque, R., 2003. The composition of international capital flows: risk sharing through foreign direct investment. Journal of International Economics1 (2), 353–383.
Alfaro, L., Kalemli-Ozcan, S., Lolosovych, V., 2008. Why doesn’t capital flow from rich to poor countries? An empirical investigation. Review of Economics and Statistics 90 (2), 347–368. Anderson, T. W. and Cheng Hsiao. 1982. “Formulation and Estimation of Dynamic Models Using
Panel Data.” Journal of Econometrics 18(1): 47-82.
Arellano, Manuel and Olympia Bover. 1995. “Another Look at the Instrumental Variable Estimation of Error-Components Models.” Journal of Econometrics 68 (1): 29-51.
Arellano, Manuel and Stephen Bond. 1991. “Some Tests of Specification for Panel Data: Monte Carlo Evidence and an Application to Employment Equations.” Review of Economic Studies 58(2): 277-297
Baltagi, Badi H. 2005. Econometric Analysis of Panel Data, John Wiley and Sons, West Sussex. Barro, R., Lee, J., 2001. International data on educational attainment: updates and implications.
Oxford Economic Papers 53 (3), 541–563.
Beck, Thorsten, Clarke, G., Groff, A., Keefer, P. and Walsh, P., 2001. "New tools in comparative political economy: The Database of Political Institutions." 15:1, 165-176 (September), World Bank Economic Review.
Blundell, Richard and Stephen Bond, 1998. Initial Conditions and Moment Restrictions in Dynamic Panel Data Models, Journal of Econometrics 87, 115-143.
Blundell, Richard and Stephen Bond. 1998. “Initial Conditions and Moment Restrictions in Dynamic Panel Data Models.” Journal of Econometrics 87(1): 115-143.
Borensztein, E., Chamon, M., Jeanne, O., Mauro, P., Zettelmeyer, J., 2004. Sovereign Debt Structure for Crisis Prevention. IMF Occasional Paper 237,Washington DC.
Borensztein, E., De Gregorio, J., Lee, J., 1998. How does foreign direct investment affect economic growth? Journal of International Economics 45 (1),115–135.
Bruno, M., 1993. Foreword. In: Claessens, S., Gooptu, S. (Eds.), Portfolio Investment in Developing Countries. World Bank Discussion Papers, The World Bank.
Faria A. and P. Mauro, 2009. Journal of International Money and Finance, 28, 367–391
Feldstein, Martin and Charles Horioka. 1980. “Domestic savings and international capital flows”,
Economic Journal, 90: 314-29.
Hausmann, R., Ferna´ndez-Arias, E., 2000. Foreign Direct Investment: Good Cholesterol? Inter-American Development Bank Research Department Working Paper 416.
Hossain, Monzur. 2009a. “Institutional Development and the Choice of Exchange Rate Regime: A Cross-country Analysis”, Journal of the Japanese and International Economies (Elsevier; USA), Vol 23, No. 1, pp. 56-70.
Houthakker, H. S. and D. Taylor. 1970. Consumer Demand in the United States: Analyses and Projections, Harvard University Press, Cambridge, MA.
Judson, Ruth A. and Ann L. Owen, (1999). “Estimating Dynamic Panel Data Models: A Guide for Macroeconomists,” Economic Letters 65, 9-15.
Kaufmann, D., Kraay, A., Mastruzzi, M., 2006. Governance Matters V: Governance Indicators for1996–2005.World Bank Policy Research Working Paper 4012.
Krugman, P., 1979. “A Model of Balance-of-Payment Crises”, Journal of Money, Credit and Banking, 11, 311-325.
Lane, P., Milesi-Ferretti, G. M., 2001b. External capital structure: theory and evidence. In: Siebert, H. (Ed.), The World’s New Financial Landscape: Challenges for Economic Policy. Springer-Verlag.
Lane, P., Milesi-Ferretti, G.M., 2001a. The external wealth of nations: measures of foreign assets and liabilities for industrial and developing countries. Journal of International Economics 55 (2), 263–294.
Lane, P., Milesi-Ferretti, G.M., 2006. The External Wealth of Nations Mark II: Revised and Extended Estimates of Foreign Assets and Liabilities,1970–2004. IMF Working Paper 06/69.
Lothian,J.,2006. Institutions, capital flows, and financial integration. Journal of International Money and Finance25(3),358–369.
Markusen, J., 1997. Trade versus Investment Liberalization. NBER Working Paper 6231.
Montiel, P. 1993. “Capital mobility in developing countries”, PRE Paper 1103, Policy Research Department, World Bank
Nickell, Stephen (1981): Biases in Dynamic Models with Fixed Effects, Econometrica 49, 1417-1426. Obstfeld, Maurice. 1995. “International Capital Mobility in the 1990s”. In P.B. Kennen, ed.,
Salant, S. W. and Henderson, D. W., 1978. “Market anticipations of government policies and price of gold”, Journal of Political Economy, 86 (4), pp. 627-648.
Sargan, John D. 1958. “The Estimation of Economic Relationships using Instrumental Variables.” Econometrica 26 (3): 393-415.
Sarno, L. And M. P. Taylor, 1999. “Hot money, accounting labels and the permanence of capital flows to developing countries: an empirical investigation”, Journal of Development Economics, Vol. 59: 337-364.
Taylor, M. P. and L. Sarno, 1997. “Capital Flows to Developing Countries: Long- and Short-term Determinants”, The World Bank Review, 11 (3): 451-70
UNESCAP, 2000. Review of Implementation of the Programme of Action for the Least Developed Countries for the 1990s: Sub-regional Studies.
UNIDO, 2009. UNIDO Industrial Development Report, 2009
Wei, S. J., Wu, Y., 2002. Negative alchemy? Composition of capital flows, and currency crises. In: Edwards, S., Frankel, A. (Eds.), Preventing Currency Crises in Emerging Markets. The University of Chicago Press, pp. 461–506.
Wei, S.J., 2000a. How taxing is corruption on international investors? Review of Economics and Statistics 82 (1), 1–11.
Wei, S. J., 2000b. Local corruption and global capital flows. Brookings Papers on Economic Activity 2, 303–354.
Wei, S. J., 2001. Domestic crony capitalism and international fickle capital: is there a connection? International Finance 4(1), 15–45.