ISSN Online: 1937-688X ISSN Print: 1937-6871
Automatic Sleep Spindle Detection with EEG
Based on Complex Demodulation Method and
Decision Tree Model
Jiabin Li
1, Bei Wang
1, Takenao Sugi
2, Yu Zhang
1, Masatoshi Nakamura
31Department of Automation, East University of Science and Technology, Shanghai, China
2Department of Electrical and Electronic Engineering, Saga University, Saga, Japan
3Research Institute of Systems Control, Institute for Advanced Research and Education, Saga University, Saga, Japan
Email: [email protected]
Abstract
Sleep spindle is the characteristic waveform of electroencephalogram (EEG) which is important for clinical diagnosis. In this study, an automatic sleep spindle detection method was developed. The EEG signals were recorded based on the standard polysomnogram (PSG) measurement. A preprocessing procedure is introduced to exclude the unnecessary data segments and nor-malized the necessary data segments. Complex demodulation method is adopted to detect the candidate sleep spindle waveforms and calculate the features. The sleep spindles are recognized based on a decision tree model. Finally, the detected sleep spindles were utilized to amend the sleep stage rec-ognition results. The sleep EEG data from 3 patients with sleep disorders were analyzed. The obtained results showed that the detected sleep spindles in EEG signal improved the accuracy of sleep stage recognition.
Keywords
Sleep Spindle Detection, Complex Demodulation Method, Decision Tree Model, EEG
1. Introduction
Sleep is an important physiological activity of human being. According to R & K criteria [1], sleep is described with awake, non-rapid eye movement (NREM) and rapid eye movement (REM). NREM is further divided into four stages: Stage 1 (S1), Stage 2 (S2), Stage 3 (S3) and Stage 4 (S4). Sleep spindle is the characte-ristic waveform of sleep stage 2 [2]. It is a transient waveform with waxing- waning amplitude. The frequency of sleep spindle is about 12 - 14 Hz, and its How to cite this paper: Li, J.B., Wang, B.,
Sugi, T., Zhang, Y. and Nakamura, M. (2017) Automatic Sleep Spindle Detection with EEG Based on Complex Demodulation Method and Decision Tree Model. J. Bio-medical Science and Engineering, 10, 10-17.
https://doi.org/10.4236/jbise.2017.105B002
duration should be at least 0.5 seconds [1]. Sleep spindle is related to the inves-tigation of sleep [3]. In addition, the characters of spindle such as power [4] and density [5] are related to cognition and memory of human.
In clinics, qualified clinicians make visual inspection on sleep spindles [6]. Usually, variable shapes of waveform may appear in EEG (electroencephalo-gram). The inspection requires qualified skill and clinical experience. The visual inspection is rather laborious, time-consuming and subjective. In order to im-prove the efficiency of sleep spindle detection, several automatic methods had been developed including signal processing by time-frequency methods and de-cision making by thresholds or machine learning techniques. Time-frequency methods include Teager Energy Operator (TEO) [7], Continues Wavelet Trans-form (CWT) [8], and Matching Pursuit (MP) [9]. It is easy to obtain the energy of signal within a certain frequency band, but the result of TEO was sensitive to noise [10]. CWT can meet the time frequency resolution only if the “mother wavelet” is appropriate. MP is good at signal decomposition, but this advantage is based on the assumption that the “atom of dictionary” can well represent the signal components, which is difficult to promise in real data. In another hand, it is convenient to apply thresholds to detect sleep spindle. However, it largely de-pends on the experience of experts. Furthermore, it is difficult to account for all subjects [11]. Compared to the defined thresholds, machine learning techniques such as Support Vector Machine (SVM) or Artificial Neural Network (ANN) [12] are more objective. Though both SVM and ANN can well detect sleep spin-dle, they cannot describe the various shape of sleep spindle. Therefore, it is still necessary to develop the automatic method to detect sleep spindle, which can capture the transient signal, describe the characteristics and account for the va-riability.
In this paper, the complex demodulation method (CDM) and decision tree model are adopted to detect sleep spindle automatically. The sleep data of EEG were recorded based on PSG (polysomnogram) measurement. Firstly, the data segments are preliminarily analyzed to extract necessary segments from the con-tinuous sleep EEG recording. Secondly, according to the time-frequency charac-ter and instantaneity of sleep spindle, CDM is adopted to extract the candidate waveforms and calculate several features. A decision tree model is constructed based on a set of training samples. Final judgments were obtained for the test samples. Furthermore, the detected results were used to amend the sleep stage recognition of S2 to evaluate the validity of sleep spindle detection.
2. Method
2.1. Data Acquisition
ana-lyzed for sleep spindle detection recorded under a sampling rate of 100 Hz, with a high frequency cut off of 35 Hz and a time constant of 0.3s. The recorded data were segmented into 30-second epochs. The consecutive epochs were inspected according to R & K criteria by a qualified clinician.
2.2. Pre-Processing
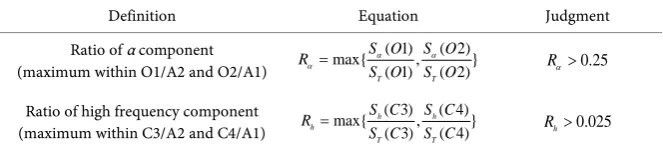
Sleep spindle is mainly related to light sleep. It is not necessary to analyze all the recorded data. There are two parameters calculated in Table 1. The ration of α component is calculated with EEG in O1/A2 and O2/A1 channels, high fre-quency component is in
C3/A2 and C4/A1 channels. If Rα is larger than 0.25 or Rh is larger than 0.025, the epoch is excluded for sleep spindle detection.
The remaining data is normalized by Z-score so that the difference of ampli-tude of EEG among subjects can be minimized. X0(n∆t) represents EEG signal and X(n∆t) represents the result of normalization,
0
( ) [ ( ) ] / .
X n t∆ = X n t∆ −µ δ (1)
In Equation (1), n = 1, 2,∙∙∙, N, μ and δ represents the average and the standard deviation of X0(n∆t).
2.3. Complex Demodulation
CDM is a time-frequency domain method of transient signal processing. The change of signal amplitude over time can be obtained as long as the frequency of the signal is given. A time series X(n∆t) can be represented as,
0
( ) ( ) * cos[ ( )].
X n t∆ =A n t∆ f n t∆ +P n t∆ (2)
In Equation (2), A(n∆t ) is a changing amplitude and P(n∆t) is a changing phase. A(n∆t) can be extracted as follows if the frequency f0 is known. Shift all the frequency in X(n∆t) by - f0,
0
( ) ( ) * 2 exp( ).
Y n t∆ =X n t∆ −if n t∆ (3)
Y(n∆t) in Equation (3) can also be represented as,
0
( ) ( ) *[exp( ( ))
exp( {2 ( )})].
Y n t A n t iP n t
i f n t P n t
∆ = ∆ ∆
+ − ∆ + ∆ (4) Let Y’(n∆t) be the complex signal when Y(n∆t) is passed through a low-pass filter,
( ) ( ) * exp[ ( )].
[image:3.595.207.539.652.729.2]Y n t′ ∆ =A n t∆ iP n t∆ (5)
Table 1. Parameters for pre-processing.
Definition Equation Judgment
Ratio of α component (maximum within O1/A2 and O2/A1)
( 1) ( 2)
max{ , }
( 1) ( 2)
T T
S O S O
R
S O S O
α α
α= Rα>0.25
Ratio of high frequency component (maximum within C3/A2 and C4/A1)
( 3) ( 4)
max{ , }
( 3) ( 4)
h h
h
T T
S C S C
R
S C S C
Therefore, A(n∆t) can be obtained as,
( ) ( ) .
A n t∆ = Y n t′ ∆ (6)
In this study, EEG signals in channel C3/A2 and C4/A1 were analyzed by CDM for every 30s epoch after pre-processing. X(n∆t) is the normalized EEG data. The instantaneous amplitude Aθ(n∆t) of θ wave (4 - 7 Hz), Aα(n∆t) of α wave (8 - 13 Hz), and Aspindle(n∆t) of spindle (12 - 14 Hz) are obtained when f0 in the above equations is set as 6 Hz, 10 Hz and 13 Hz correspondingly. Here, A spin-dle(n∆t) is the main information for candidate sleep spindle detection and feature calculation. Aθ(n∆t) and Aα(n∆t) are used as additional information for feature calculation.
According to the various of Aspindle(n∆t) with time, if the instantaneous am-plitude of one local maximum point with CDM is larger than 0.5 μv, a peak point tp is marked. The starting and ending points of t1 and t2 are the position of the nearest points from the left and right of tp whose instantaneous amplitude is smaller than half of Aspindle(tp). The corresponding EEG signal is selected as can-didate waveform.
2.4. Decision Tree Model
For the candidate waveform after CDM processing, four parameters in Table 2 are calculated. The parameter of peak is defined as the maximum instantaneous amplitude of candidate wave around 13 Hz, while slope is the average changing rate of the wave. R1is the average amplitude ratio of spindle and θ wave, while R2 the ratio of spindle and α wave.
A set of sleep spindles is adopted as the training data. The values of parame-ters are divided into 3 levels: “high”, “middle”, “low”. After training, a decision tree model is constructed to recognize the sleep spindle for the test data.
3. Results
3.1. Decision Tree Model
After pre-processing and CDM analysis, candidate sleep spindles were obtained. The 400 samples from 2 healthy subjects were adopted as the training data. The candidate waveforms detected form 3 patients were for test.
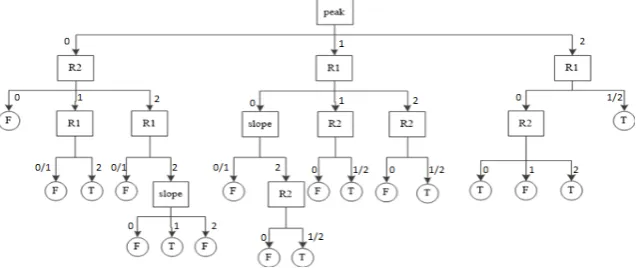
The obtained decision tree model was illustrated in Figure 1, square represents attribute node and circle represents leaf node while “T” means spin-dle and “F” means non-spinspin-dle. Label “0”, “1”, “2”, “0/1”, “1/2” correspond to
Table 2.Parameters for sleep spindle detection.
Definition Equation
Amplitude of tp peak = Aspindle(tp)
Slope of waveform slope = max{0.5peak/(tp − t1),0.5peak/(tp − t2)} Ratio of spindle and θ wave R1 = Ᾱspindle/Ᾱθ
Figure 1. Decision tree model for sleep spindle recognition.
level “low”, “middle”, “high”, “low or middle” and “middle or high”. According to the obtained model, it can be summarized that parameter of peak was the most important feature for sleep spindle detection and followed by R1, R2 and slope successively.
3.2. Sleep Spindle Detection
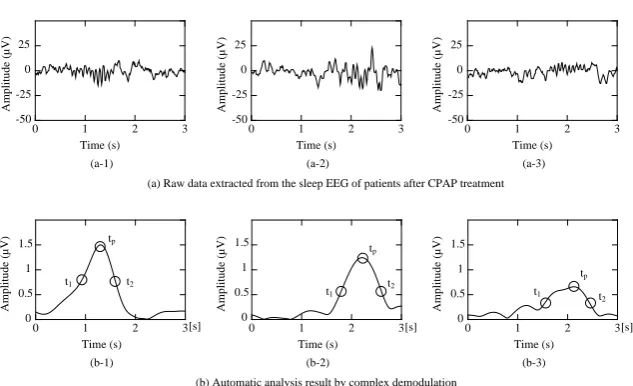
The process of automatic sleep spindle detection was shown in Figure 2. The raw EEG signals of three samples were illustrated in Figure 2(a). The sleep spin-dle in (a − 1) is quite clear to inspect. However, the sleep spinspin-dle in (a − 2) is a sleep spindle mixed with θ component (4 - 7 Hz), while (a − 3) is a sleep spindle with smaller amplitude. Figure 2(b) were the results of CDM, in which X-axis is time and Y-axis is Aspindle(n∆t). The Aspindle(n∆t) curves contain a peak, which means the amplitude of EEG signals around 13Hz went through the process of waxing and waning. The peak points tp, the starting points t1 and ending points t2 were marked by circles in Figure 2(b). Comparing the raw data and CDM re-sults, the obtained Aspindle(n∆t) curves indicated the trend of amplitude around frequency of sleep spindle clearly.
Parameters were calculated and evaluated according to Table 2. All the para-meters of standard sleep spindle in (a − 1) were “high”. The amplitude trend of signal around 13 Hz was obvious and the shape of the signal was concentrating. For sleep spindle in (a − 2), R1 was “low”, while other parameters were “high”. Although the shape of wave was less concentrating, it was considered as sleep spindle. For sleep spindle in (a − 3), its peak was “low” and slope was “middle”, while both R1 and R2 were “high”. The changing of amplitude was slower. How-ever, the shape of the wave was concentrating so that it was regarded as sleep spindle. In the sleep EEG data of patients, most of the shapes of sleep spindle may differ from the typical ones. The constructed decision tree model based on CDM analysis interpreted the sleep spindles in real cases.
3.3. Amendment to Sleep Stage 2
0 1 2 3 0
0.5 1 1.5
0 1 2 3
-50 -25 0 25
0 1 2 3 0 1 2 3
0 1 2 3 0 1 2 3
-50 -25 0 25 -50 -25 0 25 0 0.5 1 1.5 0 0.5 1 1.5 (a) Raw data extracted from the sleep EEG of patients after CPAP treatment
(b) Automatic analysis result by complex demodulation
A m p li tu d e (µ V )
[s] [s] [s]
(a-1) (a-2) (a-3)
(b-1) (b-2) (b-3)
tp
t1 t2
tp
t1 t2
tp
t1 t
2 A m p li tu d e (µ V ) A m p li tu d e (µ V )
Time (s) Time (s) Time (s)
Time (s) Time (s) Time (s)
[image:6.595.215.532.62.255.2]A m p li tu d e (µ V ) A m p li tu d e (µ V ) A m p li tu d e (µ V )
[image:6.595.205.540.312.395.2]Figure 2. Sleep EEG data analysis by complex demodulation for sleep spindle detection.
Table 3. Sleep spindle detection for sleep stage 2 recognition.
False-negative False-positive Accuracy
A B A B A B
Subject 1 130 15 38 0 73% ↑ 3%
Subject 2 157 101 89 0 63% ↑24%
Subject 3 67 34 73 0 81% ↑ 9%
characteristic waveforms. Due to the instantaneous character of the waveforms, it is rather difficult to extract valuable parameter which can be included into the feature vector for automatic sleep stage recognition algorithms. It would affect the recognition accuracy of S2 as well as the total accuracy. In this study, the ef-fectiveness of sleep spindle detection by using the presented method was eva-luated as amendment for S2.
In Table 3, “A” represented the automatic sleep stage recognition result while “B” showed the improvements by using automatic sleep spindle detection. For subject 1, there were 15 epochs can be amended for the false-negative epochs. The recognition accuracy improved from 73% to 76%. The same effectiveness can be observed from another two subjects from 63% to 87% and 81% to 90% respectively. In another hand, there were no epochs detected with sleep spindle for false-positive ones.
4. Discussion and Conclusions
In this study, CDM is adopted for the detection of candidate waveforms which has similar frequency characteristics with sleep spindle. A decision tree model is constructed according to the features calculated based CDM. The obtained model showed similar manner to the visual inspection which can be adaptive to the various shape of sleep spindles in real clinical data. The detection results in-creased the recognition accuracy of sleep stage 2 among the subjects. The devel-oped technique is useful for sleep spindle detection, which can also be combined with various sleep stage recognition method as an amendment tool.
Acknowledgements
This research was financially supported by the Medical Cooperation Project by Shanghai Municipal Science and Technology Commission 12DZ1940903, the Shanghai Natural Science Foundation under Grant 16ZR1407500.
References
[1] Rechtschaffen, A. and Kales, A.A. Manual of Standardized Terminology, Tech-niques and Scoring System for Sleep Stages of Human Subject., Allan Rechtschaffen & Anthony Kales.
[2] Andrillon, T., Nir, Y., Staba, R.J., Ferrarelli, F., Cirelli, L., Tononi, G., et al. (2011) Sleep Spindles in Humans: Insights from Intracranial EEG and Unit Recordings. The Journal of Neuroscience, 31, 17821-17834.
http://dx.doi.org/ 10.1523/JNEUROSCI.2604-11.2011
[3] Schabus, M., Dang-Vu, T.T., Heib, D.P.J., Boly, M., Desseilles, M., Vandewalle, G., et al. (2012) The Fate of Incoming Stimuli during NREM Sleep Is Determined by Spindles and The Phase of The Slow Oscillation. Frontiers in Neurology, 3, 1-11
http://dx.doi.org/10.3389/fneur.2012.00040
[4] Nishida, M. and Walker, M.P. (2007) Daytime Naps, Motor Memory Consolidation and Regionally Specific Sleep Spindles. The Public Library of Science One, 2, 1149-1156. http://dx.doi.org/10.1371/journal.pone.0000341
[5] Morin, A., Doyon, J., Dostie V., Barakat, M., Tahar, A.H., Korman, M. et al. (2008) Motor Sequence Learning Increases Sleep Spindles and Fast Frequencies in Post-training Sleep. Sleep, 31, 1149–1156
https://www.researchgate.net/publication/23182008
[6] Wallant, D.C., Maquet, P. and Phillips, C. (2016) Sleep Spindles an Electrographic Element: Description and Automatic Detection Methods. Neural Plasticity, 2016, 1-15. http://dx.doi.org/10.1155/2016/6783812
[7] Liang, S.F., Kuo, C.E., Hu, Y.H., Chen, C.Y. and Li, Y.H. (2012) An adaptive Neu-ro-fuzzy Inference System for Sleep Spindle Detection. Proceedings of 2012 Inter-national Conference on Fuzzy Theory and Its Applications, Taiwan,16-18 Novem-ber 2012, 369-373.
[8] Adamczyk, M., Genzel, L., Dresler, M., Steiger, A. and Friess, E. (2015) Automatic Sleep Spindle Detection and Genetic Influence Estimation Using Continuous Wavelet Transform. Frontiers in Human Neuroscience, 9, 624-642
http://dx.doi.org/10.3389/fnhum.2015.00624
[9] Ji, Z., Qin, S.R. and Peng, L.L. (2003) Using Matching Pursuit Algorithm to Analyze Electroencephalogram (EEG) Sleep Spindle in Time-frequency Domain. Journal of Shanghai Jiaotong University, 37, 1460-1463
[10] O'Toole, J.M., Temko, A. and Stevenson, N. (2014) Assessing Instantaneous Energy in the EEG: A Non-negative, Frequency-weighted Energy Operator. Proceedings of the 36th Annual International Conference of the IEEE EMBS, Chicago, 26-30 Au-gust 2014, 3288-3291. https://doi.org/10.1109/embc.2014.6944325
[11] Ray, L.B., Sockeel, S., Soon, M., Bore, A., Myhr, A., Stojanoski, B. et al. (2015) Ex-pert and Crowd-sourced Validation of An Individualized Sleep Spindle Detection Method Employing Complex Demodulation and Individualized Normalization. Frontiers in Human Neuroscience, 9, 1-16.
https://doi.org/10.3389/fnhum.2015.00507
[12] Ventouras, E.M., Monoyiou, E.A., Ktonas, P.Y., Paparrigopoulos, T., Dikeos, D.G., Uzunoglu, N.K., et al. (2005) Sleep Spindle Detection Using Artificial Neural Net-works Trained with Filtered Time-domain EEG: A Feasibility Study. Computer Methods and Programs in Biomedicine, 78, 191-207
http://dx.doi.org/10.1016/j.cmpb.2005.02.006
[13] Xiao, S.Y., Wang, B., Zhang, J., Zhang, Q.F. and Zou, J.Z. (2016) Automatic Sleep Stage Classification Based on an Improved K-means Clustering Algorithm. Journal of Biomedical Engineering, 33, 847-854
http://dx.doi.org/10.7507/1001-5515.20160137
Submit or recommend next manuscript to SCIRP and we will provide best service for you:
Accepting pre-submission inquiries through Email, Facebook, LinkedIn, Twitter, etc. A wide selection of journals (inclusive of 9 subjects, more than 200 journals)
Providing 24-hour high-quality service User-friendly online submission system Fair and swift peer-review system
Efficient typesetting and proofreading procedure
Display of the result of downloads and visits, as well as the number of cited articles Maximum dissemination of your research work