Effects Residence Time to Water Quality in Large
Water Distribution Systems
Hossein Shamsaei*, Othman Jaafar, Noor Ezlin Ahmad Basri Civil and Structural Engineering Department, Faculty of Engineering and Built Environment,
Universiti Kebangsaan Malaysia (UKM), Bangi, Malaysia
Email: *HosseinShamsaei@yahoo.com, oj@vlsi.eng.ukm.my, ezlin@vlsi.eng.ukm.my
Received November 10, 2012; revised February 20, 2013; accepted February 28,2013
Copyright © 2013 Hossein Shamsaei et al. This is an open access article distributed under the Creative Commons Attribution Li-cense, which permits unrestricted use, distribution, and reproduction in any medium, provided the original work is properly cited.
ABSTRACT
Systems that have big transmission line may have problem on changes of pressure in the distribution system. Because the increase in water age is dependent on the difference between the production and consumption rates, high residence time in pipes and storage duration in water tanks. The goal of this study is to analyze the effectsresidence time to water quality in large water distribution systems. According to the results in Ahwaz, bacterial growth (HPC) has a direct rela- tionship with water age, and changing rate of the bacterial growth (HPC) and the distance travelled and residence time have been caused to increase water age, bacterial growth (HPC), chlorine consumption and hydraulic change. So bacte- rial growth (HPC) doesn’t have any relationship with THMs and Tol Coli form, but has a reversed relationship with residual chlorine nearly.
Keywords: Water Age; Hydraulic Changes; Bacteria Growth; Chlorine;Residence Time and EPANET Model
1. Introduction
Human seek to drink clear water without bacteria. In ancient days, human societies have had ways for water treatment that were successful. However, nowadays, problems are still there on water supply especially on quality. Some of problems on quality and quantity may be addressed with new methods of design whereby defi- ciencies are removed and water quality improved. In the big distribution systems, the problem could affect water quality. As a result, the problems of quantity are basic agents in the decay of water quality in distribution sys- tems. Another effect is that of water age [1]. Water age could be due to over designs, especially during the initial phase of the project that has been designed for 20 - 30 years. Also, they could cause problems for water quality in the water utility. The water residence time in the sys- tems might be responsible for decay of water quality in the distribution system [1,2] and this could aid microor- ganism’s growth, thus causing undesirable effects on water quality and water beauty. Also the pressure of wa- ter supply in big transmission's line will be very difficult in all places. The effects of undesirable pressure in the water distribution according to [3], may include corro-
sion, presence of odor and taste, while low pressure could result in laminar flow and eventually lead to decay in water quality [3,4]. In addition, described low velocity when water distribution has high retention time and low demand also decreases water quality and increases bacte- ria growth. [5] did a study on MAP (Microbiologically Available Phosphorus) in drinking water and research on biofilm, residence time and bacteria growth. Residence time measurement can help to understand this lack of correlation between HPC and other parameters. The pre- vious results [6] showed that in spite of the slightly higher HPC bacterial densities measured in the network compared with treated water, the supply water can be re- garded as “biologically stable” even if free chlorine de- grades quickly. According to [7-9], a root cause for bac-teria growth is distance traveled in large transmission lines, and determined the problem to be very dangerous to human health. To describe chlorine concentration at different residence times in the network. As demon-strated by [10], in the distribution system [11], Big transmission lines have higher water age causing decay of water quality that facilitates bacterial growth in distri-bution systems. In- creased water age may also cause DBPs and corrosion of the distribution system.
H. SHAMSAEI ET AL. 450
and residence time have increased DBPs (disinfection by-products) pH. [13] did a study and said that systems with large transmission lines (distance traveled) with minimal chlorine concentration have increased bacterial growth. Residence Time seems to be different for each introducing a threshold value for the water residence times modified the order of the classification [14,15]. This stronger effect of re-chlorination observed for long residence times could be explained by the decrease of free residual chlorine added at treatment plant and which be- comes a limited factor for THM formation, especially when chlorine demand is important. Moreover, the con- figuration of the system (looped, branched) and the changes in water demand over the course of a single day can result in great variability in water residence times, even for a given point in the system. These variables in- clude the applied chlorine dose and the chlorine contact time at the treatment plant, water residence times and the location of the re-chlorination points.
N-Nitrosodimethylamine (NDMA) is a non-haloge- nated DBP [16]. Distribution system NDMA concen- trations varied and tended to increase with increasing dis- tribution residence time. NDMA distribution system con- centrations can be variable and when detected tend to increase with increasing distribution residence time. He reported that between the water treatment plant and cus- tomer there are changes of water quality in the distribu- tion system [17]. Long term residence time increases cor- rosion of piping and joints so the consequences of ab- sence of a carefully planned design could be the reason for biofilm growth and the decay of water quality in dis-tribution systems. They report chlorine concentration over distance travelled decreased and the decay of chlo- rine increased coli form growth in the distribution system and the impacts of water aging on distance traveled and in transit time, due to a lack of careful design, manage-ment and maintenance as well as changes in consumption patterns, the engineering designs project is planned twenty to thirty years into the future [18]. The lack of careful design thus gives cause for an increase in water aging. In the booklet they recommend that for higher water quality in distribution systems it is necessary to decrease water aging, improve water quality as well as the control of consumption patterns. Overall, one could say that their conclusion is that the main cause of poor water quality in distribution systems has been water aging. [19] did a study about analyses of the interactions of water resi-dence time with heterotrophic plate count (HPC), and these results have demonstrated the different influences of residence time in reservoirs and in pipes on bacterial water quality. In this context, travel of water in the pipes has no significant intumesce on HPC bacterial density; the supply water can be regarded as “biologically stable”.
However, the importance of regular reservoir and net-work maintenance is stressed. In spite of the “biological stability” of supply water, BDOC decrease vs. residence time was observed for high water temperatures.
The study by [20] evaluated the effects of chlorine and residence time on the presence of culture able bacteria in biofilms relative to that in bulk water. The results show- ed that when no chlorine residual was present in the sys-tem. The common notion that biofilms dominate the dis- tribution system is not true under all conditions. These findings suggest that bulk water bacteria may dominate in portions of a distribution system that have low chlo- rine residual.
A decrease in substrate concentration is expected to lower the concentration of both bulk water and biofilm bacteria. Because of the mass transfer limitations of sub- strate into the biofilm, one may expect a greater impact of decrease in substrate concentration on biofilm bacteria than on bulk water bacteria. However, the production of substrate within the biofilm could counteract this effect. The common notion that biofilm bacteria dominate the presence of bacteria in distribution systems is not true under all conditions. Results showed that the bulk-to- total bacteria ratio increased with increasing residence time, indicating that the fraction of culture able bacteria present in the bulk water increased as the residence time increased. The ratio decreased with increasing chlorine concentration, indicating that the bacteria in the biofilm dominate the system at higher chlorine residuals.
2. Materials and Methods
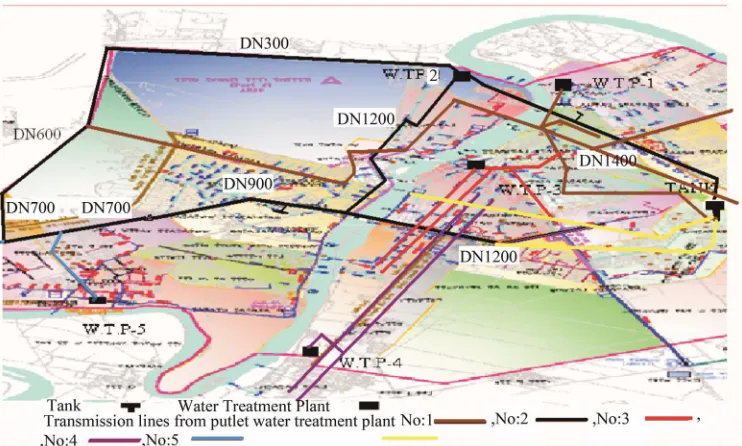
The zone to be considered is Ahwaz. Ahwaz city is at the center of the province of Keaston, as shown Figure 1 it is located in south west of IRAN. Ahwaz is situated on a wide expanse of land of about 17000 hectares, and with population of about 1,300,000. The Karoon River which passes through the central part of Ahwaz is also shared by both the eastern and western parts. The Karoon is the only source of water supply for Ahwaz. Ahwaz has five water treatment plants. Two of the plants are major ones while the rest are just minors. Situation the reservoirs in Ahwaz. The outside diameter the reservoirs piping is 1200 and 900 mm, and also during period of high con- sumption (at 11 am until 2 pm) much of the water is stored in the reservoirs. Also, Figure 1 shows situation outlet of transmission line and situation the reservoirs in Ahwaz.
Figure 1. The map showing outlet from water treatment plants and outlet reservoir in Ahwaz.
3.2. The Relationship between HPC and Flow
consumption peak, this means, between to 8 am, 11 am to 15 pm and 19 pm to 22 pm. Also, the minimum con- sumption time; this means, at 8 am to 11 am, between 15 pm to 19 pm and 22 pm to 5 am. Samples were taken over a period of 60 days (8 weeks) and 450 samples were taken over this period in Ahwaz i.e. 6 (six) times at five locations. Tests conducted in the areas where major dete- rioration which have affected the quality of water in dis-tribution network system included HPC, pressure, veloc- ity, THMs, Total Coli-from, residual Chlorine, Kw and Kb.
Figure 3 shows the relationship between HPC and flow
rate in the water distribution network of Ahwaz. When the flow rate decreases the residence time will become higher and resulted in the system having high HPC. Changing HPC between the points A1 to A5 was high, and according to Table 2 the presence of HPC at off peak flow have been much than peak flow, and HPC in- creased with the distance travelled and residence time of water in distribution system. Figure 3 shows the rela- tionship between HPC and flow rate in the water distri- bution network of Ahwaz. As the flow rate decreases at the end of the system, the HPC markedly increased.
3. Result
Some qualitative and quantitative parameters will be con- sidered and a comparative study will be undertaken, this will include local sampling and some laboratory activi- ties and the results will be obtained with the help of analysis involving the use of EPANET model. Tables 1
and 2 showed parameters changing according to local sampling and some laboratory activities in Ahwaz region, a five-point sampling was performed for each water treatment plant namely points between the points A1 to A5. With the distance travelled and residence time of water in distribution system in Ahwaz.
3.3. The Relationship between THMs and Flow
Figure 4 shows the relationship between flow rate and
THMs in water distribution networks in different parts of the city of Ahwaz. It can be seen that the THMs has changed. The maximum flow rate due to average con- sumption has been 1.06 m3/s at A1, and the minimum flow rate was 0.09 m3/s at A5. The maximum level of the THMs on average consumption was 169 (µg/l) at A2, and the minimum level was 121 (µg/l) at A4.
3.4. The Amount of Residual Chlorine 3.1. HPC (Heterotrophic Plate Count)
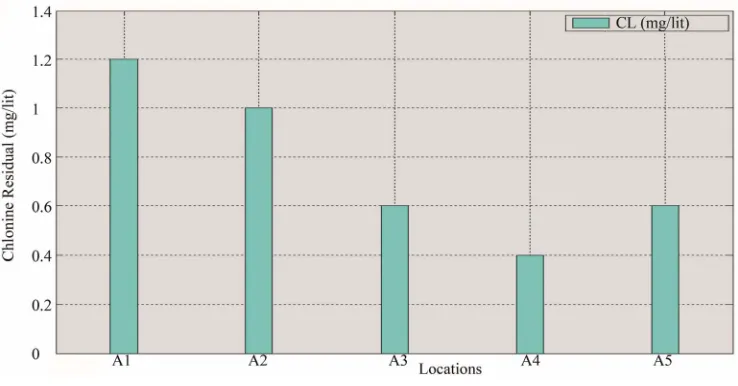
Figure 5 shows the level of residual chlorine changes in Ahwaz, the maximum amount of residual chlorine at A1 was 1.2 mg/l, and the minimum amount at A4 was 0.4 mg/l. However at point A5 which is further away the concentration of residual chlorine was apparently higher than at point A4. The result of EPANET model of
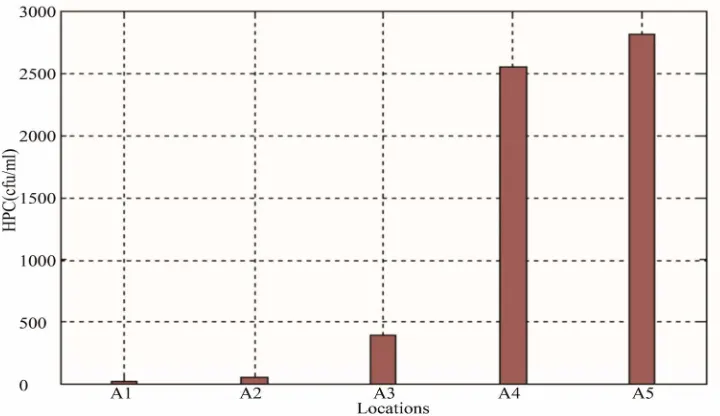
Figure 2 shows the HPC of water distribution networks
in Ahwaz. The level of HPC has also increased along the way. The changes in the level of pressure have been from A1 to A5. The maximum HPC has been recorded at 2820 (cfu/ml) at A5 and the minimum HPC was 15.7 (cfu/ml)
H. SHAMSAEI ET AL. 452
[image:4.595.113.481.96.504.2]Figure 2. HPC at various locations in Ahwaz.
Figure 3. The relationship between HPC and Flow rate in Ahwaz.
[image:4.595.114.482.525.717.2]Figure 5. Residual chlorine at various locations in Ahwaz.
Table 1. Information of in the water distribution system in Ahwaz with due attention to locations in Ahwaz.
PART (cfu/ml) HPC (mg/l) CL m P m/s^2 V THMS µg/l Total Coliform MPN/100 ml 1/day Kb 1/day Kw m^3/s Q
A1 15.7 1.2 58 2.65 120 0 0.3 0.3 1.06
A2 57 1 45 1.45 169 3 0.33 0.4 0.44
A3 390.5 0.6 20 1.2 142 2 0.33 0.46 0.29
A4 2552 0.4 10 0.6 121 1 0.38 0.6 0.20
[image:5.595.60.539.453.561.2]A5 2820 0.6 0 0.3 131 2 0.34 0.4 0.09
Table 2. Information Of peak maximum and peak minimum with due attention to locations in Ahwaz.
Peak Flow (5 - 8, 11 - 15, 19 - 22) Peak Off (8 - 11, 15 - 19, 22 - 5)
A1 A2 A3 A4 A5 A1 A2 A3 A4 A5
CL(mg/l) 1.2 1 0.6 0.6 0.4 1.1 1 0.7 0.6 0.5
Turbidity (NTU) 5.38 5.48 3.95 1.8 2.37 5 5.1 3.1 1.2 2.5
HPC (cfu/ml) 19.6 55 261 1721 2560 23.4 89 650 3250 3970
Pressure (m) 58 30 15 15 10 58 35 20 20 10
changes in the amount of residual chlorine in the water network of Ahwaz shows that the residual chlorine was too high in most part of the water network in Ahwaz. Its value was less than 0.2 (mg/l) in only 40 out of 334 nodes in the water distribution network of Ahvaz. There mostly occur at lower part or the dead end points of the route. However, in most other places, the amount of re- sidual chlorine was high which means the chlorine has not been spent within the network. One of the important reasons was probably the low water movement in the network. Figure 6 showed the amount of residual chlo- rine at the peak off (1am) time at different points in the network .It should that the level of chlorine were low in most parts of lower part or the dead end points.
3.5. Determination of Water Age in Ahwaz
Figure 7 which showed water age in Ahwaz system in
the distribution system at peak flow (8 am). This figure shows according to high consumption at peak flow, the some parts of system that was very far from water treat- ment plant water age was 48 hours more. Figure 4-54
H. SHAMSAEI ET AL. 454
[image:6.595.160.435.294.488.2]Figure 6. Residual chlorine at the peak off (1am) in Ahwaz.
Figure 7. Water age at off peak flow (1am) in Ahwaz.
system that are end dead), but water age was high.
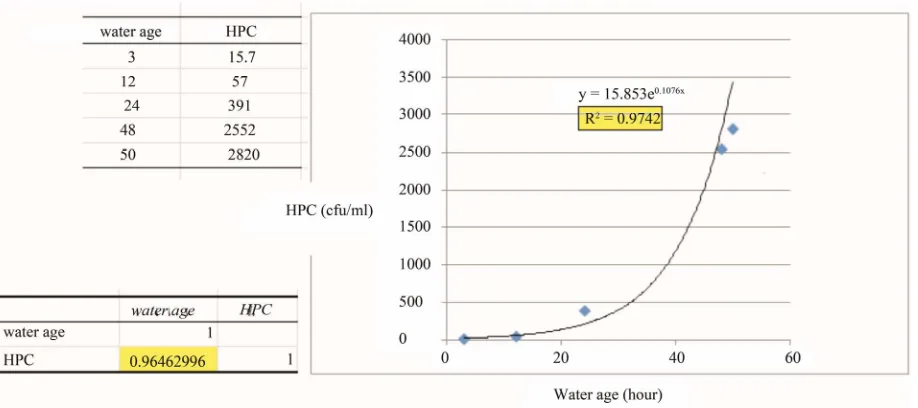
Figure 8 shows relationship between HPC and water
age. The Figure showed bacterial growth (HPC) has a di- rect relationship with water age, distance travelled and high residence time in the distribution systems. The re- sults of the function showed that increasing water age in Ahwaz system have been increasing HPC. Another of the factor that could cause increasing HPC in Ahwaz system was high hydraulic changes.
4. Conclusions
1) Bacterial growth (HPC) has a direct relationship with water age, and changing rate of the bacterial growth (HPC).
2) The distance travelled and residence time have been causing to increase water age, bacterial growth (HPC), chlorine consumption and hydraulic change in water dis- tribution system in Ahwaz.
3) Velocity and pressure has a reversed relationship with bacterial growth (HPC), Hydraulic change has been causing to increase bacterial growth (HPC).
4) Bacterial growth (HPC) has a reversed relationship with residual chlorine nearly.
5) Bacterial growth (HPC) hasn’t any relationship with THMs and Tol Coli form.
6) Velocity and pressure has a direct relationship with residual chlorine. Hydraulic change has been causing to increase chlorine consumption more.
5. Discussion
5.1. Water Age
Figure 8. The correlation and regression between HPC and water age in Ahwaz system.
physical and biological problems in the water distribution system and furthermore [22] observed that water age may be responsible for by-products in the distribution systems. Due to high flow rate and chlorine levels in the system, it may also increase the THMs in the water dis- tribution system in Ahwaz. Increasing THMs could cause many parameters. Some of them are high flow, disinfec-tion materials, level disinfecdisinfec-tion and water age. Water age in the system of Ahwaz has been more than 48 hours. Bearing in mind that water age and high flow has been a major factor for bacterial growth and THMs in the dis- tribution system in Ahwaz. Considering and compareing the activities of these factors in both systems. High water age and high flow could cause for increasing THMs and HPC in water distribution system in Ahwaz.
5.2. HPC (Heterotrophic Plate Count)
Storage and distribution systems that have big water transmission line, coupled with high residence time due to the distance travelled tend to encourage bacterial growth and thus posses high HPC. Bacterial growth HPC has led to deterioration of water quality in the distribu- tion system. According to the comparison of Ahwaz sys- tem, the maximum amount of HPC has been over 2880 (cfu/ml) in Ahvaz. [23] reports that high residence time and temperature have aided in increasing HPC. [24] sug- gests that at the dead end of the system growth of bac- teria have been more. In this respect the comparison of Ahwaz system showed the maximum amount of growth of bacterial HPC has been at the dead end. It was ob- served that at those location, the amount of residual chlo- rine were between 0.4 to 0.6 (mg/l) this showed that while growth of bacterial HPC has increased, chlorine consumption have been low. A possible reason for this
phenomenon was the velocity at those points have been low, chlorine didn’t affect bacterial HPC phenomenon these location. This obstruction is similar of these by [18] that there was no relationship between residual chlorine and HPC. According to the review of the case study of Ahwaz, increased HPC may have been due to changes in hydraulic and high residence time in the distribution sys- tem. From the study conducted by [25], it was suggested that HPC growth had been depending on water age and high residence time in the distribution system. Because according to the comparison of water distribution net- works of Ahwaz. The difference between water age and high residence time has been the cause of bacterial growth in the distribution system.
5.3. Chlorine Residual
H. SHAMSAEI ET AL. 456
increasing. The effect of high residual chlorine, volume and high flow led to increased DBPs (THMs) in the dis- tribution system.
5.4. THMs (Trihalomethanes)
Another problem in distribution systems with big trans- mission system, (such as the water network system in Ahvaz), is high production of disinfectant by product (DBPs). This might be the reason why there is high volume flow and disinfectants (free chlorine) in the net- works and distribution systems. In addition, with the re- sults of the water network system of Ahwaz, there has not been any connection between the rate of THMs and the water age. Rate of THMs has been fluctuating in the water distribution network system in Ahvaz. And the maximum value of THMs was at the beginning of the network of Ahwaz. [12] suggested that the amount of THMs has increased along the way, when the residual chlorine level was zero, Because according to the water distribution networks of Ahwaz, the minimum residual chlorine has been 0.4 mg/l on all points in the water dis- tribution system, and the value at the output of the water treatment plant was 1.2 mg/l, but THMs have been in- creasing in the distribution system of Ahwaz. It is also established that increase in THMs depends on the dis- tance travelled and residence time in the water distribu- tion system, but this result could be challenged, because, the value of THMs has increased through the points in distribution system. [26] noted that even if the amount of residual chlorine in the system were above 0.7 mg/l, the reduction in THMs was not achieved. According to the results of residual chlorine in the system, it has not been effective in decreasing THMs in the distribution system of Ahvaz. However, the main parameter has been high flow to increase THMs in the distribution system of Ah- waz.
6. Acknowledgements
First and foremost, I am very grateful to my supervisor Ir. Dr. Othman Jaafar who supported me all the time dur- ing the project. I would also to thank Dr. Noor Ezlin Ah- mad Basri for endless support and encouragement dur- ing my study.
REFERENCES
[1] EPA, “Health Risks from Microbial Growth and Biofilms in Drinking Water Distribution Systems,” Office of Water
(4601M) Office of Ground Water and Drinking Water Distribution System White Paper 3-10, US Environmental Protection Agency, 2002.
[2] M. J. Lehtola, et al., “The Effects of Changing Water Flow Velocity on the Formation of Biofilms and Water Quality in Pilot Distribution System Consisting of Copper or Poly-
ethylene Pipes,” Water Research, Vol. 40, No. 11, 2006, pp. 2151-2160. doi:10.1016/j.watres.2006.04.010
[3] J. Castorina and V. Jegatheesan, “Corrosion Impact on Drinking Water Distribution Systems: A Review and Fu- ture Research Direction,” Proceedings of the 1st Young Water Professionals, 2012.
[4] Research, U.S.E.P.A.O.o., “Control of Biofilm Growth in Drinking Water Distribution Systems,” Office of Re-search and Development, 1992.
[5] M. Lehtola, “Microbially Available Phosphorus in Drink-ing Water,” National Public Health Institute, 2002.
[6] J. T. O’Connor and T. O’Connor, “Water Quality Dete- rioration in Distribution Systems,” ASCE, 2000.
[7] K. Gotoh, “Residual Chlorine Concentration Decreasing Rate Coefficients for Various Pipe Materials,” Water Sup- ply, Vol. 7, No. 2-3, 1988, pp. 17-18.
[8] W. Sharp, P. J. and M. Morgan, “In-Situ Chlorine Decay Rate Testing,” Proceedings of Water quality Modeling in Distribution Systems, Cincinnati, 1991, pp. 225-236 [9] W. Lu, L. Kiéné and Y. Lévi, “Chlorine Demand of Bio-
films in Water Distribution Systems,” Water Research, Vol. 33, No. 3, 1999, pp. 827-835.
doi:10.1016/S0043-1354(98)00229-2
[10] L. Kiéné, W. Lu and Y. Levi, “Relative Importance of Phenomena Responsible of the Chlorine Consumption in Drinking Water Distribution Systems,” Proceedings of WQTC AWWA, 1996.
[11] A. J. Whelton, et al., “Minerals in Drinking Water: Im- pacts on Taste and Importance to Consumer Health,” Wa- ter Science & Technology, Vol. 55, No. 5, 2007, pp. 283- 291. doi:10.2166/wst.2007.190
[12] De Boer and E. Delvin, “Fate of Disinfectants and Disin- fection By-Products in Water Distribution Systems,” Re- port for 2005SD38B, South Dakota State University, 2006, pp. 3-8.
[13] A. Al-Jasser, “Chlorine Decay in Drinking-Water Trans- mission and Distribution Systems: Pipe Service Age Ef- fect,” Water Research, Vol. 41, No. 2, 2007, pp. 387-396. doi:10.1016/j.watres.2006.08.032
[14] F. J. Bove, et al., “Public Drinking Water Contamination and Birth Outcomes,” American Journal of Epidemiology, Vol. 141, No. 9, 1995, pp. 850-862.
[15] K. P. Cantor, et al., “Drinking Water Source and Chlori- nation Byproducts I. Risk of Bladder Cancer,” Epidemi- ology, Vol. 9, No. 1, 1998, pp. 21-28.
doi:10.1097/00001648-199801000-00007
[16] J. W. A. Charrois and S. E. Hrudey, “Breakpoint Chlori- nation and Free-Chlorine Contact Time: Implications for Drinking Water N-Nitrosodimethylamine Concentrations,”
Water Research, Vol. 41, No. 3, 2007, pp. 674-682. doi:10.1016/j.watres.2006.07.031
[17] B. A. J. Källén and E. Robert, “Drinking Water Chlorina- tion and Delivery Outcome—A Registry-Based Study in Sweden,” Reproductive Toxicology, Vol. 14, No. 4, 2000, pp. 303-309. doi:10.1016/S0890-6238(00)00086-1
Paola. “Health Risk Analysis of the Rio de Janeiro Water Suly Using Geographical Information Systems,” Dept. of Health Information, Fundação Oswaldo Cruz (Dis/Cict/ Fiocru, 2002.
[19] A. Kerneïs, et al., “The Effects of Water Residence Time on the Biological Quality in a Distribution Network,”
Water Research, Vol. 29, No. 7, 1995, pp. 1719-1727. doi:10.1016/0043-1354(94)00323-Y
[20] S. Srinivasan, et al., “Factors Affecting Bulk to Total Bacteria Ratio in Drinking Water Distribution Systems,”
Water Research, Vol. 42, No. 13, 2008, pp. 3393-3404. doi:10.1016/j.watres.2008.04.025
[21] EPA “Effects of Water Age on Distribution System Water Quality,” Office of Water (4601M) Office of Ground Wa- ter and Drinking Water Distribution System Issue Paper, US Environmental Protection Agency, 2004, pp. 1-9.
[22] Buligame,Gary,.Camper,Anne,.Kirmeyer,Gregory,. LeChevallier, Mark,.Parekh,Pankaj,. Smith, Charlotte, & Associates. “Distribution System Water Quality Strategic
Imitative Plan,” AWWA Research Foundation, Denver, 2007.
[23] E. Delahaye, B. Welté, Y. Levi, G. Leblon and A. Mon-tiel, “An ATP-Based Method for Monitoring the Micro- biological Drinking Water Quality in a Distribution Net- work,” Water Research, Vol. 37, No. 15, 2003, pp. 3689- 3696. doi:10.1016/S0043-1354(03)00288-4
[24] T. L. O. Connor and J. T. O. Connor, “Water Quality Deterioration in Distribution Systems. Part 2: Microbial Processes in Distribution Mains,” 1999.
[25] S. Ndiongue, P. Huck and R. Slawson, “Effects of Tem- perature and Biodegradable Organic Matter on Control of Biofilms by Free Chlorine in a Model Drinking Water Distribution System,” Water Research, Vol. 39, No. 6, 2005, pp. 953-964. doi:10.1016/j.watres.2004.12.019