In silico tests on sequence motif significances for human
tissue specific genes
*
Xiujun Gong, Hualin Xu
School of Computer Science and Technology, Tianjin University, Tianjin, China Email: gongxj@tju.edu.cn, lin_snowing@yahoo.com.cn
Received 13 February 2013; revised 3 April 2013; accepted 9 May 2013
Copyright © 2013 Xiujun Gong, Hualin Xu. This is an open access article distributed under the Creative Commons Attribution Li-cense, which permits unrestricted use, distribution, and reproduction in any medium, provided the original work is properly cited.
ABSTRACT
Identification and analysis of tissue-specific (TS) genes and their regulatory activities play an important role in understanding the mechanisms of the organism, disease diagnosis and drug design. Although so far we are not clear about the mechanisms totally, the se- quence features of TS genes are becoming an impor- tant clue. In this paper we used an integrated pipeline to discover sequences motifs for the promoter regions of TS genes. To test the significances of those motifs in a specific tissue, we used hypotheses test approaches including Bayesian hypothesis, Binomial distribution and traditional z-test. We finally got 2784, 1204 and 703 motifs respectively out of 3244 motifs obtained in discovery phase using above three tests from 3954 TS genes across 83 human tissues. 52.7% of those motifs can be found in public databases available.
Keywords:Tissue Specific Genes; Hypothesis Test;
Tissue Rich Motif; Tissue Even Motif
1. INTRODUCTION
Identification and analysis of tissue-specific (TS) genes and their regulatory activities play an important role in understanding mechanisms of the organism, disease di- agnosis and drug design [1]. In last years, many research projects were performed to study expressions and regu- latory mechanisms of TS genes including transcription factor and their binding sites, sequence features of pro- moter regions [2], alternative splicing [3] and Epigenet-ics features [4] of those genes.
Although until now we are not completely clear about the mechanisms of the gene tissue specificity, the sequence features of TS genes are becoming an
impor-tant clue [2]. P. FitzGerald et al. calculated the statistics of Simple Sequence Repeats (SSR) and identified that the SSR could be an important factor to the tissue speci-ficity [5]. F. Song et al. pointed that methylation changes during development are dynamic, involve demethylation and methylation, and may occur at late stages of embry-onic development or even postnatally using mouse ge-nome data [6]. C. Heber et al. showed that Nucleosome rotational setting is associated with transcriptional regu-lation in promoters of tissue-specific human genes [4].
With the completion of the whole human genome pro- ject, various algorithms have been developed for discov- ering patterns or motifs of huge volume genome se- quences. Those typical algorithms include three phases: motif searching, redundant motif pruning and motif sig- nificance testing. The methods for motif discovery may be grouped into two categories [7]: enumerative methods and alignment-based methods. Enumerative methods ty- pically involve exhaustive enumeration of words up to some maximum size in a dataset, and are thus best suited to consensus sequence motif models, like Consensus, PROJECTION, PDEM. Alignment methods take on a wide variety of forms, but often involve the development of a probabilistic model of the observed sequence data and optimization to find motifs common to all input se- quences, such as MEME [8] program, the expectation- maximization (EM) algorithm and Gibbs sampling [9]. Each algorithm has its unique advantage on individual species or datasets. Tompa et al. [7] conducted a study that compares the performance of 13 different motif finders by using a variety of real and synthetic sequence sets covering a range of genomes. A common practice is to apply several such algorithms simultaneously to im- prove coverage at the cost of increased redundancy [10].
In this paper, we first applied an integrated motif searching approach to find motifs for TS genes. As we known, it is the first time to search sequence motifs for tissue specific genes. Then we merged the similar motifs using the method in literature [7]. To test the signifi-
*This work is partly supported by the Natural Science Funding of
cances of those motifs in each tissue, we used three hy- pothesis test methods: Bayesian hypothesis, Binomial dis- tribution and traditional z-test. We also distinguish two kinds of significant motifs: tissue rich motifs (TIM) and tissue even motifs (TEM). The former refer to motifs only showing significance in few tissues, and the later refer to motifs in most of the tissues. We finally got 2784, 1204 and 703 motifs respectively out of 3244 motifs ob- tained in discovery phase using above three tests from 3954 TS genes across 83 human tissues. 52.7% those motifs can be found available in databases public.
2. METHOD
2.1. Date Preparing
Tissue specific genes were obtained mainly by querying the tissue specific gene expression database TiGER [11] against the tissue names. Some of them came from Tis- GED [12] database. All of the TS genes with PubMed IDs were used in the experiment. We finally got 3954 human tissue specific genes across 83 human tissues. The gene’s promoter sequences are downloaded from DBTSS [13] and EPD [14]. The promoter region with 1500 bp (−499 bp - 1000 bp around TSS) length is used for motif searching.
2.2. Motif Searching
2.2.1. Motif Searching
In this phase, we integrated three motif searching pro- grams: MEME, AlignACE and Gibbs Sampler. The length of candidate motifs is fixed to 6 - 12 bp, other parameters as the default setting. In this phase, we get 6794 motifs.
2.2.2. PWM Representations of Motifs
Since different motif search programs have their own motif formats as outputs, we have to define a uniform format for motifs to compare their similarities in motif merging phase. A common used representation is the Po- sition Specific Weight Matrix (PWM or PSWM) [15], which is a matrix of nucleotide frequencies in each posi- tion of the motif (i.e. the frequencies of the nucleotides A, C, G and T in each position). We transformed all the mo- tifs to the PWM representation.
2.2.3. Motif Merging
In motif merging phase, we used the method similar with in literature [16] to remove motif redundancies. Because this step isn’t the emphasis of this paper, we skip the details of the merging process. After motif merging, 3244 motifs were obtained.
2.3. Motif Tissue Significance Testing
To identify whether a motif is really related with tissue
specificity or not, we statistically distinguish two kinds of motifs: tissue rich motifs (TRM) and tissue even mo- tifs (TEM). The former refer to motifs only showing statics significance in less than 3 tissues, and the later refer to motifs in more than 70 tissues. We used hypothe- sis approaches to test the significance of motifs in each tissue. To do the hypothesis test, the distributions of mo-tifs in a given sequence must be estimated. Therefore, a key step is to calculate the statistic of a motif in a given sequence.
For a given motif m with length w from tissue T0, in
which the motif is discovered, our purpose is to judge whether its occurrence in tissue T1 is significant or not.
Therefore we have to take a measure on the motif occur-rences. Based on the requirements of different hypothesis tests, we applied scoring schemas.
Definition 1: for a given motif m, its matching Score with a Promoter sequence segment x of the gene from tissue T1PMS1 is defined:
1
1 , w ,
i
PMS m x s m x i
where s m i x i
,
is the score between m and x in position i, which can be calculated through the PWM of the motif.Definition 2: for a given motif m, its matching Score with a Promoter Sequence S of the gene from tissue T1
PSS1 is defined:
1
1
1 , n 1 ,
i
PSS m s PMS m s i
n
where s i
with PMS1 more than a predefined thresh-old is a segment of S by sliding a widow with length w, n is the number of s i
.PSS1 is used in classical z-test and binomial test. Definition 3: for a given motif m, its matching Score with a Promoter sequence segMent x of the gene from tissue T1PMS2 is defined [16]:
Current Min2 ,
Max Min
PMS m x
,
where
,1
Current w i B
i I i f
,
min1
Min w i
i I i f
,
max 1w i i
Max I i f
.
,
i B
f is the frequency of residue B at position i, which
is from PWM; min max
i i
f f is the smallest/largest fre-quency of the residue at position i and
,
{ , , , }
ln 4
i B i B
B A T G C
,
I i f
f describe the informationcontent of residue B at position i.
PSS2 is defined:
1
2 , n 2 ,
i
PSS m s PMS m s i
where s i
with PMS2 more than a predefined thresh-old is a segment of S by sliding a widow with length w, n is the number of s i
.PSS2 is used in Bayesian hypothesis test.
2.3.1. Classical Z-Test
In the classical z-test, we estimated the mean and vari-ance of the match score PSS1 in tissue T1, and then
cal-culated the z-value:
0 1 PSS z n .
where 0 and are the mean and variance of the
PSS1 in tissue T0.
In the experiment, we set the confidence degree 0.05.
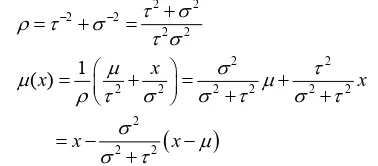
2.3.2. Bayes Hypothesis Test
Assumed that the PSS2 of a motif at tissue T0 follows a
Gaussian distribution
2 0, 0N
. To test that whether the motif is significant at tissue T1, we constructed twohypothesizes as the followings:
0: 0 1, 1: 0 1
H x H x
where x1 is the mean of PSS2 in tissue T1.
Assumed that X ~N
, 2
, where is unknownand 2 is known, π
~N
, 2
, where both and 2 are known. The post distribution of is
fol-lowed N
x ,1
according [16], where
2 2 2 2
2 2
2 2
2 2 2 2 2 2
2 2 2
1
( )x x x
x x (1 )
2.3.3. Binomial Distribution Test
In Binomial distribution test, instead of PSS1 value, we need the number of matches between the motif and the promoter sequence of a gene. A match between a motif and a sequence is defined if the PMS1 of the motif with a segment of the sequence is larger than a predefined value. We counted all the matches in tissue T0 and T1,
repre-sented the numbers of matches by K0 and K1 respectively.
The Binomial distribution test is to seek a value K-value holding:
01 0 -value 1 0 0 0 1 K K
n m n m
m m
m m
n n
p p p p
m m
where n0 and n1 are the numbers of promoter sequences
in tissue T0 and T1 respectively and p is fixed to 0.5 in
the experiment.
3. RESULT
3.1. Data Sources
The gene expression datasets, such as GNF, SAGE, and EST, are very widely used as data sources for the identi-fications of TS genes. However, because of the noise in expression datasets and human involvement in defining thresholds, the reliability of the identifications is often not high. In this paper, we use the specific genes ob- tained mainly by querying the tissue specific gene ex-pression database TiGER against the tissue names. Some of them came from TisGED database. All of the TS genes with PubMed IDs were used in the experiment. We obtained 3954 TS genes across 83 human tissues. Be-cause of the limitation of page size, the gene lists for all the tissues are available on request to the authors.
The gene’s promoter sequences were downloaded from DBTSS and EPD. The promoter region with length 1500 bp (−499 bp - 1000 bp around TSS) is used for mo-tif discovery.
3.2. Motifs Discovered by Three Test Methods
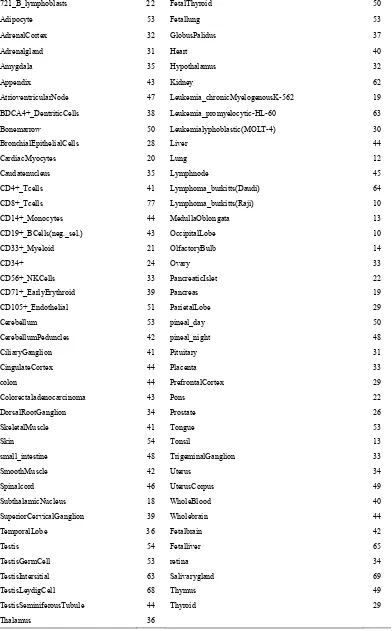
After merging phase, we get total 3244 motifs. The number of motifs in each tissue is shown in Table 1.
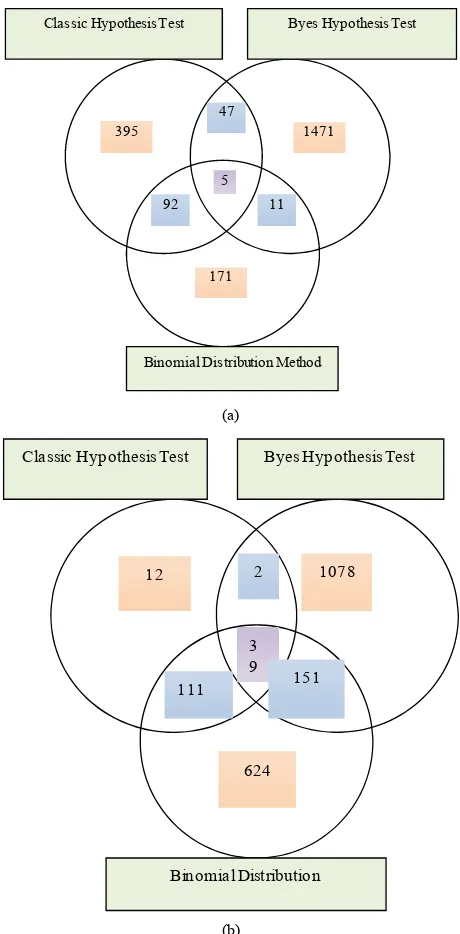
With Bayes Hypothesis Test method, we get 1534 TRMs and 1270 TEMs. With Classic z-test method, 539 TRMs and 164 TEMs are obtained. With Binomial Dis-tribution test method, the numbers of two kinds of motifs are 270 and 925 respectively. For the details, see in Fig-ures 1 and 2.
3.3. Overlap Motifs in Three Test Methods
In all the TRMs, 5 TRMs are covered by three methods, 150 TRMs are covered by two methods. In all the TEMs, 39 TEMs covered by three methods, 264 TEMs covered by two methods. For the details, see Figure 3.
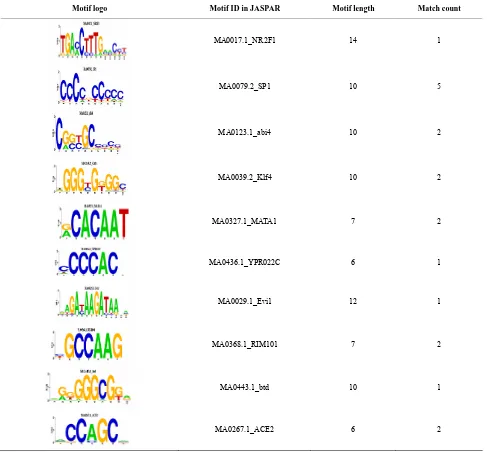
We also compared the overlapped 5 TRMs and 39 TEMotif with JASPAR [17]. 4 TRMs (see Table 2) out
of 5 TRMs are found in the JASPAR. For an example, [CCCCNCCCCC] is a motif which was discovered by previous researches in JASPAR ID MA0079.2_SP1, and [GGGGAATCCCC] with JASPAR ID MA0105.1_ NFKB1. 19 TEMs out of 39 TEMs are found in the JASPAR. For an example, the motif [NGNNGCRSCG] has JASPAR ID MA0123.1_abi4. For the details see Ta-ble 3.
4. CONCLUSIONS
T [image:3.595.76.265.469.552.2]Table 1. Number of motifs in each tissue after motif merging.
721_B_lymphoblasts 22 FetalThyroid 50
Adipocyte 53 Fetallung 53
AdrenalCortex 32 GlobusPalidus 37
Adrenalgland 31 Heart 40
Amygdala 35 Hypothalamus 32
Appendix 43 Kidney 62
AtrioventricularNode 47 Leukemia_chronicMyelogenousK-562 19
BDCA4+_DentriticCells 38 Leukemia_promyelocytic-HL-60 63
Bonemarrow 50 Leukemialyphoblastic(MOLT-4) 30
BronchialEpithelialCells 28 Liver 44
CardiacMyocytes 20 Lung 12
Caudatenucleus 35 Lymphnode 45
CD4+_Tcells 41 Lymphoma_burkitts(Daudi) 64
CD8+_Tcells 77 Lymphoma_burkitts(Raji) 10
CD14+_Monocytes 44 MedullaOblongata 13
CD19+_BCells(neg._sel.) 43 OccipitalLobe 10
CD33+_Myeloid 21 OlfactoryBulb 14
CD34+ 24 Ovary 33
CD56+_NKCells 33 PancreaticIslet 22
CD71+_EarlyErythroid 39 Pancreas 19
CD105+_Endothelial 51 ParietalLobe 29
Cerebellum 53 pineal_day 50
CerebellumPeduncles 42 pineal_night 48
CiliaryGanglion 41 Pituitary 31
CingulateCortex 44 Placenta 33
colon 44 PrefrontalCortex 29
Colorectaladenocarcinoma 43 Pons 22
DorsalRootGanglion 34 Prostate 26
SkeletalMuscle 41 Tongue 53
Skin 54 Tonsil 13
small_intestine 48 TrigeminalGanglion 33
SmoothMuscle 42 Uterus 34
Spinalcord 46 UterusCorpus 49
SubthalamicNucleus 18 WholeBlood 40
SuperiorCervicalGanglion 39 Wholebrain 44
TemporalLobe 36 Fetalbrain 42
Testis 54 Fetalliver 65
TestisGermCell 53 retina 34
TestisIntersitial 63 Salivarygland 69
TestisLeydigCell 68 Thymus 49
TestisSeminiferousTubule 44 Thyroid 29
Thalamus 36
[image:4.595.105.497.107.738.2]721_B_lymphoblasts Adrenalgland AtrioventricularNode BronchialEpithelialCells CD4+_Tcells CD19+_BCells(neg._sel.) CD56+_NKCells Cerebellum CingulateCortex DorsalRootGanglion FetalThyroid Heart Leukemia_chronicMyelogenousK-562 Liver Lymphoma_burkitts(Daudi) OccipitalLobe PancreaticIslet pineal_day Placenta Prostate SkeletalMuscle SmoothMuscle SuperiorCervicalGanglion TestisGermCell TestisSeminiferousTubule Thyroid TrigeminalGanglion WholeBlood
[image:5.595.58.288.84.348.2]‐2 1 4 7 10 13 16 19 22 25 28 31 34 37 40
Figure 1. Numbers of TEMs by three test methods (The green color represents binomial distribution method, red color repre-sents bayes hypothesis test method, purple color reprerepre-sents classic hypothesis test method).
‐2 4 10 16 22 28 34 40 46 52 721_B_lymphoblasts
Adrenalgland AtrioventricularNode BronchialEpithelialCells CD4+_Tcells CD19+_BCells(neg._sel.) CD56+_NKCells Cerebellum CingulateCortex DorsalRootGanglion FetalThyroid Heart Leukemia_chronicMyelogenousK‐562 Liver Lymphoma_burkitts(Daudi) OccipitalLobe PancreaticIslet pineal_day Placenta Prostate SkeletalMuscle SmoothMuscle SuperiorCervicalGanglion TestisGermCell TestisSeminiferousTubule Thyroid TrigeminalGanglion WholeBlood
Figure 2. Numbers of TEMs by three test methods (The green color represents binomial distribution method, red color repre-sents bayes hypothesis test method, purple color reprerepre-sents classic hypothesis test method).
Byes Hypothesis Test
Binomial Distribution Method 5
92 395
11 47
1471
171 Classic Hypothesis Test
(a)
1078 Byes Hypothesis Test
Binomial Distribution 3 9 111 12
151 2 Classic Hypothesis Test
624
(b)
Figure 3. (a) Venn diagram of numbers of tissue rich motif finding by three methods; (b) Venn diagram of numbers of tissue even motif finding by three methods.
tissues and functional organs. Identification and analysis of tissue-specific genes and their regulatory activities play an important role in understanding mechanisms of the organism, disease diagnosis and drug design. And finding accurate and meaningful motif with tissue speci-ficity still remains a big challenge.
[image:5.595.308.538.86.553.2] [image:5.595.59.287.406.687.2]Table 2. 4 matches of 5 TRMs and 19 matches of 39 TEMs found in JASPAR.
Motif Logo Motif ID in JASPAR Motif length Motif match
MA0079.2_SP1 10 1
MA0105.1_NFKB1 11 1
MA0011.1_br_Z2 8 1
MA0008.1_HAT5 8 1
Table 3. TRMs (Motif Match item is the number of motifs in the database).
Motif logo Motif ID in JASPAR Motif length Match count
MA0017.1_NR2F1 14 1
MA0079.2_SP1 10 5
MA0123.1_abi4 10 2
MA0039.2_Klf4 10 2
MA0327.1_MATA1 7 2
MA0436.1_YPR022C 6 1
MA0029.1_Evi1 12 1
MA0368.1_RIM101 7 2
MA0443.1_btd 10 1
MA0267.1_ACE2 6 2
[image:6.595.56.543.282.734.2]z-test. We finally got 2784, 1204 and 703 motifs re- spectively out of 3244 motifs obtained in discovery phase using above three tests from 3954 TS genes across 83 human tissues. 52.7% of those motifs can be found available in databases public.
REFERENCES
[1] Dezso, Z., et al. (2008) A comprehensive functional analysis of tissue specificity of human gene expression. BMC Biology, 6, 49.
[2] Kuzmin, D., et al. (2010) Novel strong tissue specific promoter for gene expression in human germ cells. BMC Biotechnology, 10, 58. doi:10.1186/1472-6750-10-58
[3] Grosso, A., Gomes, A. and Barbosa, N. (2008) Tissue- specific splicing factor gene expression signatures. Nu- cleic Acids, 36, 4823-4832. doi:10.1093/nar/gkn463
[4] Hebert, C. (2010) Nucleosome rotational setting is asso- ciated with transcriptional regulation in promoters of tis- sue-specific human genes. Genome Biology, 11, R51.
doi:10.1186/gb-2010-11-5-r51
[5] Lawson, M.J. and Zhang, L. (2008) Housekeeping and tissue-specific genes differ in simple sequence repeats in the 5'-UTR region. Gene, 407, 54-62.
doi:10.1016/j.gene.2007.09.017
[6] Song, F., et al. (2009) Tissue specific differentially me- thylated regions (TDMR): Changes in DNA methylation during development. Genomics, 93, 130-139.
doi:10.1016/j.ygeno.2008.09.003
[7] Tompa, M., et al. (2005) Assessing computational tools for the discovery of transcription factor binding sites. Nature Biotechnology, 23, 137-144. doi:10.1038/nbt1053
[8] Bailey, T.L., et al. (2009) MEME SUITE: Tools for motif discovery and searching. Nucleic Acids Research, 37,
W202-W208.
[9] Neuwald, F., Liu, J.S. and Lawrence, C.E. (1995) Gibbs motif sampling detection of bacterial outer membrane protein repeats. Protein Science: A Publication of the Protein Society, 4, 1618-1632.
[10] Clements, M. (2007) Creating motifs with LocoMotif. Scanning.
[11] Liu, X., Yu, X., Zack, D.J., Zhu, H. and Qian, J. (2008) TiGER: A database for tissue-specific gene expression and regulation. BMC Bioinformatics, 9, 271.
doi:10.1186/1471-2105-9-271
[12] Xiao, S.J., Zhang, C. and Zou, Q. (2010) TiSGeD: A da- tabase for tissue-specific genes. Bioinformatics, 26, 1273- 1275. doi:10.1093/bioinformatics/btq109
[13] Suzuki, Y., Yamashita, R., Nakai, K. and Sugano, S. (2002) DBTSS: DataBase of human transcriptional start sites and full-length cDNAs. Nucleic Acids Research, 30, 328-331. doi:10.1093/nar/30.1.328
[14] Périer, R.C., Praz, V., Junier, T., Bonnard, C. and Bucher, P. (2000) The eukaryotic promoter database (EPD). Nu- cleic Acids Research, 28, 302-303.
[15] Zare-Mirakabad, F., Ahrabian, H., Sadeghi, M., Hashe- mifar, S., Nowzari-Dalini, A. and Goliaei, B. (2009) Ge- netic algorithm for dyad pattern finding in DNA se- quences. Genes & Genetic Systems, 84, 81-93.
doi:10.1266/ggs.84.81
[16] Habib, N., Kaplan, T., Margalit, H. and Friedman, N. (2008) A novel bayesian DNA motif comparison method for clustering and retrieval. PLoS Computational Biology, 4. doi:10.1371/journal.pcbi.1000010