Munich Personal RePEc Archive
Considerations on the intellectual
potential creativity
Certan, Simion and Certan, Ion
State Agrarian University of Moldavia, State Agrarian University of
Moldavia
21 October 2013
CONSIDERATIONS
ON THE INTELLECTUAL POTENTIAL CREATIVITY
SIMION CERTAN1, ION CERTAN2
Abstract: The functionality of the new economic system of Republic of Moldavia, based on market relations and opened to world, frequently marked by dynamism, often by uncertainty and risk, sometimes even hostility, depends, crucially, on the innovation activity. Innovation activity, formation of innovation potential is definitely influenced by motivational politics and the reward system. The article reflects on the evolution of innovative activity, formation of innovation potential, motivational system and proposes some measures that would boost the intellectual property.
Key words: education, innovation, intellect, motivation, performance, rewards, research
INTRODUCTION
To qualify the transition to the market economy is mentioned in the Moldavian Parliament decision of 26 July 1990, as a model of management and the main measure of economic recovery of the country. The functionality of the new economic system of our country, frequently marked by dynamism, often by uncertainty and risk, sometimes even hostility depends, crucially, on the creative people, the intellectual potential. Creativity is influenced by a large number of factors, including staff motivation intellectually, what determines the actuality of this material.
STAGE OF KNOWLEDGE THE PROBLEM
Aspects of both the study of the development of innovative activity and motivational appearance is found in the national and international research. However, even these have been discussed in various official meetings in our country, approached at scientific sessions, presented in various national and international publications, the innovation activity, forming and development of innovation potential remains a current and important investigation for our country.
MATERIAL AND METHOD
Of the materials used in research, monographs and other specific publications that helped us to understand and explain the phenomena that occur in the work of innovation and motivation system are part. Quantitative analysis is performed on data selected and processed by the authors based on statistical yearbooks of the National Bureau of Statistics. The study of empirical information, the analysis of the links provided us relevant meanings and explanations in relation to the phenomena and processes of formation of the intellectual potential that occur in our country.
Results and meditations
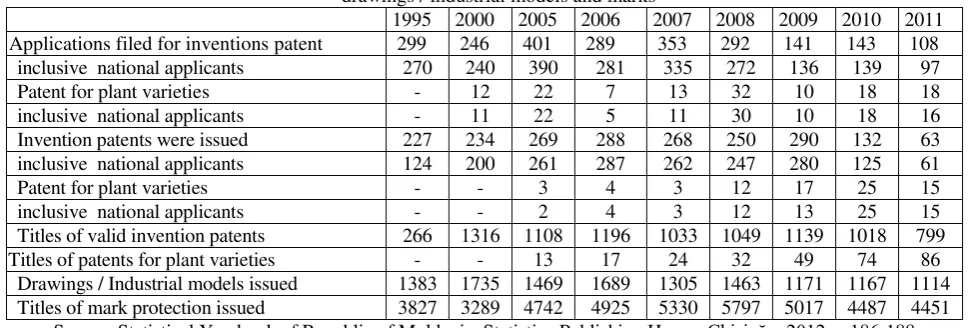
For any country or business that intends to improve the competitive position against rival bidders is needed to encourage the research and development activity. Quantitatively this activity can be assessed by the number of invention patents or patents for plant varieties issued, by the number of drawings / industrial models and trade mark protection titles released.
A. Products of creativity and innovation activity
The number of applications for invention patent has a clear trend of reduction from 401 in 2005 (Table 1) to 108 in 2011, or 3,7 times. The situation is identical for the national applicants’ requests.
1
Professor, State Agrarian University of Moldavia 2
Table 1. The evolution of applications filed for protection of inventions, plant varieties, utility models, drawings / industrial models and marks
1995 2000 2005 2006 2007 2008 2009 2010 2011 Applications filed for inventions patent 299 246 401 289 353 292 141 143 108
inclusive national applicants 270 240 390 281 335 272 136 139 97 Patent for plant varieties - 12 22 7 13 32 10 18 18 inclusive national applicants - 11 22 5 11 30 10 18 16 Invention patents were issued 227 234 269 288 268 250 290 132 63 inclusive national applicants 124 200 261 287 262 247 280 125 61 Patent for plant varieties - - 3 4 3 12 17 25 15 inclusive national applicants - - 2 4 3 12 13 25 15 Titles of valid invention patents 266 1316 1108 1196 1033 1049 1139 1018 799 Titles of patents for plant varieties - - 13 17 24 32 49 74 86
Drawings / Industrial models issued 1383 1735 1469 1689 1305 1463 1171 1167 1114 Titles of mark protection issued 3827 3289 4742 4925 5330 5797 5017 4487 4451
Source: Statistical Yearbook of Republic of Moldavia, Statistica Publishing House, Chişinău, 2012, p.186-188
Although the share of patent applications for plant varieties increases from 2.4% in 2006 to 18.5% in 2011, their number remains unacceptably low for an agricultural country like Moldavia. The same downward trend both of share of patents issued from 67.1% and the number from 269 in 2005 to 58.3% and 63 respectively in 2011. It is normal that the total number of patent titles had reduced from 1316 in 2000 to 799 in 2011 or with about 40 percent.
The total patent titles for plant varieties increased from 13 in 2005 to 86 in 2011, or by 6.6 times, but remains far too insufficient, constituting only 10.7% of the total number of patent titles in our country. The categorical decline of patents of invention correlates perfectly with the situation in the national economy.
Slower, from 1735 in 2000 to 1114, or with about one-third had reduced the number of drawings / industrial models issued. Number of titles issued for trademark protection has increased from 3827 in 1995 to 5797 in 2008 or by 1.5 times and then reduced to 4451 in 2011, or with about 22 percent compared with 2008. The large number of titles issued for trademark protection in relation to the number of drawings / industrial models issued is due to the increasing of small and medium businesses who want to distinguish themselves on the market.
The level of development of creative thinking, allowing new and unusual ideas development is influenced, first, by the environment in which the person activates. Such environment can be both whole range of institutions (juridical persons) and individuals who seek protection for inventions and utility models.
[image:3.595.48.535.90.254.2]The total number of legal persons requesting protection of inventions and utility models (Table 2) ranges from 128 in 2000 and 232 in 2005. The requests of the academic institutions to protect inventions and utility models increased from 29 in 2000 and 32 in 1995 to 100 in 2007, then decreases by about 16 percent in 2011. If in 1995 the applicants for protection of inventions and utility models of branch institutions were 2.06 times more than those required by the academic institutions and in 2011 were 3.82 times less.
Table 2. The evolution of national categories of applicants
1995 2000 2005 2006 2007 2008 2009 2010 2011 Total legal persons 191 128 232 176 217 196 195 218 166
Of which: academic institutions 32 29 64 48 100 87 95 82 84 Branch research institutions 66 26 38 27 35 25 32 41 22 Institutions of higher education 71 51 104 89 73 74 61 91 53 Enterprises and organizations 22 22 26 12 9 10 7 4 7 Individuals 85 126 184 121 145 138 135 121 109
Source: Statistical Yearbook of Republic of Moldavia, Statistica Publishing House, Chişinău, 2012, p.187
protection of inventions and utility models from companies and organizations are reduced from 22 - 26 in 1995-2005 to 4-7 in 2009-2011, which clearly demonstrates their interest decreased for creativity, for inventions.
Even the interest for developing creative thinking that enables development of new and unusual ideas ranges from 184 in 2005 to 85 in 1995 and 109 in 2011, their relationship to the legal entities has been of 79.3 %, 44.5 % and 65.6 percent in 2011. Creative thinking is the product of innate predispositions, developed by environment and grafting knowledge and skills, in other words by learning and training.
B. The education system of the creative potential
Given the increasingly competitive economy, people do not ask if they need to make changes, but want to know how to do. To make changes, the creative potential is required to be taught.
Learning, as Petington affirms, quoted by Daniela Tatiana Corodeanu [4, p.122], is "the process by which skills, knowledge, attitudes and behavior are formed and developed". Learning cycle, after Richard Pettinger [5, p.46], includes: concrete experience - observation and reaction - conceptualization and reaction - testing ideas and concepts in new situations.
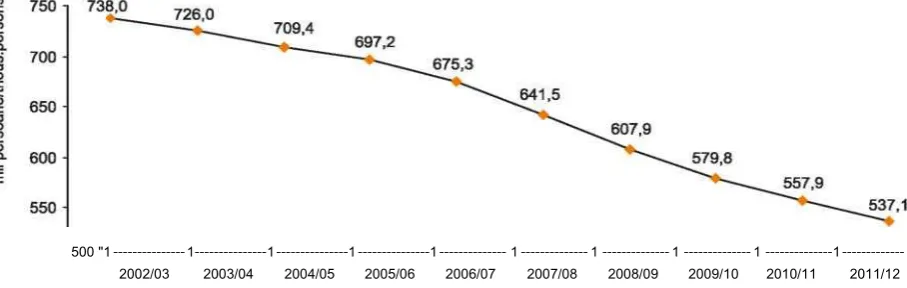
Learning aims to achieve a personal growth. Those involved in this process can learn things they did not know before and whose knowledge and application can handle both the current problems and the next day’s, can ensure greater efficiency in the economy both now and in the future. Number of pupils and students learning has a clear tendency to decrease.
[image:4.595.73.527.434.578.2]Thus, as follows in Figure 1, the number of pupils and students in academic year 2011/2012 constitutes 72.8% of those studying in the academic year 2002/2003. Total number of pupils decreased from 605 200 in the academic year 2002/2003 to 381 400 in the school year 2011/2012, or with about 37 percent.
Figure 1. The evolution of pupils and students number
500"1 --- 1 --- 1 ---1 ---1 --- 1 --- 1 --- 1 --- 1 --- 1 --- 2002/03 2003/04 2004/05 2005/06 2006/07 2007/08 2008/09 2009/10 2010/11 2011/12
Source: Education in Republic of Moldavia, Statistical publication, 2011/2012
The number of pupils per 10,000 inhabitants decreases from 1671 to 1071 or with about 36 percents. Decline in the number of pupils was caused by the demographic situation in the country and partly by the fact that increasingly more pupils prefer to study in other countries.
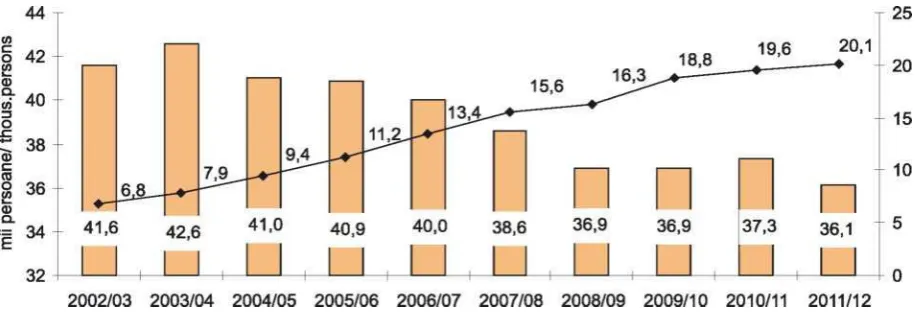
Figure 2. The share of teachers at retirement age
=l teachers in day schools, gymnasiums and lyceums < -♦— teachers at retirement age
Source: Educaţia în Republica Moldova, Publicaţie statistică, 2011/2012
After the accession of the Republic of Moldavia, in 20 May 2005, in the "Project Bologna", which aims to improve the European education system so as to ensure the transformation of the European Union economy into one of the most competitive and dynamic global economy based on knowledge, the system education in our country has undergone major changes.
Under that draft, the national superior education is structured in three cycles: first - undergraduate, second - master, as research or professional and third - PhD.
If the number of students increased from 77 312 in the study year 1999/2000 to 114 552 in the study year 2004/2005, or with about 48 percent, then decreased to 103 956 in the study year 2011/2012, or with 9.3 percents. Even our country joined the "Bologna Project" in 2005, it closed the cycle in the study year 2009/2010.
[image:5.595.70.529.71.227.2]The total number of students enrolled in the 2009-2011 rose slightly by 4.3 percents (Table 3), but the number of those enrolled in the first cycle (Bachelor) fell to 0.44 thousand and those enrolled in the second cycle (Master's degree) increased by 27 percents. Even in 2011 the ration of bachelor students and those who do master studies, being 2.7 to 1, does not meet the recommendations of "Project Bologna". And higher (4.3 to 1) is the gap of first and second cycle graduates.
Table 3. Evolution of student’s number, thousand
Graduates Enrolled Number of students 2009 2010 2011 2009 2010 2011 09/10 10/11 11/12 Total 26.61 28.41 27.79 27.08 27.90 28.26 109.9 107.8 103.9 First cycle (Bachelor) 18.16 21.99 21.95 20.53 20.40 20.09 93.40 90.70 85.34 Second cycle (Master's degree) - 4.54 5.10 5.83 6.74 7.42 10.97 12.86 14.44
Given the fierce economic competition cannot be applied only the solutions crystallized in textbooks, monographs and other publications. Conditions generated by the economy based on market relations causes the necessity of performance investigations to ensure consistency of assumptions, phenomenon analysis and conclusions on which would propose concrete actions appropriate to the today realities.
In other words, those who want to be creative have to be equipped with skills to conduct scientific research that represents the oriented search of explanations and solutions to problems caused by phenomena and processes based on economy to market relations. Researcher skills formation takes place in the third cycle - doctoral, which lasts 3-4 years and is organized by day education or part-time education.
Scientific research concludes with the presentation of the thesis of doctor in sciences/ habilitate doctor, which is an original scientific paper, prepared on the basis of the own scientific research published, contains new theoretical and practical results nationally and globally, illustrates the importance of the author contribution in science and is perfected in order to obtain scientific degree of doctor / habilitate doctor. According to the requirements of CNAA, the doctor / habilitate doctor thesis must be a product of innovation.
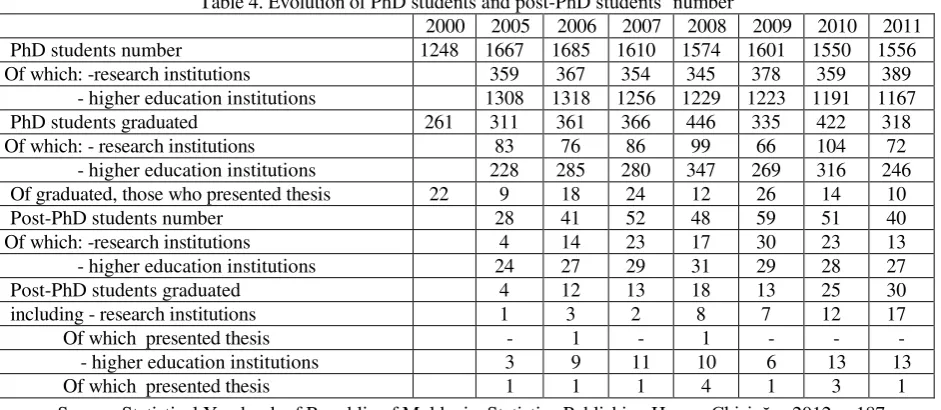
[image:6.595.64.535.311.516.2]The number of PhD students in the years 2000-2006 (Table 4) increased by about a third, then oscillates, forming in 2011 just over 92 percent from 2006. In the years 2005-2011 the number of PhD students increases (by 8.3%) in the research institutions, but decreases (10.8%) in higher education institutions. The number of post-PhD students varies from 28 in 2005 to 59 in 2009, including research institutions from 4 in 2005 to 30 in 2009 and the higher education institutions from 24 in 2005 to 31 in 2008.
Table 4. Evolution of PhD students and post-PhD students’ number
2000 2005 2006 2007 2008 2009 2010 2011 PhD students number 1248 1667 1685 1610 1574 1601 1550 1556 Of which: -research institutions 359 367 354 345 378 359 389
- higher education institutions 1308 1318 1256 1229 1223 1191 1167 PhD students graduated 261 311 361 366 446 335 422 318 Of which: - research institutions 83 76 86 99 66 104 72
- higher education institutions 228 285 280 347 269 316 246 Of graduated, those who presented thesis 22 9 18 24 12 26 14 10 Post-PhD students number 28 41 52 48 59 51 40 Of which: -research institutions 4 14 23 17 30 23 13 - higher education institutions 24 27 29 31 29 28 27 Post-PhD students graduated 4 12 13 18 13 25 30 including - research institutions 1 3 2 8 7 12 17 Of which presented thesis - 1 - 1 - - - - higher education institutions 3 9 11 10 6 13 13 Of which presented thesis 1 1 1 4 1 3 1
Source: Statistical Yearbook of Republic of Moldavia, Statistica Publishing House, Chişinău, 2012, p.187
If the number of PhD graduates in the years 2005-2011 was 2559, the number of those who presented thesis amounted 113, which form only 4.4% of PhD graduates. Number of postdoctoral studies graduates in the years 2005-2011 was 115 of which 14, in those years, presented the thesis of habilitate doctor, meaning 12.17% of the graduates.
[image:6.595.62.536.312.515.2]Number of employees in research and development (Table 5) in 2006 constituted 76.5% of those who were working in 2000, then rise to 5216 in 2011, or 15.8 percent. The share of researchers in total number of employees in research - development activity amounted 69.6% in 2000, 55.6% in 2006 and 64.6% in 2011.
Table 5. Employees in research and development
2000 2005 2006 2007 2008 2009 2010 2011 Employees in research and development,
total
5889 4672 4505 4587 5315 5424 5114 5216
Including researchers 4101 2583 2507 2592 3471 3561 3267 3372 Of total - doctors in sciences 2043 932 927 983 1311 1374 1288 1359 - habilitate doctors 501 256 259 271 367 382 378 393
In 2011, in the total number of researcher, were 1618 women, or about 48 percents. PhD share of total researchers formed 49.8% in 2000, 36.98% - in 2006 and 40.3% in 2011 and habilitated doctors - respectively 12.2, 10.3 and 11.6 percents.
[image:7.595.145.400.189.303.2]In 2011, the older researchers dominated. Thus, researchers under the age of 25 years made up 6.1% of the total (Figure 3), 25-34 years -20.3%, 35-44 years - 16.5%, 45-54 years -17.5%, 55-64 years 22.2%, 65 and over - 17.4%. Comments are superfluous.
Figure 2. Share of teachers at retirement age
Source: Education in Republic of Moldavia, Statistical publication, 2011/2012
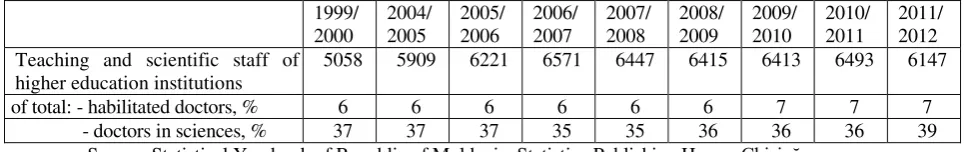
Teaching and scientific potential of higher education institutions (Table 6) increased from 5058 in the study year 1999 / 2000 to 6571 in the study year 2006/2007, or by 29.9%, and then decreases until 6147 in the study year 2011 / 2012 or with about 6.5 percents.
Table 6. Evolution of teaching and scientific potential of higher education institutions
1999/ 2000
2004/ 2005
2005/ 2006
2006/ 2007
2007/ 2008
2008/ 2009
2009/ 2010
2010/ 2011
2011/ 2012 Teaching and scientific staff of
higher education institutions
5058 5909 6221 6571 6447 6415 6413 6493 6147
of total: - habilitated doctors, % 6 6 6 6 6 6 7 7 7 - doctors in sciences, % 37 37 37 35 35 36 36 36 39
Source: Statistical Yearbook of Republic of Moldavia, Statistica Publishing House, Chişinău
Basically, during the period indicated in Table 6 doctors in sciences and habilitated doctors share is maintained at 41-46%. If the ration of doctors in sciences and habilitated doctors was 4.1 to 1 in 2000, 3.6 to 1 in 2006 and 3.46 to 1 in 2011, then in similar years, in the university institutions this report was 6.1 to 1, 6.1 to 1 and 5.6 to 1.
The above situation on the formation and development of creative potential and innovation activity is the consequence of a large number of factors, among which the motivation system is highlighted.
C. Motivation of the intellectual potential creative activity
[image:7.595.49.532.405.481.2]The internal expenses from the research and development activity in our country, even if they increased in last three years by 5 percent (Table 7), remain far too weak. Moreover, the share of domestic expenditures in R & D in GDP decreases from 0.52% in 2009 to 0.4% in 2011.
Table 7. Categories of domestic expenditures in the research and development activity, million lei 2009 2010 2011 Gross domestic product 60430 71885 82174 Internal expenses in the research and development activity, total 317.6 316.2 333.5 Of which current domestic expenditures 281.8 291.8 312.8 including: -labour remuneration 174.2 170.5 174.8 - Mandatory expenses for social insurance and
healthcare
43.4 43.2 44.4
Material expenses 45.3 51.3 62.6
Other current expenses 19.0 26.9 31.0
Internal capital expenses 35.8 24.3 20.6
Of which equipments 25.4 17.2 16.2
Source: Statistical Yearbook of Republic of Moldavia, Statistica Publishing House, Chişinău
Capital expenditures were reduced, in the reference years, by 42.5 percents, accounted in 2011 only 6.17 % of all internal expenses from the research and development activity. Material expenses in 2011 were formed about 18.8 % and for equipment - 4.8 % of total domestic expenditures in research and development activity.
Creativity of those involved in innovation activity is influenced definitely by way of "encouraging." Recognition from superiors encourages getting great results and increases the desire to achieve good performance in the future. Everyone, including those creative, reacts positively to praise, either orally or in the form of certificates or other distinctions. However, those creative are rarely mentioned. So, for example, the TV channel "PUBLIKA" recently achieved the project “10 for Moldova”, according to which have been selected and specified personalities from various fields, but the representatives of science are not found.
The creative activity, especially of the individual, is influenced by rewards. A balanced system of rewards will have a positive impact on morale and satisfaction and will motivate employees engaged in research and development to be effective. The reward system must give employees the possibility to satisfy basic needs (in terms used by Maslow, the first two levels). An important part of the reward expected by employees is money. The average monthly income per household member, even if the last three years increased by 23.9 percent (Table 8) does not cover subsistence. It is significant that the average monthly income of a household member was 42.4% in 2009, 42.8% in 2010 and 47.5% in 2011 in nominal average monthly earnings of the employee in the economy.
Table 8. Average nominal monthly earnings lei
2009 2010 2011 Disposable income of population (monthly average
on a household member)
1166.1 1273.7 1444.7
Minimum for existence (monthly average on a person
1187.8 1373.4 1503.0
Disposable income ration with minimum of existence, % 98.2 92.7 96.1 Average nominal monthly wage of the employee in the economy 2747.6 2971.7 3042.0
Including: -agriculture, hunting economy and forestry 1468.9 1636.6 1831.8 - industry 3135.6 3430.9 3393.5 - financial activities 5637.7 6368.2 6047.1 - public administration 3209.0 3204.8 3457.3 - education 2135.6 2361.0 2755.8 % compared to average wage on economy 77.7 79.4 87.8
[image:8.595.47.532.583.764.2]People in any organization are willing to compare their rewards with others both within their organization and with workers from elsewhere. For this reason, the perception of fairness plays an important role.
Average earnings of employees in education is inferior to average on economy and those in R & D even if it is a slightly higher, has a clear trend of reduction this difference. Significantly is that in agriculture and industry (goods sectors), in education and research and development (areas that ensure economic prosperity) average monthly nominal wage of the employee is less than those from public administration.
Finally, we consider imperative to develop a reward system that would ensure fairness to employees and motivate employees work in any field, including science and education, areas that provide functionality of the new economic system of our country.
REFERENCES
1. Breban V. Dicţionar al limbii române contemporane. Bucureşti: Ed. Ştiinţifică şi Enciclopedică, 1980 2. Dicţionarul explicativ al limbii române, ediţia a II, Bucureşti, Ed. Univers enciclopedic, 1998
3. Cole Gerald A., Management: Teorie şi practică, Chişinău, Ştiinţa, 2006
4. Corodeanu Daniela Tatiana, Management. Comportamentul şi performanţa întreprinzătorului român, Tehnopress, Iaşi, 2006