13
lingvis.io
— A Linguistic Visual Analytics Framework
Mennatallah El-Assady1, Wolfgang Jentner1, Fabian Sperrle1,
Rita Sevastjanova1, Annette Hautli-Janisz2, Miriam Butt2, and Daniel Keim1
1Department of Computer Science, University of Konstanz, Germany
2Department of Linguistics, University of Konstanz, Germany
Abstract
We present a modular framework for the rapid-prototyping of linguistic, web-based, visual analytics applications. Our framework gives developers access to a rich set of machine learning and natural language processing steps, through encapsulating them into micro-services and combining them into a compu-tational pipeline. This processing pipeline is auto-configured based on the requirements of the visualization front-end, making the lin-guistic processing and visualization design de-tached, independent development tasks. This paper describes the constellation and modality of our framework, which continues to support the efficient development of various human-in-the-loop, linguistic visual analytics research techniques and applications.
1 Introduction
Research at the intersection of computational lin-guistics, visual analytics, and explainable machine learning, is a vibrant, interesting field that broad-ens the horizons of all disciplines involved. Over the last years, a team of computer scientists, lin-guists, as well as social scientists from differ-ent areas, at the University of Konstanz, have come together to push their disciplinary bound-aries through collaborative research. This col-laboration resulted in the development of several mixed-initiative visual analyitcs approaches, rang-ing from generatrang-ing high-level corpus overviews usingLexical Episode Plots(Gold et al.,2015) to sophisticated human-in-the-loop topic refinement techniques (El-Assady et al.,2018b,2019).
This effort has helped establish the subarea of Linguistic Visualization (short: LingVis) re-search (Butt et al., 2019). Within this subarea, application topics we worked on include content analysis, e.g., NEREx (El-Assady et al., 2017b); discourse analysis, e.g.,ThreadReconstructor
(El-Assady et al., 2018a); language change, e.g., HistoBankVis (Sch¨atzle et al., 2017) or COHA Vis(Schneider et al.,2017); readability analysis, e.g., literature fingerprinting (Oelke et al., 2012); language modeling, e.g.,LTMA(El-Assady et al., 2018c); argumentation analysis, e.g.,ConToVi (El-Assady et al., 2016); explainable machine leran-ing, e.g., verbalization and active learning (Sev-astjanova et al., 2018a,b); interactive model re-finement, e.g., SpecEx (Sperrle et al., 2018); multi-corpora analysis, e.g., Alignment Vis (Jent-ner et al.,2017); modeling of speech features, e.g., SOMFlow(Sacha et al.,2018).
To make our linguistic visualization techniques accessible to a wider public, we strive to im-plement them as web-based applications. How-ever, this is only possible on a larger scale us-ing a framework architecture that accommodates the needs for rapid-prototyping, disguising the in-volved engineering complexity for application de-velopers. Hence, we established the lingvis.io framework as a common platform, facilitating the share and reuse of implementation components. A prominent application powered by our framework isVisArgue(El-Assady et al.,2017a), an approach for multi-party discourse analysis.
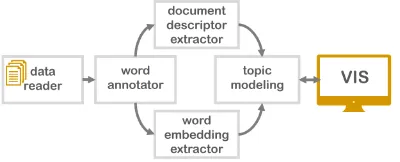
Figure 1: Thelingvis.ioframework driving various linguistic visualization projects based on rich NLP pipelines.
for instance, visual debugging for linguists, or in-sights for domain experts, such as writers, political scientists, etc. To address the trade-offs between tailored and expressive interface design, rapid-prototyping, and processing flexibility, our frame-work architecture strictly separates and modular-izes tasks into atomic components that are com-partmentalized in subdomains (i.e., auto-scaling cluster environments). Developers work on their designated feature branches and efficiently test their prototypes through continuous deployment.
Related Work – Other notable frameworks re-lated to ours include Stanford CoreNLP1, GATE2 and Weblicht3. Facebook has recently released a deep-learning based framework for various NLP tasks, called pytext4. While they provide state-of-the-art models, they are code-only platforms that require developers to write processing pipelines from scratch every time. More general (deep learning) frameworks, including tensorflow5 and pytorch6 can also be used for text processing or to generate rich feature vectors like sentence-or wsentence-ord-embeddings. KNIME7 and TABLEAU8
are platforms for intuitively creating data science workflows with reusable components, but are not tailored to NLP tasks specifically. While we can communicate with those frameworks through APIs to enrich our own NLP pipeline, these toolk-its are solely tailored to linguistic analysis and of-fer no, or very limited, visualizations possibilities.
1stanfordnlp.github.io/CoreNLP 2
gate.ac.uk
3
weblicht.sfs.uni-tuebingen.de
4github.com/facebookresearch/pytext 5
tensorflow.org
6
pytorch.org
7
knime.com
8tableau.com
2 Auto-Configured Processing Pipeline
Our framework is based on the assumption that the individual processing steps can and should be atomic in their nature. Each step holds a well-defined list of dependencies which the respec-tive step requires to execute its task successfully. This allows us to model a processing pipeline for a given type of data input as an acyclic graph which can be processed in parallel. For exam-ple, as shown in Figure 2, to retrieve the result of a topic model, the visualization requests one or more models. Based on their dependencies to other steps, a pipeline is generated (that takes into account all user-defined parameters). Here, the topic modeling is based on descriptor vectors ex-tracted for each document in the corpus, as well as word embedding results.
Figure 2: Dependency graph for topic model relations.
A successful implementation requires a consis-tent, flexible, and well-defined data model such that each step can use its transformation capabili-ties to semantically enrich the data. We therefore do not allow any step to modify or delete data but each step can further add metadata. This section describes the modeling of processing steps in our pipeline, as well as the underlying data structure.
2.1 Processing Steps
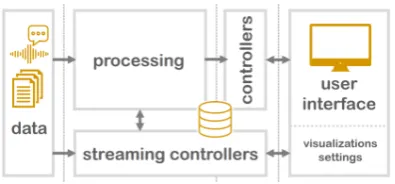
[image:2.595.318.518.492.573.2]fur-ther steered by the user. As shown inFigure 3, in the user interface (UI), users first upload and se-lect the data they want to process. Based on their intended tasks they then select suitable visualiza-tion components. Internally every visualizavisualiza-tion defines a list ofatomicprocessing steps as depen-dencies that need to run in order to generate the desired information to visualize. In addition to a list of dependencies, visualizations define one or multiple controller endpoints. These serve as com-munication medium between the processing steps and the UI, and are characterized by the fact that they do not further enrich the data and cannot be defined as dependencies by any other processing step. This implies that visualization steps termi-nate the acyclic graph and, thus, the resulting pro-cessing pipeline.
For the initial processing, a controller in the streaming-control-layer handles the communica-tion with every specific processing step and pro-vides the parameter-configuration interface to the UI. This enables users to parameterize the pro-cessing for increasing flexibility. For example, a POS tagger step can be parameterized with differ-ent tagger models. Such a tagset does not need to be static but can depend on a language or be based on a user’s selection. It is only constrained by the necessity of having a standardized tag set, as later steps use these tags to further process the data.
The endpoints in the two control layers sepa-ratestatic(default) fromstreaming controllers. In the default case, controllers are used to commu-nicate the results of a completed processing step to the visualization. Streaming controllers, on the other hand, intercept a processing step while it is running to support direct user interactions. Here, progressive visualizations are shown while the re-spective processing step is running. The users can, therefore, directly observe, adapt, and refine the underlying machine learning models. This enables the design of tightly-coupled, human-in-the-loop interfaces for interactive model refinement and ex-plainable machine learning.
2.2 Data Structure Modeling
[image:3.595.318.516.62.154.2]We represent a corpus hierarchy as a recursively stacked data structure consisting of, so-called, ‘document objects’. These are a modular abstrac-tion of all levels of the hierarchy, including cor-pora, documents, paragraphs, sentences, etc. The highest level of our data structure consists of a
Figure 3: Schematic overview of the framework.
collection of document objects that typically rep-resents all analyzed corpora, whereas the lowest level are single word tokens. Hence, from an or-dered list of all corpora, we can descend the data structure to find a list of documents for each cor-pus, all the way to sub-sentence structures, multi-word objects, and finally multi-words consisting of an ordered list of tokens. This flexible data structure allows us to model arbitrary complex object hier-archies, with each object level containing an or-dered list of the objects on the next level, while to-kens define the terminal level.
Each processing step in the pipeline has access to the full data hierarchy. Throughout the process-ing, steps append additional data elements to the hierarchy objects to enrich them with computa-tional results and metadata, making their process-ing results accessible to other steps downstream. Hence, through defining the pipeline dependen-cies, processing steps can request input data that is provided by its previous steps through defined for-mats, which ensures atomicity and encapsulation. This appended data is independent of a step’s so-phistication, which can range from simple wordlist lookups to complex deep neural network models. In the following, we describe the three data for-mats that can be appended to document objects.
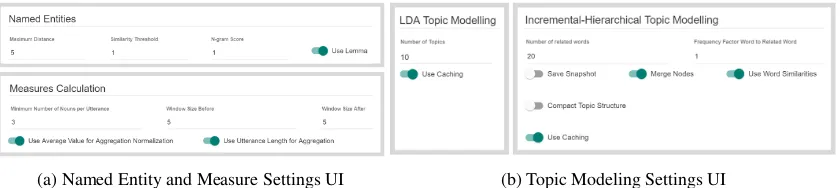
(a) Named Entity and Measure Settings UI (b) Topic Modeling Settings UI
Figure 4: UI components for parameterizing processing steps. Available settings depend on the underlying models.
scored based on several weighting schemes, such as tf-idf, ttf-idf, log-likelihood ratio, and other metrics, as described byEl-Assady et al.(2018b). Such weighted feature vectors can describe the im-portance of keywords on a global level (e.g., for all analyzed corpora) or on an individual object level (e.g., for a single document). Other types of fea-ture vectors include ones extracted using word- or sentence-embeddings, as well as vectors based on linguistic annotation pipelines.
(2) Attributes (A) – As opposed to numeric feature vectors, attributes consist of labels or pointers attached during processing. Both of these attribute types can be used to aggregate feature vectors or measures in the data hierarchy. For example, for dynamically computing all measure values related to a particular speaker and topic in a conversation, these attributes are utilized.
Labels(L) can be single flags, such as POS tags, or could consist of n-tuples, for example, to inform the types of arguments contained in the underlying text. To accommodate for labels that describe only parts of a hierarchy, we also feature window la-bels. These are stored in the hierarchy level above the targeted level and contain a beginning and end-ing indices of the children. For example, the sen-tencehierarchy level may contain a label consen-suswith a beginning index of0and ending index of6, pointing to a sub-sentence structure that en-codes that the first six tokens of that sentence are indicating a consensus.
Pointers (P), on the other hand, are attributes that point to external structures, such as topics, speakers, or other entities. Such structures are usu-ally modeled by specific processing steps and con-tain descriptive features of the elements they rep-resent. For example, a topic might contain a list of descriptive keywords, whereas a speaker object would contain metadata and biography informa-tion on a speaker.
(3) Measures (M) – As a pendant to nominal attributes, measures are numeric or boolean values
attached to the document objects. These are used to describe linguistic features of various types. As with the labels, a measure consists of a class name and a singular value. They are typically used to qualify properties of objects and, thus, can be ag-gregated through the data hierarchy. In addition, measures can be normalized, for example, based on the number of tokens in a document. We distin-guish three types of measures: Boolean;numeric continuous; andnumeric bi-polar. Such measures can be extracted through a variety of processing steps, ranging from simple word-list-based tag-gers, statistical analysis steps, rule-based annota-tors, through sophisticated machine learning based measure calculators. We use such measures to ex-tract semantically relevant information or to moni-tor the quality of document objects with respect to selected criteria. Hence, such measures inform the visual analytics methods and expand the dimen-sionality of the underlying objects.
3 User Interface
“Simplicity comes at the cost of flexibility” (Jent-ner et al.,2018). The dependency-based process-ing model automatizes many decisions a user has to take in other frameworks. However, in order to allow domain-experts to use their knowledge and influence the underlying models, parameterization is necessary. We run a linearization of theacyclic graphprior to executing the pipeline. This allows us to display the steps and their parameters in the order of the processing-flow to support the users in their parameter estimation. To further support users we deploy guidance in the form of informa-tion pop-ups and built-in tutorials. This includes explaining how a respective processing step trans-forms the data and the value it adds to the task, but furthermore involves descriptions of the parame-ters and their estimated impact.
frame-work to demonstrate its expressiveness and flex-ibility. Let this partial pipeline be: (1) Named EntityRecognizer (A-L)→(2)DocumentFeature Extractor (FV) → (3) Topic Modeling (A-P) →
(4)MeasureCalculator (M). The (1)NERstep la-bels(A-L) tokens withNamed Entities. As shown inFigure 4a, the user can define parameters such as theminimum distanceandsimilarity score. The (2) DFEcreates feature vectors (FV) on all data hierarchies. Based on the data and task, the user selects and weights the features and selects an ap-propriate scoring scheme. In the (3) TM step, the user selects one or multiple of the available topic models (e.g., LDA, IHTM) and parameter-izes them, for example, with the number of de-sired topics (Figure 4b). Note that this step uses only the feature vectors extracted in the previous step. It assigns additionalpointer attributes(A-P) for each document reflecting their probability to belong to a certain topic. The (4)MC then uses, for example, the topic labels to calculatemeasures (M) such asTopic Shiftwhere the topic of discus-sion is changed within a document, orTopic Per-sistencewhere a given topic continues to be pur-sued by the author or speaker.
Such a pipeline is part of multiple visualization creation cycles. For example, we utilize the re-sults of topic modeling to analyze the dynamics of speakers in a conversation transcript in Con-ToVi(El-Assady et al.,2016). Hence, to build such visualization approaches, we rely on the auto-configuration of the processing pipeline, as well as the familiarity of users with their analyzed data and tasks, enabling application developers to fo-cus on their encapsulated implementation environ-ment without worrying about the complexity of the underlying linguisic processing.
4 Microservice Architecture
The modularity of our framework and atomicity of the steps is further emphasized by the use of mi-croservices (Figure 5,s1,s2,s3). A microservice is a small, single-purpose service that exposes an API. Because our microservices are dockerized,9 the microservice itself is independent of any gramming language and environment which pro-vides us with great flexibility. Additionally, in-dividual microservices are easier to maintain than a large, monolithic framework. An example mi-croservice from our framework returns POS tags
[image:5.595.306.528.63.152.2]9docker.com
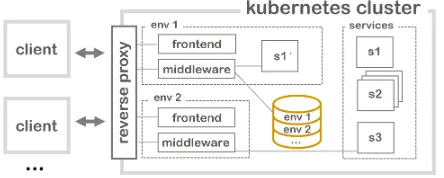
Figure 5: Multiple environments (env1, env2) of the
lingvis.ioframework are managed in a kubernetes clus-ter. Microservices (s1,s2,s3) are tailored to a specific task and resemble different steps of the pipeline. Any microservice can be redefined in a specific environment if variations of the functionality are needed.
for tokenized texts. Requests to that service con-tain a list of tokens, and are parametrized with the tagger model to use. The middleware handles the user authentication, the (processed) data, the pipeline steps, and the controllers (Figure 3). In addition, it coordinates the microservices and han-dles communication with their respective APIs to obtain results to add to the data.
Our framework lives in a kubernetes clus-ter10 which effectively manages and orchestrates docker containers. This allows us to scale microservices, running multiple instances and balancing their load automatically—even across physical servers (Figure 5, sees2). We are further able to run multiple environments of thelingvis.io framework (middleware & frontend) in our cluster allowing our researchers to deploy a tailored ver-sion, for example, for a user evaluation. Kuber-netes in combination with the reverse proxy trae-fik11automatically assigns a URL to the frontend and the middleware to make them accessible from anywhere in the world.
5 Conclusion
A demo of our framework is available under https://demo.lingvis.io/. Currently available visu-alizations with attendant NLP microservices are presented via the demo video or can be found un-der the “Visualizations” button. To the best of our knowledge,lingvis.iorepresents the first scaleable and modular web-based framework that combines NLP with visual analytics applications. Its unique contribution lies in combining these applications in a novel way on the one hand, but in separating NLP processing and visualizations on the opera-tional level through an auto-configured pipeline on
10
kubernetes.io
the other hand. This enables developers to focus on the individual task at hand, rather than being distracted by needing to solve general NLP or vi-sual analytics problems. As such, the framework is ideal for rapid prototyping and should serve as a productive base for more developments within LingVis, the interdisciplinary combination of, lin-guistics, NLP and visual analytics.
References
Miriam Butt, Annette Hautli-Janisz, and Verena Lyd-ing. 2019. LingVis: Visual Analytics for Linguistics. CSLI lecture notes. CSLI Publications, to appear.
Mennatallah El-Assady, Valentin Gold, Carmela Acevedo, Christopher Collins, and Daniel Keim. 2016. ConToVi: Multi-Party Conversation Explo-ration using Topic-Space Views. Computer Graph-ics Forum, 35(3):431–440.
Mennatallah El-Assady, Annette Hautli-Janisz, Valentin Gold, Miriam Butt, Katharina Holzinger, and Daniel Keim. 2017a. Interactive Visual Analy-sis of Transcribed Multi-Party Discourse. In Pro-ceedings of ACL 2017, System Demonstrations, pages 49–54, Stroudsburg, PA. ACL.
Mennatallah El-Assady, Rita Sevastjanova, Bela Gipp, Daniel Keim, and Christopher Collins. 2017b.
NEREx: Named-Entity Relationship Exploration in Multi-Party Conversations.Computer Graphics Fo-rum, 36(3):213–225.
Mennatallah El-Assady, Rita Sevastjanova, Daniel Keim, and Christopher Collins. 2018a. Thread-Reconstructor: Modeling Reply-Chains to Untan-gle Conversational Text through Visual Analytics. Computer Graphics Forum, 37(3):351–365.
Mennatallah El-Assady, Rita Sevastjanova, Fabian Sperrle, Daniel Keim, and Christopher Collins. 2018b. Progressive Learning of Topic Modeling Pa-rameters: A Visual Analytics Framework. IEEE Transactions on Visualization and Computer Graph-ics, 24(1):382–391.
Mennatallah El-Assady, Fabian Sperrle, Oliver Deussen, Daniel Keim, and Christopher Collins. 2019. Visual Analytics for Topic Model Optimiza-tion based on User-Steerable Speculative ExecuOptimiza-tion. IEEE Trans. on Visualization and Computer Graph-ics, 25(1):374–384.
Mennatallah El-Assady, Fabian Sperrle, Rita Sevast-janova, Michael Sedlmair, and Daniel Keim. 2018c.
LTMA: Layered Topic Matching for the Compar-ative Exploration, Evaluation, and Refinement of Topic Modeling Results. In International Sympo-sium on Big Data Visual and Immersive Analytics (BDVA), pages 1–10.
Valentin Gold, Christian Rohrdantz, and Mennatallah El-Assady. 2015. Exploratory Text Analysis using Lexical Episode Plots. InProc. of EuroVis., pages 85–89. The Eurographics Association.
Wolfgang Jentner, Mennatallah El-Assady, Bela Gipp, and Daniel A Keim. 2017. Feature Alignment for the Analysis of Verbatim Text Transcripts. In Eu-roVis Workshop on Visual Analytics, EuroVA 2017, Barcelona, Spain, 12-13 June 2017, pages 13–17. Eurographics Association.
Wolfgang Jentner, Dominik Sacha, Florian Stoffel, Ge-offrey P Ellis, Leishi Zhang, and Daniel A Keim. 2018. Making machine intelligence less scary for criminal analysts: reflections on designing a visual comparative case analysis tool. The Visual Com-puter, 34(9):1225–1241.
Daniela Oelke, David Spretke, Andreas Stoffel, and Daniel A. Keim. 2012. Visual readability analysis: How to make your writings easier to read. IEEE Transactions on Visualization and Computer Graph-ics, 18(5):662–674.
Dominik Sacha, Matthias Kraus, Jrgen Bernard, Michael Behrisch, Tobias Schreck, Yuki Asano, and Daniel A Keim. 2018. Somflow: Guided ex-ploratory cluster analysis with self-organizing maps and analytic provenance. IEEE transactions on vi-sualization and computer graphics, 24(1):120–130.
Christin Sch¨atzle, Michael Hund, Frederik L Dennig, Miriam Butt, and Daniel A Keim. 2017. Histo-BankVis: Detecting Language Change via Data Vi-sualization. InProceedings of the NoDaLiDa 2017 Workshop on Processing Historical Language, 133, pages 32–39. University of Konstanz, Germany.
Gerold Schneider, Mennatallah El-Assady, and Hans Martin Lehmann. 2017. Tools and Meth-ods for Processing and Visualizing Large Corpora. Studies in Variation, Contacts and Change in En-glish, 19.
Rita Sevastjanova, Fabian Beck, Basil Ell, Cagatay Turkay, Rafael Henkin, Miriam Butt, Daniel Keim, and Mennatallah El-Assady. 2018a. Going be-yond Visualization: Verbalization as Complemen-tary Medium to Explain Machine Learning Models.
Rita Sevastjanova, Mennatallah El-Assady, Annette Hautli-Janisz, Aikaterini-Lida Kalouli, Rebecca Kehlbeck, Oliver Deussen, Daniel Keim, and Miriam Butt. 2018b. Mixed-initiative active learn-ing for generatlearn-ing llearn-inguistic insights in question classification. InWorkshop on Data Systems for In-teractive Analysis (DSIA) at IEEE VIS.
Fabian Sperrle, J¨urgen Bernard, Michael Sedlmair, Daniel Keim, and Mennatallah El-Assady. 2018.