Munich Personal RePEc Archive
Stillbirths: How should its rate be
reported, its disability-adjusted-life-years
(DALY), and stillbirths adjusted life
expectancy
Kant, Chander
Seton Hall University, Kant Research
26 March 2019
1
Title
:
Stillbirths: How should its rate be reported, its
disability-adjusted-life-years (DALY), and stillbirths adjusted life expectancy
Author
:
Chander Kant, Ph.D.
(Sole and corresponding author)
Department of Economics, Seton Hall University
aPrincipal, Kant Research
bAbstract
Background
A 2016 study standardized the definition of stillbirths. It estimated the rate as a proportion of
total births. A 2015 paper addressed the problem of disability-adjusted life-years (DALY) for
stillbirths. There has been no adjustment of life expectancy at birth to account for stillbirths.
Methods and Results
We follow mathematical and computational methods, use algebra to derive relationships, and
large databases. We express the rate as a proportion of live births and use this rate to adjust life
expectancy at birth for stillbirths. We then use the difference between the traditional life
expectancy and stillbirths adjusted life expectancy (SALE) to obtain DALY for stillbirths for 194
countries, the Millennium Development Goal regions, and income groups.
We show defining
stillbirths’
rate as a proportion of live births
enhances stillbirths’ importance,
especially in poorer countries; negates some of its under-statement vis-a-vis neonatal mortality
rate, accentuates its decrease; and permits inference about relative magnitudes of stillbirths and
neonatal mortality from the two rates. Using it, we derive stillbirths adjusted life expectancy, and
suggest it reflects a more complete and accurate measure of comparative life expectancies of
different countries. Its difference from the traditional life expectancy is used to measure DALY
2
Conclusion
Stillbirths almost equals neonatal mortality yet have not received almost equal attention. We
hope highlighting them and adjusting
life expectancy for it
will spur health interventions so that
grand convergence of health outcomes in different countries can be more rapidly achieved. We
also believe SALE is a
more complete and accurate measure of comparative life expectancies.
Keywords
Different measures of stillbirth rates; Years of life lost due to stillbirths; A more complete
measure of life expectancy; Importance of stillbirths in poorer countries.
a
400 South Orange Avenue, South Orange, NJ 07078, U.S.A. E-mail address:
chander.kant@shu.edu; Tel.: 973-202-5964, Fax: 973-761-9217
b
1 Fielding Road, Short Hills, NJ 07078, U.S.A.; E-mail address: kant@kresearch.org, preferred;
3
Stillbirths: How should its rate be reported, its disability-adjusted-life-years
(DALY), and stillbirths adjusted life expectancy
1. Background
Health professionals, social scientists, and international organizations have not given as
much attention to stillbirths as to neonatal mortality. The first data-set for stillbirths in almost all
countries became available in 2006, and was for 2000, while that on neonatal mortality have
been available since 1990.
1, 2In 2011
stillbirth’s
data for 2008 and 2009 became available; and
were retrospectively estimated to 1995 for about 40% of the sample.
3The first international goal
on stillbirths (and neonatal mortality) was adopted in 2014.
4Using revised and updated
estimates, Blencowe and colleagues estimate 2.60 million stillbirths occur yearly.
5The stillborn rate arguably reflects a country
’s
quality of health care system to a greater
extent than life expectancy (since the latter is affected more by smoking, diet, exercise, public
sanitation and pollution) and can be an independent/supplementary health indicator. Causes of
stillbirths are not fully understood. In the US, about one-fourth of stillbirths are unexplained; and
stillbirths after 24 weeks of pregnancy are primarily due to pregnancy/birth related causes like
placenta/ umbilical cord problems, birth defects, and infection.
6In low income countries, where
about 98% of the stillbirths globally occur and almost half of the deliveries take place at home,
difficult, prolonged and obstructed labor, infections without adequate treatment, and lack of
trained obstetric care (compounded by 35-45% absenteeism of health and extension workers) are
the primary causes.
7, 8, 9Earlier studies define stillbirth as fetal death in third trimester with birthweight of 1000g
or more.
1, 3When birthweight is unavailable, 28 or more completed weeks of gestation is used
(or a length of
≥
35cm if the reported gestation age is not judged reliable). Blencowe and
4
countries by 15%, since fetal growth restriction causes many stillbirths.
5They use fetal death at
28 or more completed weeks of gestation as their exclusive definition. In poor countries, famine
increases stillbirths and fortifying pregnant
women’s diet with protein
-rich supplements reduces
stillbirths by as much as 38%.
10, 11, 12If mothers
’
under-nourishment during pregnancy causes
stillbirths, using birthweight lower than 1000g as the primary criterion will undercount stillbirths
in poor countries also. Accordingly, we follow fetal death at 28 or more completed
gestation-weeks as our exclusive definition. Using it also excludes voluntary abortion from stillbirths, and
protects women’s choice to terminate their pregnancies,
since abortion after 28 weeks is rare and
is mostly due to severe fetal abnormality or if pregnancy is
threatening mother’s life
.
13, 14In addition, “
[I]n terms of ethics the ethical concept of the fetus as a patient should
replace the discourse of "unborn chi
ld" when that phrase is used normatively.”
15“In term of
science it is well recognized that between 20 and 24 weeks, it is likely that the fetus
"experiences" touch and pain.”
16“The inability to communicate does not mean that there is no
pain or need of t
reatment.”
17Although viability in Western countries is between 22 - 24
gestational weeks, it is higher in low income countries; and 28 weeks is chosen as a pragmatic
cut-off limit to classify stillbirths.
The World Health Organization (WHO) notes the widespread perception that stillbirths
are unavoidable due to congenital abnormalities.
1It finds it to be untrue - estimating only 7.4%
of stillbirths after 28 weeks are due to such factors. Its wide variation among countries (as shown
following) also belies the perception of congenital abnormalities being the primarily cause.
The aim and purpose of this paper is to i) highlight the stillbirth rate that is defined
consistent with neonatal mortality rate, ii) use it to adjust life expectancy at births to account for
5
is a kind of review proposing new aspects for classification.
2.1.A
.
Methods: Stillbirth rate defined consistent with neonatal mortality rate
There is no consistency among various authors on how they define the stillbirth rate.
Some report it (like neonatal mortality) as a proportion of live births.
18Others, while noting its
definition varies among countries and even among states of the US, define it as a proportion of
total (= still + live) births.
19Blencowe and colleagues estimate stillbirth rates based on 2207 data points.
5They do not
break-up data into whether it reported stillbirth rate as a proportion of total or of live births.
Since it is natural to define all rates (stillbirths, neonatal, infant, and child mortality) included in
a study similarly, it is unlikely all 2207 data points would report stillbirth rate as a proportion of
total births. Their definition is apparently based ultimately on Goldenberg and colleagues.
20, 21Goldenberg and colleagues summarize key findings in the previous five reports in
Lancet’s 2011
Stillbirth Series.
22, 23, 24, 25, 26They
define stillbirth rate as “per 1000 births,” not as “per 1000 total
births,
” at eight places,
including in their Conclusion and Call to Action. Since the commonly
accepted meaning of “births” is “live births
,
” by “per 1000 births,” they must mean “per
1000
live births.”
International statistical classification of diseases terms stillbirths (
SB
) as a proportion of
live births (
LB
)
“fetal death ratio
;
”
and calls stillbirths as a proportion of total births (
TB
=
SB
+
LB
)
“fetal death rate.”
27It encourages both to be reported and requires the denominator to be
always specified. Specifying the denominator in the definition itself, we term the two as still live
birth rate (
SLBR = SB/LB
) and still total birth rate (
STBR = SB/TB
), respectively.
Using our nomenclature, Blencowe and colleagues provide data for
STBR.
5Mortality
6
mortality rates (
NMR =NM/LB
) while fetal deaths with the same gestational age are excluded
from
STBR -
since it includes stillbirths only after 28 weeks
gestational age. That understates
stillbirth rate
’s
magnitude vis-à-vis
NMR
. Dividing stillbirths by a bigger number (total births)
and neonatal mortality by a smaller number (live births) compounds its understatement.
We can show the difference between
SLBR
and
STBR
is
SLBR
–
STBR
=
SLBR
×
STBR/
1000
> 0
(1),
the two rates either both decrease or both increases, and when they decrease, the rate of decline in
SLBR
must be greater than that in
STBR
(see, Additional file 1).
(1) tells us greater the
SLBR,
greater is its excess over
STBR.
For richer countries where
the stillbirth rates are low,
SLBR
and
STBR
will be quite close; but for poorer countries where they
are high, the excess of
SLBR
over
STBR
will be significant.
To infer about the relative numbers of stillbirths and neonatal mortality from their
relative rates requires that both adverse events be divided by the same number. That requirement
is met when
SLBR = SB/LB
is used in the stillbirth rate to
NMR
ratio but not when
STBR= SB/TB
is used.
Stillbirth rate to
NMR
ratio when
SLBR
is used = (
SB/LB
) ÷ (
NM/LB
) =
SB/NM
(2),
while
Stillbirth rate to
NMR
ratio when
STBR
is used = (
SB/TB
) ÷ (
NM/LB
) = (
SB/NM) ×
(
LB/TB
) (3).
Since (
LB/TB
) < 1, stillbirth rate to
NMR
ratio when
STBR
is used is smaller than when
SLBR
is used in the ratio instead.
Blencowe and colleagues use
STBR
:
NMR
ratio of less than 0.33 to exclude 156 data
points on grounds that a ratio so low is implausible; and use this ratio of greater than 0.5 as one
7
STBR
:
NMR
ratio
does not equal
SB
:
NM,
as
Blencowe and colleagues mistakenly imply;
SLBR
:
NMR
does. This distinction needs to be recognized.
2.1.B. Results of defining stillbirth rate consistent with neonatal mortality rate
Table 1 compares
SLBR
to
STBR
for countries with the ten highest stillbirth rates in 2015.
Results for all countries are given in Additional file 2. They show excess of
SLBR
over
STBR
is
approximately two for Pakistan and Nigeria and between one and two for 12 other countries.
SLBR
is higher than 30 for 14 countries (compared to 13 for
STBR
); its decrease is greater than
that in
STBR
by about one percentage point for some countries. See, Additional file 2.
<Place Table 1 here.>
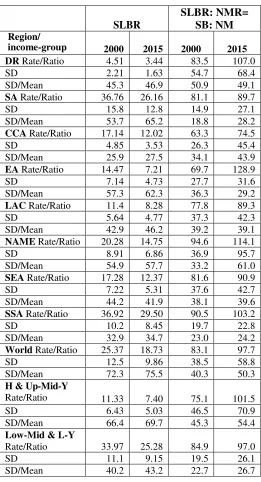
Table 2 provides
SLBR
and
SLBR
:
NMR
ratio for 2000 and 2015 by Millennium
Development Goal (MDG) regions and two income groupings: 1) high and upper mid income
(richer) and 2) lower mid and low income (poorer). It also provides within region/group standard
deviation and dispersion measured as standard deviation/mean (i.e., coefficient of variation),
because the means are different. Table 2 shows
SLBR
declined for each region, signifying
success. The failure is the increase in its dispersion everywhere (except one region). The
increased dispersion is not accounted for anywhere in the recent stillbirth study.
5<Place Table 2 here.>
Table 2 shows
SLBR
:
NMR
ratio has increased in every region/income group and shows
great variation both among regions and over time. E.g., in 2015, in the Caucasus and Central
Asia, there were approximately 75 stillbirths for every 100 neonatal deaths; whereas in Eastern
Asia, the corresponding number was approximately 130. Eastern Asia also experienced almost
doubling of the
SLBR
:
NMR
ratio from 2000 to 2015. This variation across regions and over time
8
Comparing progress by two country-income groups, the absolute reduction in poorer (i.e.,
lower-middle and lower income)
countries’
stillborn rate from 2000 to 2015 (ignoring the
negative signs) is 8.69 (= 25.28 - 33.97) and proportionate/percentage reduction is 25.6% (=
8.69/33.97); while the corresponding numbers for richer (i.e., high and upper-middle income)
countries are 3.93 (= 7.40 - 11.33) and 34.7% (= 3.93/11.33), respectively. That is, the
percentage reduction, or the rate of decrease, in poorer countries
’
stillborn rate is smaller than
that in richer countries.
The
SLBR
:
NMR
ratio for both groups increase; but that for the richer group increases by
25.6 (= 101.5 - 75.1) and 35.1% (= 25.6/75.1) versus 12.1 (= 97.0 - 84.9) and 14.3% (=
12.1/84.9) for poorer countries. That is, the percentage increase, or the rate of increase, in this
ratio is greater for richer countries than for poorer countries.
Let, g (
SLBR
:
NMR
), g(
SLBR
) and g(
NMR
) represent the rates of change in
SLBR
:
NMR
,
SLBR
, and
NMR,
respectively. Then, we can show that
g (
SLBR
:
NMR
) = g(
SLBR
) - g(
NMR
)
(4), or
g(
NMR
) = g(
SLBR
) - g (
SLBR
:
NMR
)
(
4́
)
Using the above relationship, we can see the richer countries’ NMR
also decreases by a
greater percentage, disregarding the negative sign, of 69.8 (= - 34.7% - 35.1%), or at a greater
rate,
than for poorer countries’
39.9 (= - 25.6% - 14.3%). The richer countries, where the 2000
rates were already much lower, achieve a greater proportionate reduction in both rates.
The Newborn Action Plan notes encouragingly that 11 poorer countries have reduced
their
NMR
by more than 40% since 2000.
4By 2015, a total of 25 (not 11) such countries had
passed the 40% threshold (average reduction 46.7%). At the same time, 49 richer countries had
9
richer countries have achieved a greater than 40% reduction in their
NMR
than
poorer countries;
and achieved a greater reduction. The poorer countries have taken on and made some progress in
an immense task. Yet, richer countries have made even more of a progress - indicating great
scope of progress that is possible for poorer countries.
2.2.A. Methods: adjusting life expectancy to account for stillbirths
and using it to obtain DALY for stillbirths
The traditional life expectancy at birth (
LE
), also called life expectancy of live births
(
LELB
) here, includes premature births and neonates who may live no longer than an hour or a
day. The stillborn can occur either antepartum (before labor or delivery) or intrapartum (during
labor or delivery); and are highly sensitive to access to timely high-quality antenatal and
intrapartum monitoring and care
.
540-45% of stillbirths, namely 1.17 million of 2.60 million total
stillbirths, are intrapartum.
20, 28This number is greater than 1.01 million live newborns who die
within the first 24 hours (36% of total neonatal deaths).
29These deaths occur rapidly, and the
first minute after a
n infant is born
—
the so-called golden minute
—
is the crucial window for
neonatal resuscitation for the 10 million non-breathing infants born annually.
20The implications
are: i) millions of non-breathing neonates are successfully resuscitated; ii) which death is
stillbirth and which is neonatal can be subject to considerable error. These errors are more likely
when births take place at home
–
as is common in rural areas of South Asia and Sub-Saharan
Africa (the primary regions where most stillbirths occur).
29Variation in classification of neonatal mortality and stillbirths at the local level impacts
the reported stillbirths and infant mortality rates.
30Dearth of females in population cohorts since
the late 1930s in China has been ascribed to female losses occurring very early in life.
31Such
female live births are simply not reported or reported as stillborn. The Helping Babies Breathe
10
countries, reduced stillbirth rates by 31%.
32, 33We are not proposing that population, that
includes all premature live births, include the stillborn. Nevertheless, millions of stillborn, who,
by definition, are after 28 weeks of gestation, are simply ignored in the life expectancy measure.
We include stillbirths in vital statistics of life expectancy by adjusting it for stillbirths - calling
the result stillbirths adjusted life expectancy,
SALE
.
Life expectancy of 1000 live births is 1000 ×
LELB
. Dividing this product by 1000 plus
the still live-birth rate,
SLBR
, gives us the life expectancy of total (= still + live) births,
LETB,
or
stillbirths adjusted life expectancy,
SALE
.
SALE = LETB = (
1000 ×
LELB
)/ (1000 +
SLBR
)
(5)
For a country with no stillbirths,
SLBR
is zero and
SALE = LE
. For almost every
country, stillbirths are positive, and
SALE < LE
. The difference between the two reflects
decrease in life expectancy when stillbirths are also considered. Suppose
LELB
is 71 years, and
SLBR
is 13. Then, (5) would mean dividing 71,000 (life expectancy of 1000 live births) by 1013,
rather than by 1000. The resulting number being approximately 70 years, the reduction in life
expectancy by 1 year is solely due to dividing 71,000 by 1013; i.e., by including the number of
stillbirths per 1000 live births in the denominator.
Now we discuss why stillbirths should be include in DALY, and how we obtain DALY
for stillbirths.
DALY, while estimating life years lost due to mortality and morbidity, is also used for
prioritizing health care spending.
35Stillbirths are neither included in it nor in the global tracking
mechanism such as the Global Burden of Disease estimates. Part of this reluctance may have
been due to lack of reliable data on stillbirths in poorer and middle-income countries. Data on its
11
data for stillbirths became available only in 2006.
1, 2The protein-supplemental study cited above
found it decreased low-weight live births by 32% also (in addition to reducing stillbirths by
38%).
12If stillbirths are included in DALY, nutrition and medical interventions focused on
pregnant mothers may yield benefits in potential DALY reduction that are two to ten times, and
potential cost per DALY reduction one-half to one-tenth.
36Since DALY is an important
population health measure, not counting
stillbirth’s
reduction in DALY estimates will also yield
anomalous situations where a population with a neonatal mortality reduction, whether or not
achieved by moving prenatal care resources to post-natal, is considered healthier even if its
incidence of late-gestation stillbirths increases.
Other substantive arguments for including stillbirths in DALY estimates are as follows.
The current practice violates one of the four general principles underlying DALYs, namely
“treating like outcomes as like.”
34A 28 gestational-age fetus that is stillborn and one that dies ten
minutes after live birth are essentially like outcomes. Yet, the former is not included in DALY
estimates while the latter is. We have discussed above how following fetal death at 28 or more
completed gestation-weeks as our exclusive definition of stillbirths
protects women’s
rights and
choice to terminate their pregnancies. Including stillbirths in DALY estimates will spur
interventions to reduce it - interventions that predominantly focus on
pregnant mother’s health
,
wellbeing, and prenatal and partum care -
and will enhance women’s rights
and condition.
37Normally, DALY for premature mortality, or Years of Life Lost (YLL) due to premature
mortality in the population, corresponds to the number of deaths multiplied by the life
expectancy at the age at which death occurs.
38This method cannot be used for stillbirths since
12
decrease in life expectancy when stillbirths are also considered by the number of live births.
That is,
DALY or YLL of stillbirths =
LE
–
SALE =
|
SALE
–
LEI
| ×
LB
(6)
Additional file 1 shows the following:
|
SALE
–
LE
|
=
SLBR
×
LE/
(1000 +
SLBR
) > 0
(7),
and greater is the
SLBR
and/or greater is the
LE
, greater is
LE
’s
excess over
SALE.
Both factors in
(7) are important: a) Greater the stillbirth rate, more life-years are lost due to stillbirths; b)
greater the life expectancy (of live births), the more life-years are lost because a birth is still
rather than live.
A recent study (as far as I know the only paper so far suggesting how DALY for
stillbirths should be estimated), implicitly assuming life expectancy of a still birth equals that of
a live birth, has suggested “
the disvalue attached to a fetal death should gradually increase from
zero, at 28 weeks gestational age, to a value equaling that of the death of a [fully developed]
newborn infant, at the time of birth
,”
36That is, DALY of stillbirths should be zero, or let us say
0.01, at 28 weeks gestational age increasing to 1.00 at full-term; or increasing 100 times. Since a
fetus does not develop 100 times from 28 weeks to full-term, this proposal is counter-intuitive
and against medical evidence. At 28 weeks gestational age, survival without major morbidity for
infants surviving to discharge is closer to one (it is 0.59) than to zero.
39In a situation where most
of the stillbirths (and pre-term neonatal mortality) take place in poor countries where the
gestation age at mortality between 28 to 39 weeks are not certain, attempting precision in DALY
estimation (which perforce has to make bold assumptions in valuing vastly disparate morbidity)
more than in our proposal above will not be productive. In addition, this proposal suffers from its
13
Stillbirths (like neonatal mortality) also cause parental suffering and psychological
distress and may affect
parents’
life spans. Data for these effects is limited, especially in low
income countries.
40If available, it will be challenging to add it to measure like DALY of
stillbirths. Nevertheless, this effect needs to be recognized.
2.2.B. Results: adjusting life expectancy to account for stillbirths
and using it to obtain DALY for stillbirths
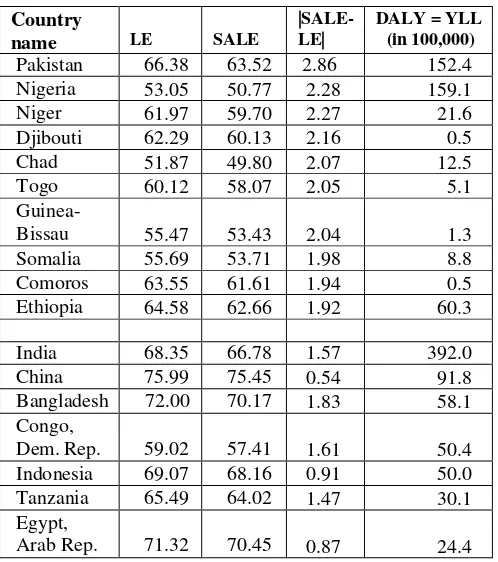
Table 3, Panel A summarizes results (from Additional file 3) for 10 countries with largest
decrease in life expectancy due to stillbirths. Its Panel B summarizes results for countries with
ten largest DALY of stillbirths that are not included in Panel A. Decrease in life expectancy due
to stillbirths is as high as approximately 3 years for Pakistan and approximately 2 (between 1.69
and 2.28) years for 17 other countries. Panel B shows India, with 39.2 million years, has the
highest DALY of stillbirths. Its loss exceeds the sum of the next two countries, Nigeria and
Pakistan, and is more than four times that in China. Other countries in the top 10 DALY group
are Ethiopia, Bangladesh, Congo, Indonesia, Tanzania, and Egypt.
<Place Table 3 here.>
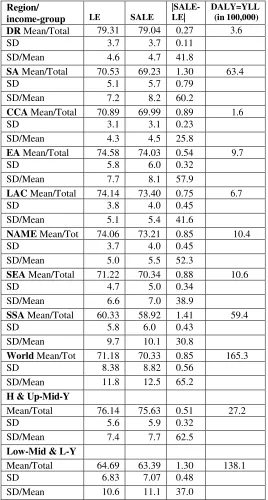
Table 4 presents results by MDG region and by two country-income groups, richer and
poorer. The worldwide mean decreases in life expectancy due to considering stillbirths is 0.85
years. Regions with mean decrease significantly higher and lower than the world average are, for
higher: Southern Asia (1.30 years) and Sub-Saharan Africa (1.41 years), and for lower:
developed region (0.27 years) and Eastern Asia (0.54 years). The variability of this decrease,
measured by standard deviation of the decrease scaled by the mean (since the means are
different), among countries in a region is the lowest in the Caucasus and Central Asia (25.8) and
SubSaharan Africa (30.8), and highest in Southern Asia (60.2) and Eastern Asia (57.9)
14
DALY = years of lost life due to stillbirths was 165.3 million years in 2015. Of this, 122.3
million (74%) are in Southern Asia and Sub-Saharan Africa. By income, 138 million (83.5 %) of
DALY due to stillbirths are in poorer countries.
<Place Table 4 here.>
The gap between average life expectancies between the developed region (rich) and Sub
Saharan Africa (poor) is 18.98 years (= 79.31 - 60.33) for
LE;
and 20.12 years for
SALE
(= 79.04
- 58.92). We can describe the health convergence objective in two alternative ways: i) poor
countries need to increase their life expectancy of live births by approximately 19 years and
decrease their still live-birth rate from 29.50 to 3.44 (see, Table 2); or ii) they need to increase
their stillbirths adjusted life expectancy by approximately 20.1 years. In some sense, the second
may be preferred since it directly incorporates the stillbirth objective in the life expectancy
measure. Because many neonatal deaths, 40% of which occur on the first day of life, are
misreported as stillbirths, incorporating stillbirths may also reflect a more accurate (and
complete) measure of life expectancy.
3. Conclusion
Main Findings: Stillbirths almost equals neonatal mortality yet have not received almost
equal attention. Defining
stillbirths’
rate as a proportion of live births
enhances stillbirths’
importance, especially in poorer countries; and negates some of its under-statement vis-a-vis
neonatal mortality rate. We employ this definition to adjust life expectancy for stillbirths; and
propose the
latter to get stillbirths’ DALY that equal 165.3 million years.
Meaning of the Findings, Research Implications: Stillbirth rate arguably reflects a
country
’s
quality of health care system to a greater extent than life expectancy; and stillbirths
15
expectancies. Including it in DALY will lead to better priorities in health care spending.
Highlighting stillbirths and adjusting
life expectancy for it
will spur research on stillbirths whose
causes are not well understood.
Clinical and Health Implications: Some key interventions such as syphilis treatment in
pregnancy, fetal heart monitoring, and labor surveillance could be crucial in preventing
intrapartum stillbirths.
3In low income countries, only a minority of deliveries occur in health
facilities or with the assistance of a trained personnel. This is due to both inadequate resources
and absenteeism of health workers.
9, 10The implication is need for both more resources and
better governance. Further, resuscitation training of health care workers in poorer countries is
sorely needed.
Strength and Weaknesses:
The paper’s strengths are a) highlighting that having different
divisors for stillbirths and neonatal mortality rates may give inconsistent results. and b)
traditional life expectancy suffers from the limitation that what is stillbirth and what is a live
birth is subject to considerable error. Its weakness is that data on stillbirths are not estimated by
UN Inter-agency Group for Child Mortality Estimation, childmortality.org. If the latter estimates
stillbirths while appraising its neonatal mortality numbers, the estimates of both are likely to
improve.
In 2016, the definition of stillbirths was standardized to mean fetal loss after 28 weeks of
gestation.
5It defined stillbirth rate as a proportion of total (still + live) births. We are proposing it
be called still total birth rate, and what international statistical classification of diseases terms
“fetal death ratio,”
(stillbirths as a proportion of live births) be called still live birth rate.
27The
16
derive stillbirths adjusted life expectancy. Its difference from the traditional life expectancy
reflects DALY for stillbirths that totals 165.3 million years worldwide.
There has been a call for better prenatal, natal, and neonatal health monitoring and
improved
data definitions
/methods with consistent metrics.
21There are triple benefits from such
attention: benefits i) for stillbirths, ii) for neonatal deaths, and iii) for mothers; life complications
and disability may also be reduced.
21Stillbirths in poorer countries are another dimension of
health that needs to be addressed when seeking, hopefully rapid, grand convergence to health
outcomes in richer countries. A stillbirth-incorporated definition of the widely used life
expectancy measure will attract more attention to stillbirth. Life expectancy at birth ignores
morbidity and is a “very imperfect measure of health.”
41Adjusting it for stillbirths will also
17
List of abbreviations
DALY = Disability-adjusted life-years
SALE = Stillbirths adjusted life expectancy
MDG = Millennium development goals
SB = Number of still births
LB = Number of live births
TB = Number of total (= still + live) births
SLBR = Still live birth rate (= SB/LB)
STBR = Still total (= still + live) birth rate (= SB/TB)
NMR = Neonatal mortality rate
NM = Number of neonatal mortalities
LE = LELB = Life expectancy of live births
LETB = Life expectancy of total (= still + live) births = SALE
18
Declarations
Ethics approval and consent to participate
Not applicable
Consent for publication
Not applicable
Availability of data and material
The datasets analyzed during the current study are available (and no (administrative)
permission is required to use/reuse them) in the
a) Supplementary Material to Blencowe et al. (2016) Blencowe H, Cousens S, Jassir F-B,
et al. (2016) National, regional, and worldwide estimates of stillborn rates in 2015, with
trends from 2000: a systematic analysis.
Lancet Globl Health
4: e98
–
108.
https://www.thelancet.com/journals/langlo/article/PIIS2214-109X(15)00275-2/fulltext#seccestitle190
b) World Bank. World Development Indicators. The World Bank. Washington, D.C.
https://data.worldbank.org/indicator/SP.DYN.IMRT.IN
https://data.worldbank.org/indicator/sp.dyn.le00.in
c) UN Inter-agency Group for Child Mortality Estimation (UNICEF, WHO, World
Bank, UN DESA Population Division) - for neonatal mortality rate and numbers for
Cook Islands
childmortality.org
d) U.S. Census Bureau: International Database - for life expectancy numbers for Marshall
Islands and Palau
https://www.census.gov/programs-surveys/international-programs/about/idb.html
Competing interests
19
Funding
This research did not receive any specific grant from funding agencies in the public,
commercial, or not-for-profit sectors.
Authors' contributions
CK is the sole author of this article, he alone is responsible for the content and the views
expressed in this article
Acknowledgements
1
Endnotes
1. WHO. Neonatal and perinatal mortality, country, regional and global estimates. World Health
Organization, Geneva; 2006. 2. Child Mortality Estimates, http://www.childmortality.org
3.
Cousens S, Blencowe H, Stanton C, Chou D, Ahmed S, et al. National, regional, and worldwide
estimates of stillborn rates in 2009 with trends since 1995: a systematic analysis. Lancet.
2011;377:1319
–
30. 4. WHO, UNICEF. Every Newborn: An action plan to end preventable deaths.
World Health Organization, Geneva; 2014. 5. Blencowe H, Cousens S, Jassir FB, Say L, Chou D,
et al. National, regional, and worldwide estimates of stillborn rates in 2015, with trends from 2000:
a systematic analysis. Lancet Globl Health. 2016;4:e98
–
108. 6. The Stillbirth Collaborative
Research Network Writing Group. Causes of death among stillbirths. JAMA. 2011;306(22):2459
–
68. 7. McClure, EM, Goldenberg, RJ. Stillbirth in developing countries: A review of causes, risk
factors and prevention strategies. J Matern. Fetal Neonatal Med. 2009;22(3):183
–
90. 8. Banerjee
A, Deaton A, Duflo E. Wealth, health, and health services in rural Rajasthan. Am Econ Rev.
2004;94(2):326
–
30. 9. Chaudhury N, Hammer J, Kremer M, Muralidharan, K, Rogers, FH.
Missing in action: Teacher and health worker absence in developing countries. J Econ Perspect.
2006;20(1):91
–
116. 10. Hernandez-Julian R, Mansour H, Peters C. The effects of intrauterine
malnutrition on birth and fertility outcomes: evidence from the 1974 Bangladesh famine.
Demography. 2014;51(5):1775-96. 11. Cai Y, Wang F. Famine, social disruption, and involuntary
fetal loss: evidence from Chinese survey data. Demography. 2005;42(2):301-22. 12
.
Imdad A,
Bhutta Z. Maternal nutrition and birth outcomes: effect of balanced protein-energy
supplementation. Pediatric and Perinat Epidemiol. 2012;26(Suppl. 1):178
–
190. 13. Jatlaoui TC,
Ewing A, Mandel MG, Simmons KB, Suchdev DB, et al. Abortion surveillance
—
United States,
2
The limitations of U.S. statistics on abortion. January 1, 1997. 15. McCullough LB, Chervenak,
FA. A critical analysis of the concept and discourse of 'unborn child'. Am J Bioeth.
2008;8(7):34-9. 16. Lloyd-Thomas AR, Fitzgerald M. Do fetuses feel pain? Reflex responses do not necessarily
signify pain. BMJ. 1996;313(7060):797-8. 17. Anand KJ, Aranda JV, Berde CB, Buckman S,
Capparelli EV, et al. Summary proceedings from the neonatal pain-control group. Pediatrics.
2006;117(3 Pt2):S9-22. 18
.
Nielsen BB, Liljestrand J, Hedegaard M, Thilsted SH, Joseph A.
Reproductive pattern, perinatal mortality, and sex preference in rural Tamil Nadu, South India:
community based, cross sectional study. BMJ. 1997;314:1521
–
24. 19. Woods R Long-term trends
in fetal mortality: implications for developing countries. Bull World Health Organ.
2008;86(6):417-496. 20. Lawn JE, Blencowe H, Oza S, You D, Lee ACC, et al. Every Newborn:
Progress, priorities, and potential beyond survival. Lancet. 2014;384:189-205. 21. Goldenberg
RL, McClure EM, Bhutta ZA, Belizan JM, Reddy UM,
et al, and the Lancet’s Stillbirths Series
steering committee. Stillbirths: the vision for 2020. Lancet. 2011;377:1798
–
805. 22. Lawn JE,
Blencowe H, Pattinson R, Cousens S, Kumar R, et al for
The Lancet’s Stillbirths Series steering
committee. Stillbirths: Where? When? Why? How to make the data count? Lancet. Published
online April 14, 2011; DOI:10.1016/S0140-6736(10)62187. 23. Frøen JF, Cacciatore J, McClure
EM, Kuti O, Jokhio AH, et al for T
he Lancet’s Stillbirths Series steering committee. Stillbirths:
why they matter. Lancet. Published online April 14, 2011; DOI:10.1016/S0140-
6736(10)62232-5. 24. Bhutta ZA, Yakoob MY, Lawn JE, Rizvi A, Friberg IK,
et al, for The Lancet’s Stillbirths
Serie
s steering committee. Stillbirths: what difference can we make and at what cost? Lancet
.
Published online April 14, 2011; DOI:10.1016/S0140-6736(10)62269-6 25. Pattinson R, Kerber
K, Buchmann E, Friberg IK, Belizan M, et al.
for The Lancet’s Stillbirths S
eries steering
3
online April 14, 2011; DOI:10.1016/S0140-6736(10)62306-9 26. Flenady V, Middleton P, Smith
GC, Duke W, Erwich JJ,
et al. for The Lancet’s Still
births Series steering committee. Stillbirths:
the way forward in high-income countries. Lancet. Published online April 14, 2011;
DOI:10.1016/S0140-6736(11)60064-0. 27. WHO. International statistical classification of
diseases and related health problems, 10th revision, Vol. 2, Instruction manual. Geneva, 1993,
Fifth Edition 2016 28. Save the Children. Surviving the first day. State of the world’s mothers.
Save the Children, 2013. 29. Lawn JE, Kinney MV, Black RE, Pitt C, Cousens S, et al. Newborn
survival: a multi-country analysis of a decade of change. Health Policy Plan. 2012;27(suppl
3):iii6
–
28. 30. Woods CR, Davis DW, Duncan SD,
Myers JA, O’Shea TM.
et al. Variation in
classification of live birth with newborn period death versus fetal death at the local level may
impact reported infant mortality rate. BMC Pediatr. 2014;14:108. 31. Coale AJ, Banister J (1994)
Five decades of missing females in China. Demography. 1994;31(3):459-79. 32. Msemo G,
Massawe A, Mmbando D, Rusibamavila N, Manji K, et al. Newborn mortality and fresh stillbirth
rates in Tanzania after helping babies breathe training. Pediatrics. 2013;131(2):e353-60. 33. Carlo
WA, Goudar SS, Jehan I, Chomba E, Tshefu A, et al. Newborn-care training and perinatal
mortality in developing countries. N England J Med. 2010;362(7):614-23. 34. Murray CJL, Lopez
AD, eds. The global burden of disease: a comprehensive assessment of mortality and disability
from diseases, injuries, and risk factors in 1990 and projected to 2020. Cambridge: Harvard
University Press; 1996. 35. Bobadilla J, Cowley P, Musgrove P, Saxenian H. Design, content, and
packaging of an essential national package of health services. Bull World Health Organ.
1994;72:653
–
662. 36. Phillips J, and Millum, J. Valuing Stillbirths. Bioethics.
4
birth and stillbirth (3 of 7): Evidence for effectiveness of interventions. BMC Pregnancy
Childbirth. 2010; 10(Suppl 1):s3. 38. WHO Metrics: Disability-Adjusted Life Year (DALY),
http://www.who.int/healthinfo/global_burden_disease/metrics_daly/en/, downloaded November
12, 2018. 39. Stoll B J, Hansen NI, Bell EF, Walsh MC, Carlo WA, et. al. and Eunice Kennedy
Shriver National Institute of Child Health and Human Development Neonatal Research Network.
Trends in care practices, morbidity, and mortality of extremely preterm neonates, 1993-2012.
JAMA. 2015;Sep 8;314(10):1039-51. 40. Heazell AE, Siassakos D, Blencowe H, Burden C, Butta
ZA, et al. Stillbirths: economic and psychosocial consequences. Lancet. 2016;387:604-16. 41.
Jones CI, and Klenow PJ. Beyond GDP? Welfare across countries and time. Am Econ Rev.
i
Table 1: Countries with ten highest stillbirth rates
Country name
SLBR
STBR SLBR-STBR
Pakistan
45.09
43.15
1.94
Nigeria
44.81
42.89
1.92
Chad
41.58
39.92
1.66
Guinea-Bissau
38.10
36.70
1.40
Niger
38.07
36.67
1.40
Somalia
36.80
35.49
1.31
Djibouti
35.85
34.61
1.24
Central African Republic
35.59
34.37
1.22
Togo
35.36
34.15
1.21
Mali
33.63
32.53
1.10
ii
Table 2: SLBR & SLBR: NMR by region & income-group
SLBR
SLBR: NMR=
SB: NM
Region/
income-group
2000
2015
2000
2015
DR
Rate/Ratio
4.51
3.44
83.5
107.0
SD
2.21
1.63
54.7
68.4
SD/Mean
45.3
46.9
50.9
49.1
SA
Rate/Ratio
36.76
26.16
81.1
89.7
SD
15.8
12.8
14.9
27.1
SD/Mean
53.7
65.2
18.8
28.2
CCA
Rate/Ratio
17.14
12.02
63.3
74.5
SD
4.85
3.53
26.3
45.4
SD/Mean
25.9
27.5
34.1
43.9
EA
Rate/Ratio
14.47
7.21
69.7
128.9
SD
7.14
4.73
27.7
31.6
SD/Mean
57.3
62.3
36.3
29.2
LAC
Rate/Ratio
11.4
8.28
77.8
89.3
SD
5.64
4.77
37.3
42.3
SD/Mean
42.9
46.2
39.2
39.1
NAME
Rate/Ratio
20.28
14.75
94.6
114.1
SD
8.91
6.86
36.9
95.7
SD/Mean
54.9
57.7
33.2
61.0
SEA
Rate/Ratio
17.28
12.37
81.6
90.9
SD
7.22
5.31
37.6
42.7
SD/Mean
44.2
41.9
38.1
39.6
SSA
Rate/Ratio
36.92
29.50
90.5
103.2
SD
10.2
8.45
19.7
22.8
SD/Mean
32.9
34.7
23.0
24.2
World
Rate/Ratio
25.37
18.73
83.1
97.7
SD
12.5
9.86
38.5
58.8
SD/Mean
72.3
75.5
40.3
50.3
H & Up-Mid-Y
Rate/Ratio
11.33
7.40
75.1
101.5
SD
6.43
5.03
46.5
70.9
SD/Mean
66.4
69.7
45.3
54.4
Low-Mid & L-Y
Rate/Ratio
33.97
25.28
84.9
97.0
SD
11.1
9.15
19.5
26.1
SD/Mean
40.2
43.2
22.7
26.7
iii
Table 3: Countries with highest i) decrease in life
expectancy due to stillbirths, and ii) DALY of stillbirths
Country
name
LE SALE|SALE- LE|
DALY = YLL (in 100,000)
Pakistan
66.38
63.52
2.86
152.4
Nigeria
53.05
50.77
2.28
159.1
Niger
61.97
59.70
2.27
21.6
Djibouti
62.29
60.13
2.16
0.5
Chad
51.87
49.80
2.07
12.5
Togo
60.12
58.07
2.05
5.1
Guinea-
Bissau
55.47
53.43
2.04
1.3
Somalia
55.69
53.71
1.98
8.8
Comoros
63.55
61.61
1.94
0.5
Ethiopia
64.58
62.66
1.92
60.3
India
68.35
66.78
1.57
392.0
China
75.99
75.45
0.54
91.8
Bangladesh 72.00
70.17
1.83
58.1
Congo,
Dem. Rep.
59.02
57.41
1.61
50.4
Indonesia
69.07
68.16
0.91
50.0
Tanzania
65.49
64.02
1.47
30.1
Egypt,
Arab Rep.
71.32
70.45
0.87
24.4
iv
Table 4: Stillbirth-caused decrease in life expectancy and
DALY or years of life lost by region & income-group
Region/
income-group
LE SALE|SALE- LE|
DALY=YLL (in 100,000)
DR
Mean/Total
79.31
79.04
0.27
3.6
SD
3.7
3.7
0.11
SD/Mean
4.6
4.7
41.8
SA
Mean/Total
70.53
69.23
1.30
63.4
SD
5.1
5.7
0.79
SD/Mean
7.2
8.2
60.2
CCA
Mean/Total
70.89
69.99
0.89
1.6
SD
3.1
3.1
0.23
SD/Mean
4.3
4.5
25.8
EA
Mean/Total
74.58
74.03
0.54
9.7
SD
5.8
6.0
0.32
SD/Mean
7.7
8.1
57.9
LAC
Mean/Total
74.14
73.40
0.75
6.7
SD
3.8
4.0
0.45
SD/Mean
5.1
5.4
41.6
NAME
Mean/Tot
74.06
73.21
0.85
10.4
SD
3.7
4.0
0.45
SD/Mean
5.0
5.5
52.3
SEA
Mean/Total
71.22
70.34
0.88
10.6
SD
4.7
5.0
0.34
SD/Mean
6.6
7.0
38.9
SSA
Mean/Total
60.33
58.92
1.41
59.4
SD
5.8
6.0
0.43
SD/Mean
9.7
10.1
30.8
World
Mean/Tot
71.18
70.33
0.85
165.3
SD
8.38
8.82
0.56
SD/Mean
11.8
12.5
65.2
H & Up-Mid-Y
Mean/Total
76.14
75.63
0.51
27.2
SD
5.6
5.9
0.32
SD/Mean
7.4
7.7
62.5
Low-Mid & L-Y
Mean/Total
64.69
63.39
1.30
138.1
SD
6.83
7.07
0.48
SD/Mean
10.6
11.1
37.0
Notes: LE and SALE stand for the traditional life expectancy and stillbirths adjusted life expectancy, respectively, and are for 2015 above. Traditional life expectancy data is from World Development Indicators (WDI). Difference between the two measures decrease in life-expectancy due to considering stillbirths. SD and mean are of corresponding numbers of
v
H & Up-Mid-Y = high and upper middle income, Low-Mid & L-Y = lower middle and low income. SD/mean is expressed as a % (with % sign not written).
vi
Additional file list
Additional file 1: Mathematical derivations; format: .pdf
Additional file 2: Still live-birth and total-birth rates, and SLBR:NMR ratio, 2000 and 2015, by
country; format: .pdf
Additional file 1: Mathematical derivations
The equations for the two stillbirth rates are:
STBR
= SB × 1000/(
LB
+
SB
)
(A1)
SLBR
=
SB
× 1000/
LB
(A2)
Multiplying and dividing the right-hand side of (A1) by
LB
, we have
STBR
=
SB
× 1000 ×
LB
/(
LB
+
SB
) ×
LB,
or
STBR
=
SLBR
×
LB
/(
LB
+
SB
)
(A
1́
)
Subtracting the RHS of (A
1́
), that equals
STBR
, from
SLBR
, we get
SLBR
–
STBR = SLBR -
[
SLBR
×
LB
/(
LB
+
SB
)], or
SLBR
–
STBR = SLBR
[
1 - LB
/(
LB
+
SB
)], or
SLBR
–
STBR = SLBR
[(
LB
+
SB
)
- LB
]/(
LB
+
SB
)], or
SLBR
–
STBR = SLBR
×
SB
/(
LB
+
SB
) =
SLBR × STBR
/1000 > 0
(A3)
We now derive expressions for the changes in the two stillbirth rates. Let
SLBR
1, STBR
1,
SLBR
2,
and
STBR
2represent the two stillbirth rates, and
LB
1, SB
1, LB
2,
and
SB
2the number of live
and stillbirths for years 1 and 2, respectively. Let
SB
2=
kSB
1,where
k
> 0.
(A4).
When
k
> 1, the number of stillbirths in year 2 is greater than that in year 1; when it is < 1, the
number in year 2 is smaller.
Let
Δ
SLBR
and
Δ
STBR
denote the change in the two rates from year 1 to year 2. Then,
Δ
SLBR
= (1000 ×
kSB
1/LB
2) - (1000 ×
SB
1/LB
1), or
Δ
SLBR
= (1000 ×
SB
1) (
k/LB
2- 1/LB
1), or
Δ
SLBR
= (1000 ×
SB
1) × (
kLB
1-
LB
2)/
(
LB
2× LB
1)
(A5),
and
Δ
STBR
= (1000 ×
kSB
1/
(
LB
2+
kSB
1)) - (1000 ×
SB
1/
(
LB
1+
SB
1)), or
Δ
STBR
= (1000 ×
SB
1) ((
k/(LB
2+ kSB
1) -
1
(
/LB
1+
SB
1)), or
Δ
STBR
= (1000 ×
SB
1) ((
kLB
1-
LB
2) /(
LB
2+
kSB
1) (
LB
1+
SB
1))
(A6).
Examining the right hand sides of (A5) and (A6), we get
sign
Δ
SLBR
= sign
Δ
STBR
= sign (
kLB
1-
LB
2)
(A7).
Thus, the two rates change in the same direction: They either both decrease or they both increase.
The proportionate (i.e., ignoring the 100) rate of change (= growth or reduction) in the two
stillbirth rates are
Δ
SLBR/ SLBR
1= (1000 ×
SB
1) × (
kLB
1-
LB
2)/
(
LB
2× LB
1) ÷ (1000 ×
SB
1/LB
1), or
Δ
SLBR/ SLBR
1= (
kLB
1-
LB
2)/
LB
2(A8)
and
Δ
STBR/ STBR
1= (1000 ×
SB
1) ((
kLB
1-
LB
2) /(
LB
2+
kSB
1) (
LB
1+
SB
1)) ÷ (1000 ×
SB
1/
(
LB
1+
SB
1)
or
Δ
STBR/ STBR
1= ((
kLB
1-
LB
2) /(
LB
2+
kSB
1)
(A9)
Dividing (A8) by (A9), we have
[(Δ
SLBR/ SLBR
1)/(Δ
STBR/ STBR
1)] = [(
LB
2+
kSB
1)/
LB
2] > 1.
(A10)
(A10) implies the absolute rate of change in SLBR must be greater than that in STBR. When the
two rates are falling, it means the rate of fall in SLBR must be greater than that in STBR. When they
are increasing, the rate of increase in SLBR must be greater than that in STBR.
The two life expectancies:
Subtracting the RHS of (5) in the text from
LE = LELB
, we have
LELB
–
LETB
=
LELB
(1 - (1000 /(1000 +
SLBR
))), or
LELB
–
LETB =LE - SALE = S LBR
×
LE/
(1000 +
SLBR
) > 0.
(A11),
Let
Δ
LE
represent the excess of
LE
over
SALE
(that equals the shortfall of
SALE
from
LE
).
The partial derivative of
Δ
LE
with respect to
SLBR
is positive. That and (A11) tell us that greater
is the
SLBR
and/or greater is the
LE
, greater is
LE
’s
excess over
SALE
(or, greater is
SALE
’s
shortfall
Additional file 2: Still live-birth and total-birth rates, and SLBR:NMR ratio, 2000 and 2015, by country
2000 2015 % Δ 2000-2015 SLBR:NMR=SB:NM
Country name MDG region Income group SLBR STBR SLBR STBR SLBR-STBR SLBR STBR |SLBR-STBR| NMR 2000 2015
Vietnam Southeastern Asia and Oceania Lower middle income 15.25 15.02 10.25 10.15 0.10 -32.79 -32.42 0.37 -27.28 97.4 90.1 West Bank and Gaza North Africa and Middle East Lower middle income 9.72 9.62 7.54 7.48 0.06 -22.43 -22.25 0.18 -28.04 59.4 64.0 Yemen, Rep. North Africa and Middle East Lower middle income 38.01 36.62 29.87 29.00 0.87 -21.42 -20.81 0.61 -40.94 101.2 134.6 Zambia Sub-Saharan Africa Lower middle income 27.02 26.31 21.30 20.86 0.44 -21.17 -20.71 0.46 -37.67 78.5 99.3 Zimbabwe Sub-Saharan Africa Low income 20.35 19.94 21.04 20.61 0.43 3.39 3.36 -0.03 12.41 97.1 89.3
Additional file 3: Life expectancy & stillbirths adjusted life expectancy, 2000 & 2015, and i) decrease in life expectancy due to stillbirths, and ii)
DALY = YLL of stillbirths, 2015, by country
SLBR 2000 2015 DALY=YLL % Δ 2000-2015
Country name 2000 2015 LE SALE LE SALE |SALE-LE| 2015 LE SALE |SALE-LE|
Afghanistan 37.01 27.48 55.13 53.16 60.72 59.10 1.62 1646853 10.14 11.17 -17.77 Albania 5.79 4.00 74.27 73.84 78.01 77.70 0.31 13987 5.04 5.23 -27.91 Algeria 26.70 19.70 70.18 68.35 75.04 73.59 1.45 1383723 6.93 7.67 -20.77 Angola 35.49 28.08 45.2 43.65 52.67 51.23 1.44 1564366 16.53 17.37 -7.10 Antigua & Barbuda 8.77 7.00 73.4 72.76 76.1 75.57 0.53 823 3.68 3.86 -17.19 Argentina 7.37 4.60 73.76 73.22 76.33 75.98 0.35 266883 3.48 3.77 -35.19 Armenia 21.48 13.96 71.28 69.78 74.8 73.77 1.03 41935 4.94 5.72 -31.33 Australia 3.37 2.72 79.23 78.96 82.45 82.23 0.22 65707 4.06 4.14 -18.52 Austria 4.67 3.64 78.13 77.77 81.84 81.54 0.30 24724 4.75 4.85 -16.67 Azerbaijan 25.85 16.74 66.76 65.08 70.85 69.68 1.17 273378 6.13 7.07 -30.36 Bahamas, The 11.27 10.35 72.25 71.44 75.4 74.63 0.77 4434 4.36 4.47 -4.94 Bahrain 9.48 5.55 74.6 73.90 76.82 76.40 0.42 9113 2.98 3.38 -40.00 Bangladesh 44.22 26.02 65.35 62.58 72 70.17 1.83 5810578 10.18 12.13 -33.94 Barbados 9.28 8.59 73.22 72.55 75.66 75.02 0.64 2187 3.33 3.40 -4.48 Belarus 5.66 2.97 68.91 68.52 73.62 73.40 0.22 27694 6.84 7.12 -43.59 Belgium 3.55 3.02 77.72 77.45 81.29 81.05 0.24 30327 4.59 4.65 -11.11 Belize 11.29 9.84 68.42 67.66 70.19 69.51 0.68 5747 2.59 2.73 -10.53 Benin 37.46 31.24 55.19 53.20 59.72 57.91 1.81 678582 8.21 8.85 -9.05 Bhutan 27.59 16.19 60.65 59.02 69.83 68.72 1.11 13671 15.14 16.44 -31.90 Bolivia 18.06 13.04 60.69 59.61 68.74 67.86 0.88 215802 13.26 13.84 -18.52 Bosnia and Herze. 6.74 5.48 74.26 73.76 76.59 76.17 0.42 13094 3.14 3.27 -16.00 Botswana 17.84 15.46 48.69 47.84 64.49 63.51 0.98 56519 32.45 32.76 15.29 Brazil 12.24 8.65 70.04 69.19 74.68 74.04 0.64 2060055 6.62 7.01 -24.71 Brunei Darussalam 6.98 6.52 75.29 74.77 79.04 78.53 0.51 3914 4.98 5.03 -1.92 Bulgaria 8.54 5.77 71.66 71.05 74.47 74.04 0.43 25754 3.92 4.21 -29.51 Burkina Faso 30.25 21.70 50.35 48.87 58.93 57.68 1.25 858169 17.04 18.03 -15.54 Burundi 37.27 27.36 51.49 49.64 57.11 55.59 1.52 701167 10.91 11.99 -17.84 Cabo Verde 19.76 14.49 69.72 68.37 73.36 72.31 1.05 11464 5.22 5.76 -22.22 Cambodia 21.27 12.08 58.35 57.13 68.66 67.84 0.82 291967 17.67 18.75 -32.79 Cameroon 24.70 19.96 51.94 50.69 55.93 54.84 1.09 892654 7.68 8.19 -12.80 Canada 3.54 3.15 79.24 78.96 82.14 81.88 0.26 95958 3.66 3.70 -7.14 Central African
Republic
38.80 35.59
44.6 42.93 51.42 49.65
1.77 289797 15.29 15.65 5.99
Samoa 12.10 11.05 69.49 68.66 73.76 72.95 0.81 3672 6.14 6.25 -2.41 San Marino 4.90 2.60 80.62 80.23 83.3 83.08 0.22 85 3.32 3.55 -43.59 Sao Tome & Principe 24.88 16.47 63.29 61.75 66.51 65.43 1.08 6835 5.09 5.96 -29.87 Saudi Arabia 19.22 14.13 72.53 71.16 74.49 73.45 1.04 641306 2.70 3.22 -24.09 Senegal 35.89 25.09 57.77 55.77 66.8 65.17 1.63 942937 15.63 16.85 -18.50 Serbia 7.84 5.98 71.58 71.02 75.49 75.04 0.45 41720 5.46 5.66 -19.64 Seychelles 11.32 9.83 72.4 71.59 73.23 72.52 0.71 1213 1.15 1.30 -12.35 Sierra Leone 40.71 24.96 38.69 37.18 51.31 50.06 1.25 272876 32.62 34.64 -17.22 Singapore 3.53 2.58 77.95 77.68 82.6 82.39 0.21 11200 5.97 6.06 -22.22 Slovak Republic 3.91 2.94 73.05 72.77 77.21 76.98 0.23 12452 5.69 5.79 -17.86 Slovenia 2.70 2.85 75.41 75.21 81.08 80.85 0.23 5038 7.52 7.50 15.00 Solomon Islands 20.04 17.91 62.84 61.61 68.15 66.95 1.20 20084 8.45 8.67 -2.44 Somalia 40.82 36.80 50.88 48.88 55.69 53.71 1.98 880191 9.45 9.88 -1.00 South Africa 22.94 17.76 55.84 54.59 57.44 56.44 1.00 1014226 2.87 3.39 -20.00 South Sudan 37.28 30.98 49.22 47.45 56.11 54.42 1.69 727065 14.00 14.69 -4.52 Spain 3.31 2.88 78.97 78.71 83.38 83.14 0.24 89074 5.58 5.63 -7.69 Sri Lanka 7.60 4.91 71.11 70.57 74.95 74.58 0.37 115405 5.40 5.68 -31.48 St. Lucia 13.18 12.16 71.42 70.49 75.18 74.28 0.90 2552 5.26 5.38 -3.23 St Vincent & the
Grenadines
12.57 10.90
70.58 69.70 73.05 72.26
0.79 1285 3.50 3.67 -10.23
Sudan 30.09 24.99 57.97 56.28 63.71 62.16 1.55 1995625 9.90 10.45 -8.28 Suriname 24.64 19.82 67.93 66.30 71.29 69.90 1.39 13607 4.95 5.43 -14.72 Swaziland 16.20 12.50 48.66 47.88 48.87 48.27 0.60 21991 0.43 0.81 -23.08 Sweden 3.81 2.86 79.64 79.34 82.55 82.31 0.24 27100 3.65 3.74 -20.00 Switzerland 3.25 2.82 79.68 79.42 83.2 82.97 0.23 19685 4.42 4.47 -11.54 Syrian Arab Republic 14.75 11.27 72.72 71.66 70.09 69.31 0.78 330832 -3.62 -3.28 -26.42 Tajikistan 19.36 14.18 63.7 62.49 69.77 68.79 0.98 262004 9.53 10.08 -19.01 Tanzania 32.68 22.94 50.47 48.87 65.49 64.02 1.47 3009700 29.76 31.00 -8.13 Thailand 7.74 5.00 70.63 70.09 74.6 74.23 0.37 274082 5.62 5.91 -31.48 Timor-Leste 27.01 18.10 59.35 57.79 68.53 67.31 1.22 63429 15.47 16.47 -21.79 Togo 46.24 35.36 53.47 51.11 60.12 58.07 2.05 512578 12.44 13.62 -13.14 Tonga 9.60 8.93 70.76 70.09 72.94 72.29 0.65 1670 3.08 3.14 -2.99 Trinidad and Tobago 17.94 11.24 68.6 67.39 70.56 69.78 0.78 14743 2.86 3.55 -35.54 Tunisia 15.01 9.25 73.26 72.18 74.98 74.29 0.69 145185 2.35 2.92 -36.11 Turkey 12.91 7.05 70 69.11 75.43 74.90 0.53 745884 7.76 8.38 -40.45 Turkmenistan 22.96 17.31 63.9 62.47 65.74 64.62 1.12 128762 2.88 3.44 -21.68 Uganda 30.25 21.48 46.42 45.06 59.18 57.94 1.24 1968738 27.49 28.58 -8.82 Ukraine 12.50 8.88 67.86 67.02 71.19 70.56 0.63 272536 4.91 5.28 -25.00 United Arab Emirates 8.98 7.42 74.45 73.79 77.54 76.97 0.57 55165 4.15 4.31 -13.64 United Kingdom 3.67 2.95 77.74 77.46 81.6 81.36 0.24 182057 4.97 5.03 -14.29 United States 3.12 2.96 76.64 76.40 78.74 78.51 0.23 875684 2.74 2.76 -4.17 Uruguay 8.57 6.59 74.69 74.06 77.14 76.63 0.51 24562 3.28 3.47 -19.05 Uzbekistan 15.88 12.19 66.94 65.89 68.45 67.63 0.82 550803 2.26 2.64 -21.90 Vanuatu 14.37 14.10 67.56 66.60 72.16 71.16 1.00 6797 6.81 6.85 4.17 Venezuela, RB 9.03 7.18 72.35 71.70 74.41 73.88 0.53 318246 2.85 3.04 -18.46 Vietnam 15.25 10.25 73.15 72.05 75.78 75.01 0.77 1212550 3.60 4.11 -30.00 West Bank and Gaza 9.72 7.54 70.76 70.08 73.07 72.52 0.55 82653 3.26 3.48 -19.12 Yemen, Rep. 38.01 29.87 60.46 58.25 64.03 62.17 1.86 1528448 5.90 6.73 -15.84 Zambia 27.02 21.30 43.46 42.32 60.79 59.52 1.27 781240 39.88 40.64 11.40 Zimbabwe 20.35 21.04 41.69 40.86 59.16 57.94 1.22 664926 41.90 41.80 46.99
Notes: LE and SALE stand for traditional life expectancy and stillbirths adjusted life expectancy, respectively. Out of 194 countries in App. 2, life expectancy data are unavailable for Andorra, Cook Islands, Dominica, Monaco, Nauru, St. Kitts and Nevis, and Tuvalu. Traditional Life expectancy data is from World Development Indicators (WDI). WDI does not have 2015 life expectancy numbers for Marshall Islands and