Proceedings of the 55th Annual Meeting of the Association for Computational Linguistics, pages 623–633 Proceedings of the 55th Annual Meeting of the Association for Computational Linguistics, pages 623–633
Spectral Analysis of Information Density in Dialogue
Predicts Collaborative Task Performance
Yang Xu and David Reitter
College of Information Sciences and Technology The Pennsylvania State University
University Park, PA 16802, USA
[email protected], [email protected]
Abstract
We propose a perspective on dialogue that focuses on relative information contribu-tions of conversation partners as a key to successful communication. We predict the success of collaborative task in English and Danish corpora of task-oriented dia-logue. Two features are extracted from the frequency domain representations of the lexical entropy series of each interlocutor, power spectrum overlap(PSO) and rela-tive phase(RP). We find that PSO is a neg-ative predictor of task success, while RP is a positive one. An SVM with these fea-tures significantly improved on previous task success prediction models. Our find-ings suggest that the strategic distribution of information density between interlocu-tors is relevant to task success.
1 Introduction
What factors affect whether information is con-veyed effectively and reliably in conversations? Several theoretical frameworks have emerged that model dialogical behavior at different granularity levels. Can we use them to measure communica-tive effeccommunica-tiveness?
Grounding theory (Clark and Brennan, 1991) models a successful communication as a pro-cess during which “common ground” (i.e., mu-tual knowledge, beliefs etc.) is jointly built among interlocutors. The interactive alignment model (IAM) (Pickering and Garrod,2004) proposes that the ultimate goal of dialogue is the alignment of interlocutors’ situational model, which is helped by alignment at all other lower representation lev-els (e.g., lexical, syntactic etc.), driven by the psy-chologically well-documented priming effects.
Recently, empirical studies have verified the explanatory powers of the above-mentioned the-ories, especially the IAM, utilizing dialogues recorded and transcribed from various collabora-tive tasks conducted in laboratory settings (Reit-ter and Moore, 2007; Reitter and Moore, 2014; Fusaroli et al., 2012; Fusaroli and Tyl´en, 2016). In those studies, the quality of communication is directly reflected in the collaborative performance of interlocutors, i.e., how successful they are in ac-complishing the task. Although they do not come to fully agree on which theoretical accounts of di-alogue (e.g., interactive alignment vs. interper-sonal synergy) provides better explanations (see Section2.1for details), the majority of these stud-ies have confirmed that the alignment of certain linguistic markers, lexical items, or syntactic rules between interlocutors correlates with task success. What is missing from the picture, however, is the computational understanding of how strategies of interaction and the mix of information contribu-tions to the conversation facilitate successful com-munication. This is understandable because those higher level concepts do not directly map onto the atomic linguistic elements and thus are much more difficult to define and operationalize. In the present study, we intend to explore this missing part of work by characterizing how the interaction between interlocutors in terms of their informa-tion contribuinforma-tions affects the quality of communi-cation.
1.1 An information-based approach
Recent work has already used information theory to study the dynamics of dialogue. Xu and Reit-ter (2016b) observed that the amount of lexical in-formation (measured by entropy) from interlocu-tors of different roles,convergeswithin the span of topic episodes in natural spoken dialogue. Anon (2017) interpret this converging pattern as a
flection of the dynamic process in which the infor-mation contributed by two interlocutors fluctuates in a complementary way at the early stage, and gradually reaches an equilibrium status. Xu and Reitter (2016b) also correlated this entropy con-verging pattern with the topic shift phenomenon that frequently occurs in natural conversation (Ng and Bradac, 1993), and proposed that it reflects the process of interlocutors building thecommon groundthat is necessary for the ongoing topics of conversation.
Based on Xu and Reitter’s (2016) finding that entropy converging pattern repeatedly occurs within dialogue (though not necessarily at strictly regular intervals), it is reasonable to expect that after applying some spectral analysis techniques (time space to frequency space conversion) to the entropy series of dialogue, the frequency space representations should demonstrate some patterns that are distinct from white noise, because the pe-riodicity properties in time space are captured.
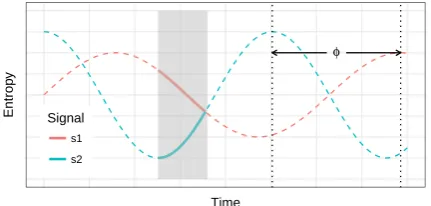
Furthermore, we expect that how the frequency representations of two interlocutors correlate pro-vides some information about the higher level properties of dialogue, e.g., the task performance etc. The thought is intuitive: If we imagine the entropy series from two interlocutors as two ideal sinusoidal signals s1 and s2 (supposedly of
dif-ferent frequencies, f1 and f2) (Figure 1), then
the observed converging pattern can be thought of as a segment from the full spans of the signals. Then the frequency space properties, such as how close f1 and f2 are, and the phase difference φ
between them, will definitely affect the shape of the converging pattern (solid lines in Figure 1). As Xu and Reitter (2016b) argues that the con-verging segment reflects thegroundingprocess be-tween interlocutors, it is reasonable to expect that the shape and length of this segment are reflective of how well interlocutors understand each other, and the overall collaborative performance as well. Based on the above considerations, the goal of the present study is to explore how the frequency space representations of the entropy series of dia-logue are correlated with the collaborative perfor-mance of task. We first demonstrate that entropy series satisfy the prerequisites of spectral analy-sis techniques in Section4. Then we use two fre-quency space statistics, power spectrum overlap (PSO) andrelative phase(RP), to predict task suc-cess. The reasons of using these two specific
in-φ
Time
Entrop
y
Signal
[image:2.595.309.525.65.168.2]s1 s2
Figure 1: Analogizing the entropy converging pat-terns reported by Xu and Reitter (2016b) to a segment from two periodic signals. The shad-owed area and the solid lines indicate the observed entropy convergence between interlocutors. The dashed lines are the imaginary parts of the ideal signals.
dices are discussed in Section 2.3, and their def-initions are given in Section3.3. The results are shown in Sections5to7, and the implications are discussed.
2 Related Work
2.1 The success of dialogue
The interactive-alignment model (IAM) (Picker-ing and Garrod,2004) stipulates that communica-tion is successful to the extent that communicators “understand relevant aspects of the world in the same way as each other” (Garrod and Pickering,
2009). Qualitative and quantitative studies (Gar-rod and A. Anderson, 1987; Pickering and Gar-rod,2006; Reitter and Moore,2014) have revealed that the alignment of linguistic elements at differ-ent represdiffer-entation levels between interlocutors fa-cilitates the success of task-oriented dialogues.
complexity matching in these power law functions is reflective of whether the conversation is affilia-tive or argumentaaffilia-tive.
The perspective taken by the present study has some common places with Fusaroli and Tyl´en (2016) and Abney et al.’s (2014) work: we view dialogue as an interaction of two dynamic sys-tems. The joint decision-making task used by Fusaroli and Tyl´en (2016) resulted in a small cor-pus of dialogue in Danish, which we will use for the present study.
2.2 Information density in natural language Information Theory (Shannon,1948) predicts that the optimal way to communicate is to send infor-mation at a constant rate, a.k.a. the principle of entropy rate constancy (ERC). The way humans use natural language to communicate also follows this principle: by computing the local per-word entropy of the sentence (which, under the predic-tion of ERC, will increase with sentence posipredic-tion), ERC is confirmed in both written text (Genzel and Charniak,2002; Genzel and Charniak,2003; Keller,2004; Qian and Jaeger,2011) and spoken dialogue (Xu and Reitter,2016b; Xu and Reitter,
2016a). The theory of uniform information
den-sity (UID) extends ERC to syntactic representa-tions (Jaeger,2010) and beyond.
The information density in language, i.e., the distribution of entropy (predictability), reveal the discourse structure to some extent. For exam-ple, entropy drops at the boundaries between top-ics (Genzel and Charniak,2003; Qian and Jaeger,
2011), and increases within a topic episode in di-alogue (Xu and Reitter,2016b) (see Section1.1). The entropy of microblog text reflects changes in contextual information (e.g., an unexpected event in a sports game) (Doyle and Frank,2015).
In sum, per-word entropy quantifies the amount of lexical information in natural language, and therefore fulfills the needs of modeling the infor-mation contribution from interlocutors.
2.3 Spectral analysis methodology
Spectral analysis, also referred to as frequency do-main analysis, is a pervasively used technique in physics, engineering, economics and social sci-ences. The key idea of it is to decompose a com-plex signal in time space into simpler components in frequency space, using mathematical operations such as Fourier transform (Bracewell,1986).
The application of spectral analysis in human language technology mainly focuses on process-ing the acoustic signals of human voice, and cap-turing the para-linguistics features relevant to cer-tain tasks (Schuller et al., 2013). For example, Bitouk et al. (2010) find that utterance-level spec-tral features are useful for emotion recognition. Gregory Jr and Gallagher (2002) demonstrate that spectral information beneath 0.5 kHz can predict US president election outcomes. However, we are not aware of the usage of spectral analysis in studying linguistic phenomena at higher represen-tation levels than the acoustic level.
For our study, we are looking for some tech-niques that can capture the coupling between two signals at frequency space. The nature of the sig-nal (whether it is language-related or not) should not be the first concern from the perspective of methodology. Therefore, studies outside the field of speech communication and linguistics could also be enlightening to our work.
After searching the literature, we find that the spectral analysis techniques that Oullier et al. (2002) and Oullier et al. (2008) use to study the physical and social functions of human body movement are useful to our research goal. In Oul-lier et al.’s (2002) work, subjects stood in a mov-ing room and were to track a target attached to the wall. A frequency space statistics, power spec-trum overlap(PSO), was used to demonstrate the coupling between motion of the room and motion of the subject’s head. Stronger coupling effect (higher PSO) was found in the tracking task than a no-tracking baseline. PSO in nature quantifies how much the frequency space representations of two signals (power spectrum density) overlap. It allows us to explore the frequency space coupling of two interlocutors’ entropy series in dialogue.
3 Methods
3.1 Corpus data
Two corpora are examined in this study: the HCRC Map Task Corpus (A. H. Anderson et al.,
1991) and a smaller corpus in Danish from a joint decision-making study (Fusaroli et al.,2012), henceforthDJD.
Map Task contains a set of 128 dialogues
be-tween two subjects, who accomplished a cooper-ative task together. They were given two slightly different maps of imaginary landmarks. One of them plays as the instructiongiver, who has routes marked on her map, and the other plays as the in-structionfollower, who does not have routes. The task for them is to reproduce the giver’s route on the follower’s map. The participants are free to speak, but they cannot see each other’s map. The whole conversations were recorded, transcribed and properly annotated. The collaborative perfor-mance in the task is measured by the PATHDEV
variable, which quantifies the deviation between the paths drawn by interlocutors. Larger values indicate poorer task performance.
DJD contains a set of 16 dialogues from na-tive speakers of Danish (11,100 utterances and 56,600 words). In Fusaroli et al.’s (2012) original study the participants were to accomplish a series of visual perception task trials, by discussing the stimuli they saw and reaching a joint decision for each trial. The collaborative performance is mea-sured by theCollectivePerformance vari-able, which is based on a psychometric function that measures the sensitivity of the dyad’s joint de-cision to the actual contrast difference of the trial (Fusaroli et al., 2012). Higher value of this vari-able indicates better task performance.
The Switchboard Corpus (Godfrey et al.,1992) is used to train the language model for estimating the sentence entropy in Map Task. The Copen-hagen Dependency Treebanks Corpus1is used for
the same purpose for DJD.
3.2 Estimating information density in dialogue
The information density of language is estimated at the sentence level, by computing the per-word entropy of each sentence using a trigram language model trained from a different corpus. We con-sider a sentence to be a sequence of words, S =
1http://mbkromann.github.io/
copenhagen-dependency-treebank/
{w1, w2, . . . , wn}, and the per-word entropy is
es-timated by:
H(w1...wn) =−
1
n
X
wi∈W
logP(wi|w1...wi−1)
(1) whereP(wi|w1. . . wi−1)is estimated by a trigram
model that is trained from an outside corpus. The
SRILM software (Stolcke, 2002) is used to train the language model and to compute sentence en-tropy.
Dialogue is a sequence of utterances contributed by two interlocutors. For thekth dialogue whose
total utterance number isNk, we mark it asDk = {uki |i = 1,2, . . . , Nk}, in whichuki is thei th
utterance. Map Task contains annotations of sen-tence structure in utterances, and one utterance could consist of several sentences that are syn-tactically independent. Thus we further splitDk
into a sequence of sentence, Dk = {ski | i =
1,2, . . . , Nk0}, in whichNk0 is number of sentences
inDk. Since DJD lacks the sentence annotations,
we do not further split the utterance sequence, and simply treat an utterance as a complete sentence.
Given a sequence {ski} (Map Task), or {uki}
(DJD), we calculate the per-word entropy for each item in the sequence:
Hk={H(ski)orH(uik)|i= 1,2, . . . , Nk0(orNk)}
(2) whereH(sk
i)orH(uki)is computed according
to Equation1.
Then we split the entropy series Hk into two
sub-series by the source of utterances (i.e., who speaks them), resulting inHA
k for interlocutorA,
andHkBfor interlocutorB. For Map Task, the two
interlocutors have distinct roles, instructiongiver andfollower. Thus the resulting two entropy series are Hkg and Hkf. These per-interlocutor entropy series will be the input of our next-step spectral analysis.
3.3 Computing power spectrum overlap and relative phase
The time intervals between utterances (or sen-tences) vary, but since we care about the aver-age information contribution within a complete se-mantic unit, we treat entropy series as regular time series. The time scale is not measured in seconds but in turns (or sentences).
For a given dialogue Dk, we apply the fast
se-ries HA
k and HkB, and obtain the power spectra
(or, power spectral density plots) of them,PkAand PkB. The power spectra are estimated with the
pe-riodogrammethod provided by the open sourceR
software. The Y axis of a power spectrum is the squared amplitude of signal (or power), and X axis ranges from 0 to π/2 (we do not have sampling
frequency, thus the X axis is in angular frequency but not in Hz).
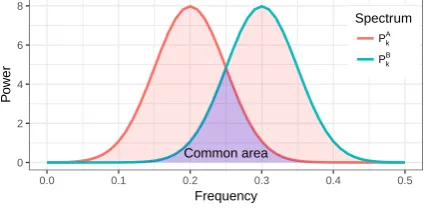
The power spectrum overlap, PSOk, is
calcu-lated by computing the common area under the curves ofPkA andPkB is calculated, and
normal-izing by the total area of the two curves (see Fig-ure2). PSOkranges from 0 to 1, and a larger value
indicates higher similarity betweenPkAandPkB.
Common area
0 2 4 6 8
0.0 0.1 0.2 0.3 0.4 0.5
Frequency
P
o
w
er
Spectrum
Pk A
Pk B
Figure 2: How PSO is computed. The blue shadow is the common area under two spectrums.
The relative phase (RP) betweenHkA andHkB
is directly returned by thespectrumfunction in
R. It is a vector of real numbers that range from 0 toπ, and each element represent the phase
differ-ence between two signals at a particular frequency position of the spectrum.
4 Prerequisites of Spectral Analysis
Before proceeding to the actual analysis, we first examine whether the data we use satisfy some of the prerequisites of spectral analysis techniques. One common assumption of Fourier transforms is that the signals (time series) are stationary (Dwivedi and Subba Rao, 2011). Stationarity means that the mean, variance and other distri-butional properties do not change over time (Na-trella,2010). Another presumption we hold is that the entropy series contain some periodic patterns (see Section1.1), which means their power spec-trum should differ from that of white noise.
4.1 Examine stationarity
[image:5.595.331.502.93.144.2]We use three pervasively used statistical tests to test the stationarity of our entropy series data: the
Table 1: Percentage stationary data
Corpus ADF KPSS PP Map Task 82.4% 95.5% 100% DJD 100% 81.3% 100%
augmented Dickey-Fuller (ADF) test (Dickey and Fuller,1979), the Kwiatkowski-Phillips-Schmidt-Shin (KPSS) test (Kwiatkowski et al.,1992), and the Phillips-Perron (PP) test (Phillips and Perron,
1988). The percentage of entropy series that pass the stationarity tests are shown in Table 1. We can see that the majority of our data satisfy the assumption of stationarity, and thus it is valid to conduct Fourier transform on the entropy series.
The stationarity property seems contradictory to the previous findings about entropy increase in written text and spoken dialogue (Genzel and Charniak, 2002; Genzel and Charniak,2003; Xu and Reitter, 2016b), because stationarity predicts that the mean entropy stays constant over time. We examine this in our data by fitting a simple linear model with entropy as the dependent, and sentence position as the independent variable, which yields significant (marginal) effects of the latter: For Map Task,β = 2.3×10⁻³, p < .05, Adj-R2 = 1.7×10⁻⁴; For DJD, β = 7.2×10⁻⁵, p =
.06, Adj-R2 = 2.2×10⁻⁴. It indicates that the
stationarity of entropy series does not conflict with the entropy increasing trend predicted by the prin-ciple of ERC (Shannon, 1948). We conjecture that stationarity satisfies because the effect size (Adj-R2) of entropy increase is very small.
4.2 Comparison with white noise
Power spectra for all entropy series are obtained with an FFT. We compare them with those of white noise. The white noise data are simulated with i.i.d. random data points that are generated from normal distributions (same means and stan-dard deviations as the actual data). Figure3shows the smoothed average spectrums of the actual en-tropy data and the simulated white noise data.
[image:5.595.75.289.283.388.2]200 250 300 350
0.0 0.1 0.2 0.3 0.4 0.5 Frequency
P
o
w
er
Type
Actual data
White noise
(a) Map Task
0.29 0.30 0.31 0.32
0.0 0.1 0.2 0.3 0.4 0.5 Frequency
P
o
w
er
Type
Actual data
White noise
[image:6.595.308.526.159.219.2](b) DJD
Figure 3: Comparing the average power spectra of the actual entropy data and white noise. There are significant linear correlations between power (Y axis) andfrequency(X axis) for the actual entropy data, which means the data are not completely ran-dom. Shadowed areas are 95% C.I.
β = 2.3×10⁻², SE = 9.4×10⁻³, p < .05; for
DJD,β = 314.1, SE = 19.8, p < .001), while
the slopes of the white noise data are not signifi-cantly different from zero. This confirms our pre-sumption that the entropy series of dialogue con-tains some periodic patterns that are identifiable in frequency space.
We also conduct Ljung-Box test (Ljung and Box, 1978) to examine how the entropy series is different from white noise. The null hypothesis is that the time series being tested is independent of the lagged sequence of itself. The test on a white noise series will give big p-values, for any lags greater than0, because of its randomness
na-ture. We try several lags on each entropy series, and pick the smallestp-value. Consequently, we obtain a mean p-value of .23 on MapTask, and a
meanp-value of.27on DJD. Therefore, we cannot
reject the null hypothesis for all the entropy series data, but the Type-I error of considering them as different form white noise is pretty low.
5 PSO Predicts Task Success
5.1 Results of linear models
We compute PSO for all the dialogues in Map Task and DJD and fit two linear mod-els using PSO as predictor, with PATHDEV and
CollectivePerformanceas dependent vari-ables respectively.
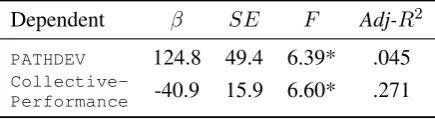
PSO is a reliable predictor in both models (p < .05). The coefficients are shown in Table2. Since
PATHDEVis a measure of failure, but collabora-tive task performance is a measure of success, the negative correlation between PSO and
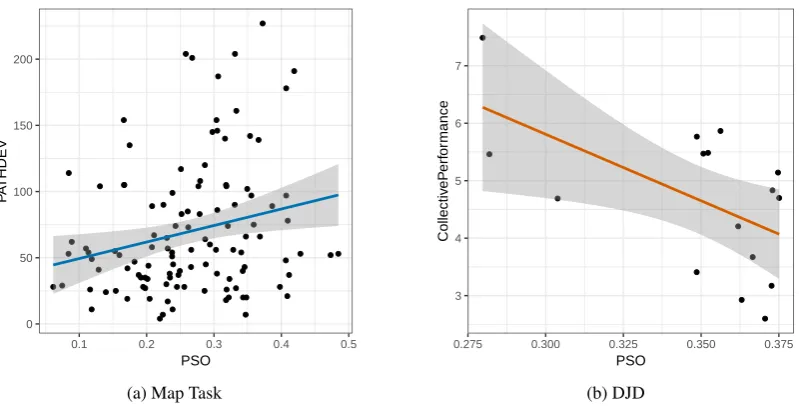
collabora-tive task performance is consistent. Regression lines with residuals are plotted in Figure4.
Table 2: Coefficients of PSO in predict-ing PATHDEV (Map Task) and Collective
-Performance(DJD). * indicatesp < .05.
Dependent β SE F Adj-R2
PATHDEV 124.8 49.4 6.39* .045
Collective-Performance -40.9 15.9 6.60* .271
Figure4(a) suggests a heteroscedasticity prob-lem, because the right half of data points seem to stretch up along the y axis. This was con-firmed by a Breush-Pagan test (Breusch and Pa-gan, 1979) (BP = 5.62, p < .05). To
rec-tify this issue, we adopt a Box-Cox transformation (Box and Cox, 1964) on the dependent variable,
PATHDEV, which is a typical way of handling het-eroscedasticity. The new model that uses PSO to predict the Box-Cox transformed PATHDEValso yields significant coefficients: β = 3.85, SE =
1.67, F(1,113) = 5.32, p < .05. Therefore,
the correlation between PSO andPATHDEVis re-liable.
As for DJD, due to the lack of data (we only have 16 dialogues), we do not run further diagnos-tics analysis on the regression model.
5.2 Discussion
The coupling of entropy series in frequency space is negatively correlated with task success. In other words, synchrony between interlocutors in terms of their information distribution hinders the suc-cess of collaboration. By “synchrony”, we mean an overlap in the frequencies at which they choose to inject novel information into the conversation.
conversa-● ● ● ● ● ● ● ● ● ● ● ● ● ● ● ● ● ● ● ● ● ● ● ● ● ● ● ● ● ● ● ● ● ● ● ● ● ● ● ● ● ● ● ● ● ● ● ● ● ● ● ● ● ● ● ● ● ● ● ● ● ● ● ● ● ● ● ● ● ● ● ● ● ● ● ● ● ● ● ● ● ● ● ● ● ● ● ● ● ● ● ● ● ● ● ● ● ● ● ● ● ● ● ● ● ● ● ● ● ● ● ● ● ● ● 0 50 100 150 200
0.1 0.2 0.3 0.4 0.5
PSO
P
A
THDEV
(a) Map Task
● ● ● ● ● ● ● ● ● ● ● ● ● ● ● ● 3 4 5 6 7
0.275 0.300 0.325 0.350 0.375
[image:7.595.101.501.62.265.2]PSO Collectiv eP erf or mance (b) DJD
Figure 4: Regression lines of linear models using PSO to predict PATHDEV in Map Task (a) and
CollectivePerformancein DJD (b). Shadowed areas are 95% C.I.
tion where one interlocutor brings relatively novel content to the table, such as a detailed instruc-tion, a strange quesinstruc-tion, an unexpected response etc. This assumption is reasonable because pre-vious work has shown that sudden change in en-tropy predicts topic change in dialogue (Genzel and Charniak, 2003; Qian and Jaeger, 2011; Xu and Reitter,2016b).
We argue that higher synchrony (larger overlap in frequency space) in terms of how much nov-elty each interlocutor contributes, does not neces-sarily leads to better outcomes of communication. Rather, we would expect the correlation to be op-posite (and our empirical results confirm this), be-cause dialogue is a joint activity, in which a tak-ing on different roles as interlocutors (e.g., the one who gives orders versus the one who follows) is often required to push the activity along (Clark,
1996). A dialogue with maximal synchrony or fre-quency overlap would be one where partners take turns at regular intervals. Perhaps because such regularity in turn-taking assigns no special roles to interlocutors, and because they engage in turn-taking with no regard for content, it is not strange that such synchrony is disadvantageous.
Let’s look at several scenarios of different syn-chrony levels between interlocutors: First, high synchrony due to both interlocutors contributing large amount of new information, which means there is more overlap near the high frequency band of spectrums. In this case, they are more likely to have difficulty in comprehending each other due
to the potential information overload. Situations such as arguing, or both speakers asking a lot of questions are good examples. Second, high syn-chrony due to both interlocutors providing ineffec-tive information, which indicates overlap in spec-trums near the low frequency band. Obviously this type of ineffective communication is not helpful to the collaborative task. Third, low synchrony due to one interlocutor providing more informa-tion and the other one providing less, which means the overlap in spectrums is minimum. An example of this case is that one interlocutor is saying some-thing important, while the other one is produc-ing short utterances such “uh-huh”, “yes”, or short questions to make sure that they are on the same page, which is known as the back-channel mecha-nism in conversation (Orestr¨om,1983). This com-plementary style of communication allows them to build mutual understand of each other’s intention, and thus reaches better collaborative performance.
6 RP Predicts Task Success
6.1 Results of linear models
We obtain the relative phase (RP) vector (absolute values) of all frequency components, and fit linear models using the mean of RP as predictor, and task performance as the dependent variable. We get non-significant coefficients for both models: For Map Task,F(1,113) = .004, p > .05; for DJD,
F(1,14) =.772, p > .05. This suggests that the
The power spectra describe the distribution of energy across the span of frequency components that compose the signal. The frequency com-ponents with higher energy (peaks in spectrum) are more dominant than those with lower energy (troughs) in determining the nature of the signal. Therefore it makes sense to only include the peak frequencies into the model, because they are more “representative” of the signal, and so the “noise” from the low energy frequencies are filtered out. Thus we obtain RP from the local peak frequency components, and use the mean, median, and max-imum values of them as predictors. It turns out that for Map Task, the maximum of RP is a sig-nificant predictor (the mean and median are left out via stepwise analysis). For DJD, the mean of RP is a significant predictor of task success (when median and maximum are included in the model). (see Table3).
Table 3: Coefficients of the linear models using the mean, median, and maximum values of RP from peak frequency components to predict task perfor-mance.∗p < .05, †p < .1.
Corpus Predictor β SE tscore
Map Task max -64.9 30.3 -2.14*
DJD meanmedian 15.6-7.4 5.73.6 -2.062.76*†
max -11.5 7.2 -1.60
From the significant effect of maximum RP in Map Task and mean RP in DJD, it is safe to state that RP is positively correlated with task per-formance. However, this relationship is not as straight-forward as PSO, because of the marginal effect at the opposite direction. A more fine-grained analysis is required, but it is outside the scope of this study.
6.2 Discussion
[image:8.595.74.289.404.487.2]The relative phase in frequency space can be un-derstood as the “lag” between signals in time space. Imagine that we align the two entropy se-ries from one dialogue onto the same time scale (just like Figure 1), the distance between the en-tropy “peaks” is proportionate to the relative phase in frequency space. Then, the positive correlation between relative phase and task performance sug-gests that relatively large delays between entropy
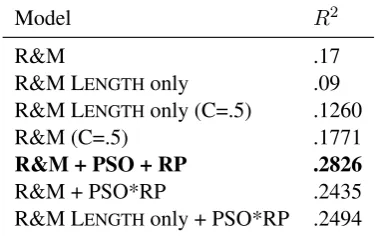
Table 4: R2 performance on the HCRC MapTask
task success prediction task (percentage of vari-ance explained). 10-fold cross-validated by dia-logue; same folds for each model. Reitter and Moore (2007) (R&M) contained length and lexi-cal and syntactic repetition features.
Model R2
R&M .17
R&M LENGTHonly .09 R&M LENGTHonly (C=.5) .1260
R&M (C=.5) .1771
R&M + PSO + RP .2826 R&M + PSO*RP .2435 R&M LENGTHonly + PSO*RP .2494
“surges” seen in each interlocutor are beneficial to collaborative performance.
The delay of entropy surges can be understood as a strategy for an interlocutor to distribute in-formation in his or her own utterance accordingly with the information received. For example, after interlocutorAcontributes a big piece of informa-tion, the other one,B, does notrushto make new substantial contributions, but instead keeps her ut-terances at low entropy until it is the proper time to take a turn to contribute. This does not have to coincide with dialogic turn-taking.
This delay gives B more time to “digest” the information provided by A, which could be an instruction that needs to be comprehended, or a question that needs to be thought about and so on. A relatively long delay guarantees enough time for interlocutors to reach mutual understanding. On the contrary, ifBrushes to speak a lot shortly after theA’s input, then it will probably cause informa-tion overload and be harmful to communicainforma-tion.
Therefore, we believe that the RP statistic cap-tures the extent to which interlocutors manage the proper “timing” of information contribution to maintain effective communication.
7 Prediction Task
R&M described an SVM model that takes into the repetition count of lexicons (LEXREP) and syn-tax structures (SYNREP), and the length of di-alogues (LENGTH) as features. The full model achieves an R2 score of.17, which means that it
can account for 17% of the variance of task suc-cess.
We add the new PSO and RP (mean, median and maximum RP features per dialogue are included) covariates to the original SVM model. An RBF kernel (γ = 5) was used. The cost parameter C
was (coarsely) tuned on different cross-validation folds to reduce overfitting on this relatively small dataset, and the R&M’s original full model was re-calculated (shown in Table4as R&M). Two mod-els with PSO and RP interactions (once without the alignment/repetition features) are shown for comparison. (See Table4).
Significant improvement in the model’s ex-planatory power, i.e.,R2, is gained after the PSO
and RP features are added. The best model we have is by adding PSO and RP as predictors with-out the interaction term (bold number in Table4), which gives about 60% increase ofR2 compared
to R&M’s full model. Note that even if we ex-clude the alignment features, and inex-clude only (LENGTH) and the frequency features (last row in Table 4), the performance also exceeds R&M’s full model.
The results indicate that the frequency domain features (PSO and RP) of the sentence informa-tion density can capture some hidden factors of task success that are unexplained by the alignment approach. It is not surprising that how people coordinate their information contribution matters a lot to the success of the collaboration. What we show here is that regular, repeated patterns of information-dense and information-sparse turns seem to make speakers more or less compatible with each other. Whether individuals have typi-cal patterns (frequency distributions) of informa-tion density, or whether this is a result of dynamic interaction in each particular dialogue, remains to be seen.
8 Conclusions
The empirical results of the present study suggest that examining how the information contribution from interlocutors co-develops can provide a way to understand dialogue from a higher-level per-spective, which has been missing in existing work.
Our work adds a brick to the series of endeavors on studying the linguistic and behavioral factors of successful dialogue, and for the first time (as far as we know) demonstrates quantitatively that the dy-namics of not just “what” and “how” we say, but also “how much” we say and the “timing” of dis-tributing what we say in dialogue, are relevant to the quality of communication. Although the way we model information in language is simply the entropy at lexical level, we believe the findings still reveal the nature of information production and processing in dialogue. We hope that by com-paring and combining our methodology with other approaches of studying dialogue, we can reach a more comprehensive and holistic understanding of this common yet mysterious human practice.
Acknowledgments
We thank Riccardo Fusaroli for providing the DJD dataset. We have received very helpful input from Gesang Zeren in developing the initial ideas of this project. The work leading to this paper was funded by the National Science Foundation (IIS-1459300 and BCS-1457992).
References
Abney, D. H., Paxton, A., Dale, R., & Kello, C. T. (2014). Complexity matching in dyadic conversation.Journal of Experimental Psy-chology: General,143(6), 2304.
Anderson, A. H., Bader, M., Bard, E. G., Boyle, E., Doherty, G., Garrod, S., . . . Miller, J. et al. (1991). The HCRC map task corpus. Language and Speech,34(4), 351–366. Bitouk, D., Verma, R., & Nenkova, A. (2010).
Class-level spectral features for emotion recognition.Speech Communication,52(7), 613–625.
Box, G. E. & Cox, D. R. (1964). An analysis of transformations. Journal of the Royal Sta-tistical Society. Series B (Methodological), 211–252.
Bracewell, R. N. (1986). The Fourier transform and its applications. New York: McGraw-Hill.
Breusch, T. S. & Pagan, A. R. (1979). A simple test for heteroscedasticity and random coef-ficient variation.Econometrica: Journal of the Econometric Society, 1287–1294. Clark, H. H. (1996). Using language. Cambridge
Clark, H. H. & Brennan, S. E. (1991). Grounding in communication.Perspectives on Socially Shared Cognition,13(1991), 127–149. Dickey, D. A. & Fuller, W. A. (1979). Distribution
of the estimators for autoregressive time se-ries with a unit root.Journal of the Ameri-can Statistical Association,74(366a), 427– 431.
Doyle, G. & Frank, M. C. (2015). Shared com-mon ground influences information density in microblog texts. In Proceedings of the North American Chapter of the Associa-tion for ComputaAssocia-tional Linguistics - Human Language Technologies (naacl-hlt). Denver, DO.
Dwivedi, Y. & Subba Rao, S. (2011). A test for second-order stationarity of a time se-ries based on the discrete Fourier transform. Journal of Time Series Analysis,32(1), 68– 91.
Fusaroli, R., Bahrami, B., Olsen, K., Roepstorff, A., Rees, G., Frith, C., & Tyl´en, K. (2012). Coming to terms quantifying the benefits of linguistic coordination. Psychological Sci-ence,23(8), 931–939.
Fusaroli, R., Raczaszek-Leonardi, J., & Tyl´en, K. (2014). Dialog as interpersonal synergy. New Ideas in Psychology,32, 147–157. Fusaroli, R. & Tyl´en, K. (2016). Investigating
conversational dynamics: interactive align-ment, interpersonal synergy, and collective task performance.Cognitive Science,40(1), 145–171.
Garrod, S. & Anderson, A. (1987). Saying what you mean in dialogue: a study in concep-tual and semantic co-ordination.Cognition, 27(2), 181–218.
Garrod, S. & Pickering, M. J. (2009). Joint action, interactive alignment, and dialog.Topics in Cognitive Science,1(2), 292–304.
Genzel, D. & Charniak, E. (2002). Entropy rate constancy in text. In Proc. 40th Annual Meeting on Association for Computational Linguistics(pp. 199–206). Philadelphia, PA. Genzel, D. & Charniak, E. (2003). Variation of en-tropy and parse trees of sentences as a func-tion of the sentence number. In Proceed-ings of the 2003 Conference on Empirical Methods in Natural Language Processing (pp. 65–72). Association for Computational Linguistics.
Godfrey, J. J., Holliman, E. C., & McDaniel, J. (1992). Switchboard: telephone speech cor-pus for research and development. In Inter-national Conference on Acoustics, Speech, and Signal Processing (Vol. 1, pp. 517– 520). IEEE. San Francisco, CA.
Gregory Jr, S. W. & Gallagher, T. J. (2002). Spec-tral analysis of candidates’ nonverbal vo-cal communication: predicting us presiden-tial election outcomes. Social Psychology Quarterly, 298–308.
Jaeger, T. F. (2010). Redundancy and reduction: speakers manage syntactic information den-sity.Cognitive Psychology,61(1), 23–62. Keller, F. (2004). The entropy rate principle as
a predictor of processing effort: an eval-uation against eye-tracking data. In Proc. conference on Empirical Methods in Nat-ural Language Processing (pp. 317–324). Barcelona, Spain.
Kwiatkowski, D., Phillips, P. C., Schmidt, P., & Shin, Y. (1992). Testing the null hypoth-esis of stationarity against the alternative of a unit root: how sure are we that eco-nomic time series have a unit root?Journal of Econometrics,54(1-3), 159–178.
Ljung, G. M. & Box, G. E. (1978). On a mea-sure of lack of fit in time series models. Biometrika, 297–303.
Narasimhan, S. & Veena, S. (2005). Signal pro-cessing: principles and implementation. Al-pha Science Int’l Ltd.
Natrella, M. (2010).Nist/sematech e-handbook of statistical methods. NIST/SEMATECH. Ng, S. H. & Bradac, J. J. (1993). Power in
lan-guage: Verbal communication and social in-fluence.Sage.
Orestr¨om, B. (1983).Turn-taking in english con-versation. Lund: CWK Gleerup.
Oullier, O., Bardy, B. G., Stoffregen, T. A., & Bootsma, R. J. (2002). Postural coordina-tion in looking and tracking tasks. Human Movement Science,21(2), 147–167.
Oullier, O., De Guzman, G. C., Jantzen, K. J., La-garde, J., & Kelso, S. J. (2008). Social coor-dination dynamics: measuring human bond-ing.Social Neuroscience,3(2), 178–192. Phillips, P. C. & Perron, P. (1988). Testing
Pickering, M. J. & Garrod, S. (2004). Toward a mechanistic psychology of dialogue. Behav-ioral and Brain Sciences,27(02), 169–190. Pickering, M. J. & Garrod, S. (2006). Alignment as the basis for successful communication. Research on Language and Computation, 4(2-3), 203–228.
Qian, T. & Jaeger, T. F. (2011). Topic shift in ef-ficient discourse production. InProceedings of the 33rd Annual Conference of the Cog-nitive Science Society(pp. 3313–3318). Reitter, D. & Moore, J. D. (2007). Predicting
suc-cess in dialogue. InProc. 45th Annual Meet-ing of the Association of Computational Linguistics (pp. 808–815). Prague, Czech Republic.
Reitter, D. & Moore, J. D. (2014). Alignment and task success in spoken dialogue.Journal of Memory and Language,76, 29–46.
Schuller, B., Steidl, S., Batliner, A., Burkhardt, F., Devillers, L., M¨uller, C., & Narayanan, S. (2013). Paralinguistics in speech and language-state-of-the-art and the challenge. Computer Speech and Language,27(1), 4– 39.
Shannon, C. E. (1948). A mathematical theory of communication.The Bell System Technical Journal,27, 379–423.
Stolcke, A. (2002). SRILM - an extensible lan-guage modeling toolkit. InThe 7th Interna-tional Conference on Spoken Language Pro-cessing. Denver, Colorado.
Xu, Y. & Reitter, D. (2016a). Convergence of syn-tactic complexity in conversation. In Proc. 54th Annual Meeting of the Association for Computational Linguistics (Volume 2: Short Papers)(pp. 443–448). Berlin, Germany. Xu, Y. & Reitter, D. (2016b, August).