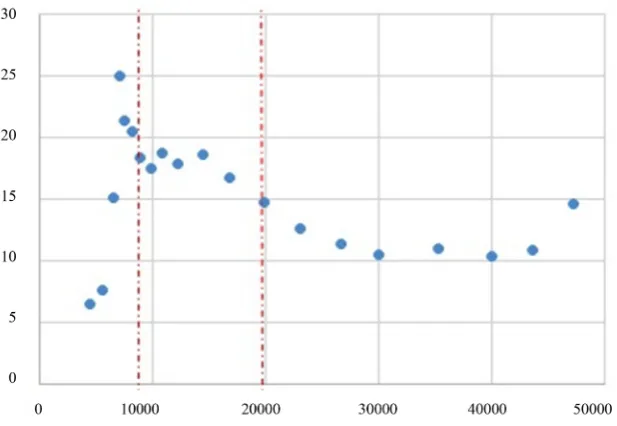
Environmental Pollution and Economic Growth in China: A Test of the Environmental Kuznets Curve
Full text
Figure


Related documents
Furthermore, large classes, lack of computers, lack of Internet and insufficient technical support are the most essential barriers discouraging teachers from integrating
A worker is considered to have a permanent incapacity (incapacidad permanente) when, after completing the prescribed treatment and having received a medical discharge, he or she
In contrast to conventional methods based on the results of an initial peak-search, the VRF analysis method forms, at each of many automated iterations, a spectrum-wide shape for
During rendering, subjects are asked to report 1) whether the perceived location is in the head, 2) the front-back reversals, and 3) whether they experience the percept of a
The purpose of this research is to examine the relationship between job resources (i.e. perceived organisational support, immediate superior support, colleague
31 In order to break down this idea of Chinese literature as a harmonizing art form into more specific and pointed thoughts that will be useful as I direct Pear Blossom Dream ,
As a result of the above, with respect to consolidated financial results for the first three months of the fiscal year ending March 31, 2021, operating revenues
Keywords: Urban transport, Urban traffic, Urban mobility, Environmental impacts evaluation, Energy demand, Equivalent fuel consumption, Traffic space